Unraveling metabolic complexity of multi-payload PEG-irinotecan prodrug: A deconvolution-based LC-Q-TOF MS approach for preclinical pharmacokinetic characterization
Citation:
Shiwen Song, Mingyang Zhao, Xiangrong Song, Huaidong Yu, Xin Xu, Dong Sun, Jingkai Gu. Unraveling metabolic complexity of multi-payload PEG-irinotecan prodrug: A deconvolution-based LC-Q-TOF MS approach for preclinical pharmacokinetic characterization[J]. Chinese Chemical Letters,
2026, 37(2): 112099.
doi:
10.1016/j.cclet.2025.112099
Unraveling metabolic complexity of multi-payload PEG-irinotecan prodrug: A deconvolution-based LC-Q-TOF MS approach for preclinical pharmacokinetic characterization
English
Unraveling metabolic complexity of multi-payload PEG-irinotecan prodrug: A deconvolution-based LC-Q-TOF MS approach for preclinical pharmacokinetic characterization
Research Center for Drug Metabolism, School of Life Science, Jilin University, Changchun 130012, China
b.
State Key Laboratory of Supramolecular Structure and Materials, Center for Supramolecular Chemical Biology, College of Chemistry, Jilin University, Changchun 130012, China
c.
School of Pharmaceutical Science, Hainan University, Haikou 570100, China
d.
Beijing Institute of Drug Metabolism, Beijing 102209, China
e.
State Key Laboratory of Biotherapy and Cancer Center, West China Hospital, Sichuan University, Chengdu 610041, China
f.
Beijing GeZhu Biotechnology Co., Ltd., Beijing 102209, China
gujk@jlu.edu.cn (J. Gu). 1 These authors contributed equally to this work.
Received Date:
11 July 2025 Accepted Date:
11 November 2025 Revised Date:
10 November 2025 Available Online:
15 February 2026
Abstract:
PEGylation, the controlled covalent conjugation of polyethylene glycol to therapeutics, enhances therapeutic efficacy through optimized pharmacokinetics. However, to date no high-molecular-weight PEGylated small-molecule prodrugs have received regulatory approval. This technological gap can be partially attributed to the exponential proliferation of metabolic intermediates resulting from multi-payload conjugation strategies, which introduces unprecedented analytical complexities in metabolite profiling and pharmacokinetic characterization. To address this challenge, we developed a liquid chromatography-triple-quadrupole/time-of-flight mass spectrometry platform for PEG20k-(irinotecan)3, a Phase Ⅲ clinical candidate. Our methodology employs payload stoichiometry-based chromatographic resolution for clustering isomeric PEG species. Complementarily, diagnostic product ions at m/z 699.83, 569.27, and 587.28 enable systematic differentiation between double-loaded, single-loaded, and released irinotecan payload. This approach successfully identifies eight metabolic clusters spanning from PEG-conjugates, cleaved PEG segments, and released small-molecule species. Its demonstrated capacity to deconvolute complex metabolic profiles—through payload-stoichiometry based chromatographic resolution coupled with diagnostic ion analysis—positions this workflow as an attractive tool for accelerating the development of PEGylated small-molecule therapeutics.
PEGylation revolutionizes biologics by enhancing solubility, extending circulation, and reducing immunogenicity through covalent polyethylene glycol (PEG) attachment [1-5]. Clinical development pipelines (ClinicalTrials.gov; Table S1 in Supporting information) of PEGylated small-molecule therapeutics highlight a strong focus on oncology applications, where PEGylation addresses chemotherapeutic challenges including rapid clearance, biodistribution, and systemic toxicity [6, 7]. While PEGylation has achieved limited clinical translation in small-molecule therapeutics, its sole success remains the heptaethylene glycol-conjugated naloxone (Movantik®) [8, 9].
High-molecular-weight (HMW) PEGylation systems (20-60 kDa) present intrinsic pharmacokinetic complexity due to their prodrug nature—regulatory mandates require comprehensive metabolic intermediate profiling (FDA excipient rules and EMA/CPMP/EWP/280/96 Corr1) [10, 11]. To address atom economy, HMW PEGylation systems adopt multi-payload architectures. Asymmetric conjugation or linker integration in such designs necessitates advanced analytical resolution to characterize payload-specific metabolites and corresponding structural isomers, representing critical technical barriers.
PEG20k-(irinotecan)3 emerges as a promising multi-payload HMW PEGylated small-molecule prodrug, currently in Phase Ⅲ trials (NCT06581380). Our preclinical studies demonstrated its enhanced antitumor efficacy and reduced systemic toxicity compared to irinotecan [12]. This engineered construct features 20 kDa linear mPEG covalently linked via an asymmetric oligopeptide linker to three stoichiometric equivalents of irinotecan. Its metabolites comprise three distinct groups: (ⅰ) PEG-conjugates with variable payload stoichiometry and three structural isomers per stoichiometric variant, (ⅱ) cleaved HMW PEG chains, and (ⅲ) released small-molecule species.
Common techniques for quantifying PEGylated pharmaceuticals in biological samples include radiolabeling, fluorescence labeling and enzyme-linked immunosorbent assay (ELISA). However, these methods often lack sensitivity and specificity, making it difficult to distinguish between metabolites of PEG-prodrugs with different payload sums and PEGs of varying molecular weights [13-16].
To address the aforementioned challenges, we developed an integrated liquid chromatography-triple-quadrupole/time-of-flight mass spectrometry (LC-Q-TOF MS) platform for systematic pharmacokinetic profiling of this complex therapeutic. The platform resolves metabolic heterogeneity through payload-driven chromatographic clustering (a strategy we term "payload-based resolution") coupled with MS fragmentation fingerprinting. Our workflow systematically differentiated intact PEG20k-(irinotecan)3 and eight distinct metabolic classes: metabolic intermediate (PEG20k-(irinotecan)x (x = 1, 2); PEG10k-(irinotecan)x (x = 1, 2, 3)), carrier residues (PEG20k and 10k), released payloads (irinotecan and SN38), and glucuronidated metabolites (SN38G).
By correlating payload stoichiometry to signature fragmentation patterns, this platform overcomes longstanding analytical barriers in HMW conjugate characterization, establishing a transformative toolkit for accelerating clinical translation of PEGylated small-molecule therapeutics.
The detailed chromatographic and mass spectrometric conditions are provided in Table S2 (Supporting information). Since PEG20k-(irinotecan)3 and its major PEGylated metabolites share the same specific product ion, achieving chromatographic baseline separation of these PEG-conjugates is crucial for comprehensive pharmacokinetic analysis. We investigated the chromatographic behavior of PEG20k-(irinotecan)3 on high-performance liquid chromatography (HPLC) columns with various stationary phases and pore sizes. The PLRP-S, Agilent 5 TC-C18(2), and Agela Venusil XBP C18 columns all produced ideal peak shapes for PEG20k-(irinotecan)3 (Fig. S1 in Supporting information). The mobile phase was subsequently optimized to establish compatible conditions for both PEG-conjugates and small-molecule metabolites.
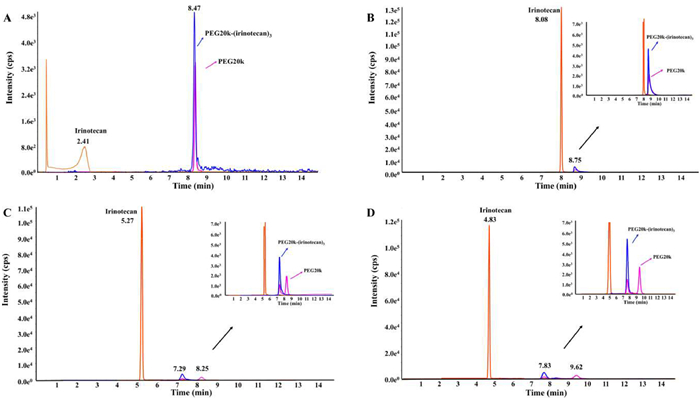
As shown in Fig. 1A, the PLRP-S column, with a large pore size (1000 Å), failed to retain small-molecule analytes effectively and produced asymmetric peaks for irinotecan. Isopropyl alcohol and acetonitrile, commonly used organic mobile phases for PEGs or PEGylated therapeutics, did not achieve the desired separation between PEG20k-(irinotecan)3 and PEG20k when combined with either the PLRP-S or Agela Venusil XBP C18 columns [14-21]. This issue was resolved through the use of a methanol-acetonitrile mixture (50/50, v/v) as the organic mobile phase combined with an ultra-pure silica column (Agilent 5 TC-C18(2)). As illustrated in Figs. 1B-D, the gradient elution program successfully separated PEG20k-(irinotecan)3 and PEG20k, with acetonitrile and methanol (50/50, v/v), containing 0.1% formic acid in solvent B, and a 0.1% formic acid aqueous solution in solvent A.
Figure 1
Figure 1.
Chromatograms of a mixture consisting of PEG20k-(irinotecan)3, PEG20k, and irinotecan: (A) on a PLRP-S 1000 Å column, (B) on an Agilent 5 TC-C18(2) column using 0.1% formic acid solution in ACN as solvent B, (C) with 0.1% formic acid in ACN/MeOH (80:20, v/v) as solvent B, and (D) with 0.1% formic acid in ACN/MeOH (50:50, v/v) as solvent B.
It is important to note that both PEG20k-(irinotecan)2 and PEG20k-(irinotecan)1 consist of three structural isomers due to the asymmetric trivalent linker (Fig. S2 in Supporting information). Under the chromatographic conditions, the isomers of PEG20k-(irinotecan)2 and PEG20k-(irinotecan)1 were grouped respectively. The standards used for their quantification also consist of these three isomers (Fig. S3 in Supporting information).
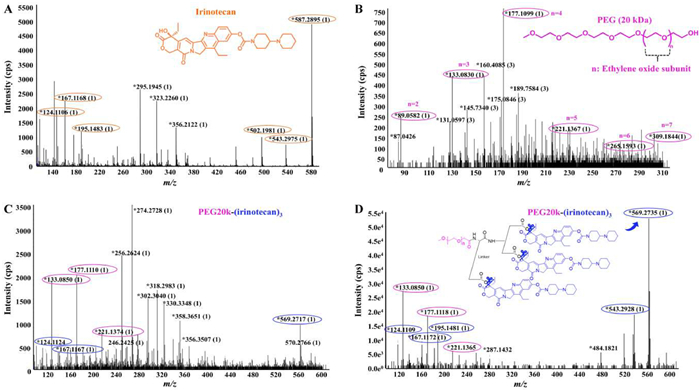
The fragmentation patterns of irinotecan, PEG20k, and PEG20k-(irinotecan)3 were investigated using the MSALL technique to identify their characteristic fragment ions (Fig. 2). For PEG20k, a series of PEG-associated product ions were observed at m/z 89.06, 133.08, 177.11, 221.14, 265.16, and 309.18, corresponding to fragments with 2 to 7 ethylene oxide subunits. The fragment ion at m/z 177.11 showed the highest intensity at a declustering potential (DP) of 100 V and a collision energy (CE) of 30 eV (Fig. 2B). By comparing the fragmentation spectra of irinotecan (Fig. 2A) and PEG20k-(irinotecan)3 (Fig. 2C), a fragment ion at m/z 569.27, specific to PEGylated irinotecan prodrugs, was identified. This fragment ion results from β-elimination of ester bonds in the PEG-conjugate, with the carboxylic acid on the linker lost as a neutral mass (Fig. 2D). Notably, the core principles of our LC-Q-TOF MS platform—namely, payload-driven chromatographic resolution and diagnostic ion-based deconvolution—suggest potential broad-spectrum applicability across various polymer-drug conjugates (e.g., PEG, PLGA, HPMA) and diverse payload classes. This methodology provides a generalizable framework for addressing system-specific complexities including polymer polydispersity and pharmacokinetic deconvolution. Future studies will focus on explicitly validating this platform for simultaneous analysis of a wider range of polymer-drug conjugates.
Figure 2
Figure 2.
Structures and full scan mass spectra acquired at a fixed DP of 100 V with CE ramping: (A) Irinotecan (CE = 30 eV), (B) PEG20k (CE = 30 eV), (C) PEG20k-(irinotecan)3 (CE = 30 eV), and (D) PEG20k-(irinotecan)3 (CE = 50 eV). Characteristic fragments are labeled for irinotecan (), PEG20k (), and; PEG20k-(irinotecan)3 ().
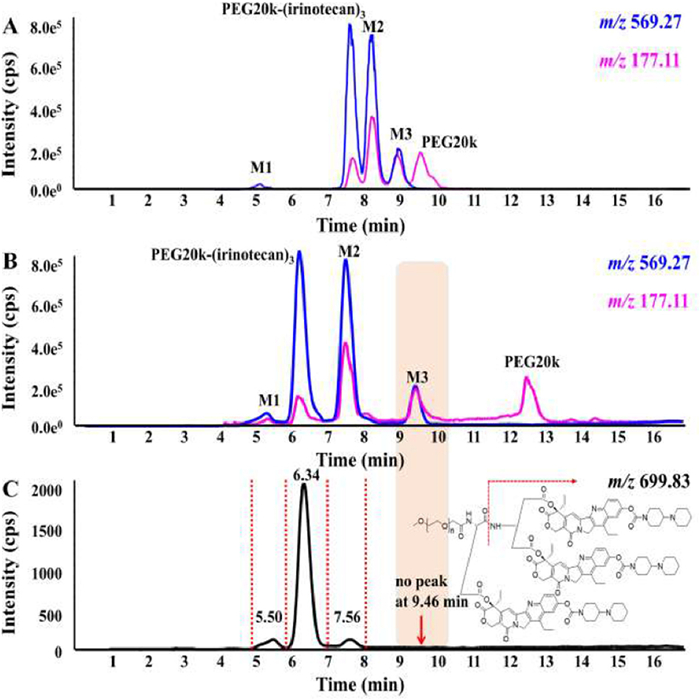
The LC-TOF MS strategy was employed to investigate metabolites in rat plasma, with sample preparation details provided in the Supporting information. In addition to the expected metabolites (irinotecan, SN38, SN38G, and PEG20k), three high-molecular-weight (HMW) metabolites (M1, M2, and M3) were detected. As shown in Fig. 3A, the chromatographic peaks of PEG20k-(irinotecan)3 and PEG20k are eluted on either side of the peaks corresponding to metabolites M2 and M3. A gradient elution from 70% to 95% solvent B over 13 min effectively resolved PEG20k-(irinotecan)3 and its metabolites, as demonstrated in Fig. 3B. The optimized retention times were determined as follows: M1 (5.50 min), PEG20k-(irinotecan)3 (6.34 min), M2 (7.56 min), M3 (9.46 min), and PEG20k (12.55 min). Based on polarity considerations, M2 was tentatively assigned as PEG20k-(irinotecan)2, while M3 was proposed to be PEG20k-(irinotecan)1. Supporting evidence from the extracted ion chromatogram of m/z 699.83 (identified as the doubly protonated adduct ion of irinotecan-Gly-Lys-Gly-irinotecan; Fig. 3C) corroborated this assignment. Given the structural asymmetry of the trivalent oligo-peptidyl linker, only PEG20k-(irinotecan)3 and one diastereomer of PEG20k-(irinotecan)2 were found to contain this specific structural motif. The m/z 699.83 signals co-eluted with M1, PEG20k-(irinotecan)3, and M2, but were absent at the retention time of M3 (9.46 min). This observation confirmed that M2 and M3 correspond to PEG20k-(irinotecan)2 and PEG20k-(irinotecan)1, respectively. Authentic standards of both PEG-conjugates were synthesized to unequivocally confirm the identities of M2 and M3. The corresponding mass spectra of PEG20k-(irinotecan)2, PEG20k-(irinotecan)1, SN38, and SN38G are presented in Fig. S4 (Supporting information).
Figure 3
Figure 3.
(A) Plasma chromatogram acquired using a linear gradient elution from 30% to 85% solvent B over 8 min. (B) Plasma chromatogram with gradient elution from 70% to 95% solvent B over 13 min. (C) Extracted ion chromatogram (m/z 699.83) showing diagnostic fragments of PEG20k-(irinotecan)x (x = 2, 3).
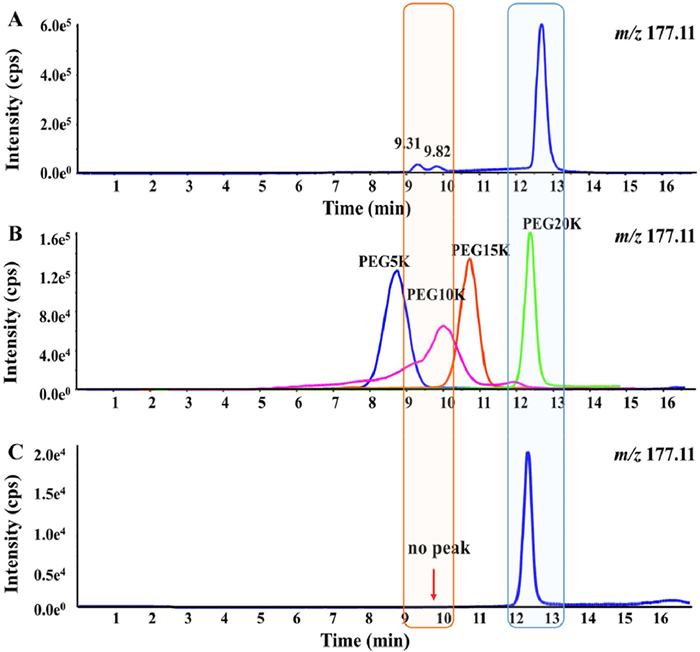
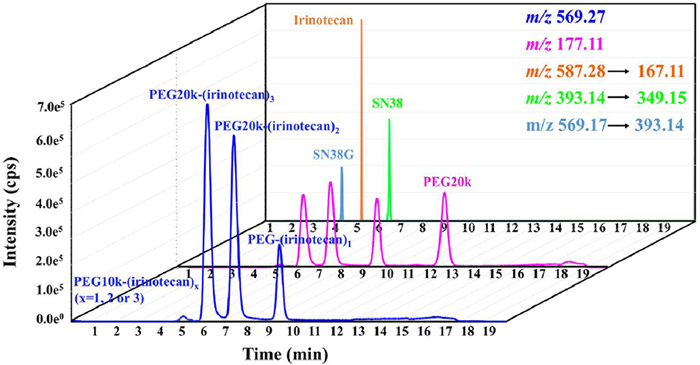
Thus, M1 remains structurally uncharacterized. To elucidate its identity (proposed as PEG10k-(irinotecan)x where x = 1, 2, or 3), we performed alkaline hydrolysis on plasma samples. Specifically, 100 µL of processed plasma was mixed with 100 µL of 9 mmol/L KOH, with aliquots collected at 2-, 4-, and 6-h intervals post-agitation. Hydrolysis abolished chromatographic signals for both M1 and PEG20k-(irinotecan)x (x = 1, 2, 3) (Fig. S5 in Supporting information). Intriguingly, the extracted ion chromatogram for m/z 177.11 revealed two minor peaks at 9.31 and 9.82 min alongside PEG20k (12.55 min) (Fig. 4A). Calibration against PEG standards (Fig. 4B) indicated these species had molecular weights approximating 10 kDa. Crucially, the absence of low-molecular-weight (LMW) PEG degradation products in PEG20k-(irinotecan)3 hydrolyzates (Fig. 4C) confirms PEG10k originated from PEGylated metabolites. The combined evidence of LC polarity shifts and diagnostic MS/MS fragments (m/z 177.11, 569.27, 699.83) strongly supports M1's identity as PEG10k-(irinotecan)x. However, quantitative analysis remains challenging due to unavailability of M1 reference standards and co-elution of PEG10k with PEG20k-(irinotecan)1. Fig. 5 illustrates representative metabolite profiles in 1-h plasma samples, with internal standard chromatograms provided in Fig. S6 (Supporting information).
Figure 4
Figure 4.
Chromatograms acquired with a linear gradient (70% → 95% solvent B over 13 min): (A) Extracted ion chromatogram (EIC) of m/z 177.11 from the hydrolyzed plasma sample, (B) PEG standard series (MW 5k-20k Da) EIC profiles, (C) m/z 177.11 EIC of PEG20k-(irinotecan)3 hydrolyzate.
The method was validated for selectivity, sensitivity (Fig. S7 in Supporting information), linearity (with the calibration curve shown in Table S3 and Fig. S8 in Supporting information), precision, accuracy, carryover, matrix effect, recovery, dilution integrity, and stability. The ethics approval number for this study is HPIACUC2023078. No significant endogenous interference was observed for the analytes or the internal standard. Detailed results on accuracy, precision, recovery, matrix effect, and stability for PEG20k-(irinotecan)3 and its major metabolites are provided in Tables S4-S6 (Supporting information). To address the pharmacokinetic of the prodrug and its metabolites, we performed quantitative analysis of PEG20k-(irinotecan)3 and major metabolites (PEG20k-(irinotecan)2, PEG20K-(irinotecan)1, PEG20k, irinotecan, and SN38) in rat plasma over a 48 h period post-administration [12]. This analysis confirmed prolonged systemic exposure of high-molecular-weight conjugates and payload-driven metabolic progression.
Central to this platform is a deconvolution strategy designed to unravel the inherent complexity of multi-payload PEGylated prodrug metabolism. This approach synergizes two complementary techniques: (1) Chromatographic separation based on payload stoichiometry, which clusters structural isomers, and (2) TOF MS analysis using diagnostic ions (m/z 699.83, 569.27, and 587.28), which enables definitive differentiation between double-loaded, single-loaded, and released irinotecan species. This dual-dimensional resolution is critical for accurately identifying and quantifying the full spectrum of metabolic intermediates, from intact conjugates to cleaved PEG chains and released small molecules.
We established a high-throughput LC-Q-TOF MS platform for concurrent characterization and quantification of HMW and small-molecule metabolites derived from the trivalent PEGylated prodrug PEG20k-(irinotecan)3. Through strategic column selection and gradient elution optimization, this methodology achieves payload stoichiometric variant resolution and structural isomer clustering across PEG-conjugates, demonstrating effective retention, peak symmetry, and baseline separation. Diagnostic product ions at m/z 699.83, 569.27, and 587.28 enable differentiation between double-loaded, single-loaded, and released irinotecan. This workflow enables direct, comprehensive quantitative analysis of PEG20k-(irinotecan)3 and its in vivo metabolites, including PEG20k-(irinotecan)2, PEG20k-(irinotecan)1, PEG20k, PEG10k-(irinotecan)x (x = 1, 2 or 3), PEG10k, irinotecan, SN38, and SN38G. This platform resolves pivotal analytical challenges in characterizing HMW, multi-payload PEG-conjugated small molecules while establishing a standardized preclinical evaluation framework for diverse polymer-drug conjugates, accelerating their clinical advancement.
Declaration of competing interest
The authors declare that they have no known competing financial interests or personal relationships that could have appeared to influence the work reported in this paper.
The authors gratefully acknowledge financial support from the National Natural Science Foundation of China (Nos. 82030107, 82304443, 82373944) and the Hainan Provincial Natural Science Foundation of China (No. 825QN288).
Supplementary materials
Supplementary material associated with this article can be found, in the online version, at doi:10.1016/j.cclet.2025.112099.
[1]
Y. Gao, M. Joshi, Z. Zhao, S. Mitragotri, Bioeng. Transl. Med. 9 (2024) e10600. doi: 10.1002/btm2.10600
M. Daniali, S. Nikfar, M. Abdollahi, Expert Opin. Pharmacother. 21 (2020) 883–891. doi: 10.1080/14656566.2020.1735354
[10]
FDANonclinical Studies for the Safety Evaluation of Pharmaceutical Excipients (Guidance), 2005 https://www.fda.gov/regulatory-information/search-fda-guidance-documents/nonclinical-studies-safety-evaluationpharmaceutical-excipients.
[11]
EMA-CHMPGuideline on the Pharmacokinetic and Clinical Evaluation of Modified Release Dosage Forms (EMA/CPMP/EWP/280/96 Corr1), 2015 https://www.ema.europa.eu/en/documents/presentation/presentation-emaegaworkshop-guideline-pharmacokinetic-and-clinical-evaluation-modifiedrelease-dosage-forms-beata-stepniewska_en.pdf.
[12]
S. Song, D. Sun, H. Wang, et al., Acta Pharm. Sin. B 13 (2023) 3444–3453. doi: 10.1016/j.apsb.2023.01.011
[13]
Z. Zhang, Y. Zhang, S. Song, et al., J. Sep. Sci. 43 (2020) 1978–1997. doi: 10.1002/jssc.201901340
Figure 1
Chromatograms of a mixture consisting of PEG20k-(irinotecan)3, PEG20k, and irinotecan: (A) on a PLRP-S 1000 Å column, (B) on an Agilent 5 TC-C18(2) column using 0.1% formic acid solution in ACN as solvent B, (C) with 0.1% formic acid in ACN/MeOH (80:20, v/v) as solvent B, and (D) with 0.1% formic acid in ACN/MeOH (50:50, v/v) as solvent B.
Figure 2
Structures and full scan mass spectra acquired at a fixed DP of 100 V with CE ramping: (A) Irinotecan (CE = 30 eV), (B) PEG20k (CE = 30 eV), (C) PEG20k-(irinotecan)3 (CE = 30 eV), and (D) PEG20k-(irinotecan)3 (CE = 50 eV). Characteristic fragments are labeled for irinotecan (), PEG20k (), and; PEG20k-(irinotecan)3 ().
Figure 3
(A) Plasma chromatogram acquired using a linear gradient elution from 30% to 85% solvent B over 8 min. (B) Plasma chromatogram with gradient elution from 70% to 95% solvent B over 13 min. (C) Extracted ion chromatogram (m/z 699.83) showing diagnostic fragments of PEG20k-(irinotecan)x (x = 2, 3).
Figure 4
Chromatograms acquired with a linear gradient (70% → 95% solvent B over 13 min): (A) Extracted ion chromatogram (EIC) of m/z 177.11 from the hydrolyzed plasma sample, (B) PEG standard series (MW 5k-20k Da) EIC profiles, (C) m/z 177.11 EIC of PEG20k-(irinotecan)3 hydrolyzate.

 DownLoad:


 下载:
下载:


