
Figure 1.
(a) Chemical reaction diagram of chiral MBIC and chiral AAs. (b) Mass spectrum of the compound of MBIC and AAs.
Rigid urea-based structures drive analysis of chiral amino acids
Yanhui Zhong , Peisi Xie , Chengyi Xie , Lei Guo , Weiwei Chen , Shuyi Wang , Xiaoxiao Wang , Fuyue Wang , Zian Lin , Gongke Li , Zongwei Cai

Chiral compounds are prevalent in nature, particularly within biological systems, including chiral amino acids (AAs), carbohydrates, and nucleic acids [1]. Chiral AAs serve as the essential building blocks of proteins and play vital physiological roles in living organisms [2]. While nearly all natural proteins are composed of l-amino acids, their precise roles in protein synthesis and cellular metabolism continue to elude complete scientific understanding [3]. Enzymatic conversion [4] and spontaneous inversion [5] may facilitate the transformation of l-AAs to d-AAs, and upon the death of an organism, chiral AAs experience racemization [6]. On the other hand, elevated levels of free d-amino acids have been implicated in various pathological conditions, including cataracts, Alzheimer's disease, and multiple sclerosis [7]. Given the essential roles of chiral AAs in organisms, precise chiral AAs analysis has become invaluable for progress in diverse fields ranging from clinical diagnosis and drug discovery to biochemical research and archaeological dating.
Developing a method to the simultaneous analysis of chiral compounds in complex samples typically necessitates sample preparation methods, which may include the use of chiral sensing elements [8-10], chiral separation materials [11-13], and chiral derivatization reactions [14-16]. Enhanced sensitivity and efficacy render chiral derivatization strategies increasingly invaluable and significant for enantiomeric analysis [17, 18]. The fundamental mechanism of chiral derivatization involves reacting the analyte with a chiral or achiral reagent to form a labeled chiral analyte [19, 20]. These labeled chiral analytes exhibit different physicochemical properties in conventional detection systems, such as varying molecular sizes or differing hydrophilic/hydrophobic characteristics [21, 22]. This facilitates the integration of chiral derivatization methods with various analytical techniques, such as, Liquid chromatography-mass spectrometry based on chiral stationary phase [23-25], allowing for the simultaneous analysis of multiple chiral compounds in complex samples.
Given the critical role of chiral AAs analysis in biological samples, it is imperative to develop a versatile derivatization approach adaptable to diverse analytical platforms. Reportedly, the amino group in chiral AAs is highly reactive and readily interacts with most derivatization reagents, forming secondary or tertiary amines [26-28]. Protonation at the amino moiety will generate a stereogenic tertiary or quaternary amine [29], thereby complicating the analysis of chiral AAs. The urea structure (-NH—CO—NH-) consists of two amino groups (-NH-) and one carbonyl group (C=O). The amino groups (-NH-) of urea structure adjacent to the benzene ring forms a rigid plane due to π-π interactions [30]. As a result, the secondary amine in the urea structure avoids protonation [31] and instead interacts with anionic groups, forming stabilizing hydrogen bonds [32]. Moreover, both theoretical and experimental analyses show that the introduction of rigid structure creates distinct host-guest interactions, thereby significantly improving chiral separation performance [33-35]. The chiral methylbenzyl isocyanate (MBIC) readily forms rigid urea structures with amino-containing analytes [36], such as citalopram [37], salbutamol [38], epinephrine [39], and terbutaline [40]. Inspired by this, MBIC chiral can be designed as candidate derivatization reagents to produce labeled chiral AAs containing a rigid urea-based structure.
In this work, we conducted the first study on the reaction between chiral MBIC and chiral AAs, resulting in labeled AAs. The labeled l-AAs allowed the carboxyl group to form intramolecular hydrogen bonds with the amino group within the rigid urea-based structure, whereas the labeled d-AAs were unable to form such bonds. Due to their structural differences, the energy, molecular size, and logP of the labeled AAs varied. Quantitative analysis of chiral AAs in biological samples has been achieved using ultra-performance liquid chromatography-tandem mass spectrometry (UPLC-MS). Additionally, the distribution of chiral AAs in mouse brain tissue has been studied using matrix-assisted laser desorption/ionization trapped ion mobility spectrometry mass spectrometry imaging (MALDI-TIMS-MSI). Preliminary results suggest our method might offer certain improvements in chiral analysis.
The reaction between chiral MBIC and chiral AAs, alanine (Ala), valine (Val), isoleucine (Ile), proline (Pro), methionine (Met), phenylalanine (Phe), tyrosine (Tyr), cysteine (Cys), serine (Ser), threonine (Thr), aspartic acid (Asp), asparagine (Asn), glutamic acid (Glu), glutamine (Gln), tryptophan (Trp), lysine (Lys), arginine (Arg), and histidine (His) has been studied. The derivatization reaction method was illustrated in Fig. 1a and detailed in Supporting information. The amino group reacted with the isocyanate group to form a peptide bond, leading to the conversion of AA enantiomers into non-enantiomers. The mass spectrum of the labeled AAs suggests that the derivatization reaction of the isocyanate was successfully carried out, as illustrated in Fig. 1b. For example, the product of the reaction between chiral MBIC and chiral Ala was referred to as labeled Ala, with a molecular weight of 235.11 ± 0.01. Similarly, the product of chiral MBIC and chiral Tyr, known as labeled Tyr, has a molecular weight of 327.13 ± 0.01. It has been confirmed that the reaction between MBIC and AAs could produce new labeled AAs, it was also essential to identify the reaction sites on the AAs. The determination of daughter ions was an important method for analyzing the structure of compounds using MS. The precursor ions and daughter ions of the labeled chiral AAs were listed in Table S1 (Supporting information). The molecular weight of the daughter ions obtained from the labeled chiral AAs matches that of the chiral AAs. For example, the daughter ions of labeled Ala have molecular weights of 88.04 ± 0.01, corresponding to the molecular weights of Ala. Similarly, the daughter ions of labeled Tyr have molecular weights of 180.07 ± 0.01, corresponding to tyrosine. This result indicated that the fragmentation site of the labeled AAs was the amide bond, also confirming that the reaction site of the AAs with MBIC is the amino group.
To maximize chemical labeling efficiency, the reaction conditions, such as the molar ratio of MBIC to AAs, the pH of the reaction solution, reaction temperature, reaction time were systematically optimized using ESI-MS/MS. The optimal MS intensity of the labeled AAs were obtained under specific experimental conditions (Fig. S1 in Supporting information). The derivatization reaction was carried out at a molar ratio of 2:1 (MBIC: AAs) in a solution with pH 10.5, under conditions of 40 ℃ for 60 min. The labeling efficiencies of 19 kinds of AAs were examined under the optimized conditions. The calculated labeling efficiencies toward AAs were evaluated by comparing the MS intensity of AAs before and after the labeling reaction (Fig. S2 in Supporting information). And the efficiencies of chemical labeling were over 95%, demonstrating that the MBIC-based labeling strategy is appropriate for AAs analysis. The stability of chiral MBIC labeled AAs solutions under various storage conditions was investigated using ESI-MS/MS. Solutions of R-MBIC labeled l-Ala, R-MBIC labeled d-Ala, S-MBIC labeled l-Ala, and S-MBIC labeled d-Ala, each at a concentration of 10.0 µg/L, were stored at 25, 4, −20, and −80 ℃, respectively. As illustrated in Fig. S3 (Supporting information), the MS intensity of MBIC labeled Ala at m/z = 235.11 ± 0.01 was utilized to evaluate the stability of the labeled chiral AAs. The results demonstrated that chiral MBIC labeled AAs remained stable for 16 h at 25 ℃, 4 days at 4 ℃, and up to 4 months at −20 ℃ and −80 ℃.
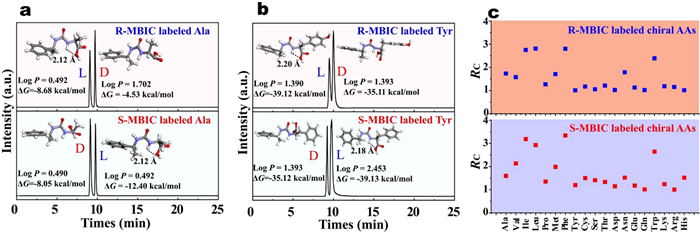
The physicochemical properties of labeled chiral AAs was vital for understanding the derivatization reaction mechanism. Gaussian09 quantum chemistry packages were used for quantitative calculation of chiral MBIC labeled AA enantiomer pairs. The DFT was chosen to optimize the ground state geometries by B3LYP basis set in the 6–311G(d, p) level. The optimal geometries of labeled AA enantiomer pairs were detailed in Fig. S4 (Supporting information). After AA enantiomer pairs were labeled with chiral MBIC, the resulting diastereomers form a rigid urea-based structure (NH—CO—NH), which could fix the molecular geometry. For R-MBIC or S-MBIC labeled l-AAs, the amino group on the rigid urea-based structure connected to the chiral carbon atom could form an intramolecular hydrogen bond with the carboxyl group. Such as, the intramolecular hydrogen bond length for R-MBIC labeled l-Ala was 2.12 Å, and for S-MBIC labeled l-Ala, it was also 2.12 Å. While neither R-MBIC nor S-MBIC labeled d-AAs form intramolecular hydrogen bonds. Analyzing the structural features of labeled analytes is essential to elucidate how derivatization governs chiral separation, as the analytical techniques measures labeled analytes.
Further, quantum chemical calculation methods could be utilized to simulate the reaction process, calculate the energies of the reactants and products, and assess the stability of various reaction pathways. The reactions between chiral MBIC and each enantiomeric AA were illustrated in Figs. S5 and S6 (Supporting information). The Gibbs free energy change (ΔG) for the formation of labeled chiral AAs was < 0, and the ΔG for the formation of labeled l-AAs was less than that for the formation of labeled d-AAs. For example, the ΔG for the formation of R-MBIC labeled l-Ala was −8.68 kcal/mol, while for R-MBIC labeled d-Ala it was −4.53 kcal/mol; similarly, the ΔG for the formation of S-MBIC labeled l-Ala was −12.4 kcal/mol, while for S-MBIC labeled d-Ala it was −8.05 kcal/mol. This indicated that the intramolecular hydrogen bonds formed in R/S-MBIC labeled l-AAs result in lower ΔG and more stable products, whereas the absence of such hydrogen bonds in R/S-MBIC labeled d-AAs leads to higher ΔG and less stable products. This understanding provides theoretical guidance for developing and optimizing chiral separation analytical methods.
Through theoretical calculations, the differences between labeled d-AAs and labeled l-AAs in terms of molecular structure and ΔG may potentially be utilized for their separation. The chromatography separation effects were investigated by UPLC-MS for chiral MBIC labeled chiral AAs complexes. The good chiral separation result of R-MBIC and S-MBIC labeled 19 pairs of AAs enantiomers were obtained on C18 column as shown in Fig. S7 (Supporting information). R-MBIC labeled l-AAs elute before R-MBIC labeled d-AAs, S-MBIC labeled l-AAs elute after S-MBIC labeled d-AAs. For example, the retention time for R-MBIC labeled l-Ala was 8.50 min, for R-MBIC labeled d-Ala was 9.14 min, for S-MBIC labeled l-Ala was 8.49 min, and for S-MBIC labeled d-Ala was 9.13 min. This consistent separation phenomenon has motivated us to investigate the reasons behind the UPLC-MS separation of chiral MBIC labeled AAs enantiomers.
To gain a deeper understanding of the chromatographic separation mechanism of chiral MBIC labeled AAs enantiomers, their molecular structure and partition coefficient (logP) were analyzed. Representative enantioseparation chromatograms of chiral MBIC labeled Ala and Tyr enantiomers were shown in Figs. 2a and b. As mentioned earlier, l-AAs can form intramolecular hydrogen bonds, whereas d-AAs were unable to form these bonds. Contributing to the ΔG for the formation of labeled l-AAs was lower than that for the formation of labeled d-AAs. These structural differences lead to variations in logP values. Labeled chiral AAs with lower logP values exhibited weaker retention on a C18 column and eluted faster in UPLC-MS. For example, R-MBIC labeled l-Tyr eluted earlier than R-MBIC labeled d-Tyr, with logP values of 1.390 and 1.392, respectively. Similarly, S-MBIC labeled d-Tyr eluted earlier than S-MBIC labeled l-Tyr, with logP values of 1.393 and 2.453, respectively. The resolution factors (RC) obtained from these well-resolved chromatographic separation curves were presented in Fig. 2c. RCR and RCS represent the RC of AA enantiomer pairs labeled with R-MBIC and S-MBIC, respectively. Both RCR and RCS were greater than or equal to 0.9, demonstrating that the labeled AA enantiomer pairs could be effectively separated by UPLC-MS.
The mobility separation effects were investigated by MALDI-TIMS-MS for enantiomer complexes. To validate the analytical capability of MALDI-TIMS-MS for labeled chiral AAs, R-MBIC labeled l-Ala was used as a representative. The mass spectrum of R-MBIC labeled l-Ala obtained by MALDI-TIMS-MS was shown in Fig. S8a (Supporting information). The ion mobilograms for m/z 235.11 ± 0.01 was created by plotting 1/K0 (inverse reduced mobility, hereafter referred to as "mobility") against intensity (Fig. S8b in Supporting information). This indicated that MALDI-TIMS-MS has significant potential for separating labeled chiral AAs. All R-MBIC and S-MBIC labeled 19 pairs of chiral AAs were investigated, and extracted ion mobilograms of R-MBIC and S-MBIC labeled chiral AAs were presented in Fig. S9 (Supporting information). The successful separation of 19 pairs of AA enantiomers labeled with R/S-MBIC were achieved. Interestingly, MALDI-TIMS-MS consistently separated these 19 pairs of chiral AAs in a distinct pattern: for R-MBIC labeled enantiomers, the 1/K0 of l-AAs were greater than d-AAs, whereas for S-MBIC labeled enantiomers, l-AAs were lower than d-AAs. This consistent separation phenomenon has prompted us to investigate the underlying mechanisms of MALDI-TIMS-MS in the separation of chiral MBIC labeled AA enantiomers.
To better understand the separation mechanisms of chiral MBIC labeled AA enantiomers using MALDI-TIMS-MS, their molecular structure, energy, and collision cross section (CCS) were examined. As previously discussed, the ΔG for the formation of chiral MBIC labeled l-AAs was lower than that of chiral MBIC-labeled d-AAs due to the formation of intramolecular hydrogen bonds. The presence or absence of these intramolecular hydrogen bonds might be a contributing factor to the ability of MALDI-TIMS-MS to effectively separate chiral AAs. The process of separating ions using MALDI-TIMS-MS was based on the differences in their CCS values [41]. The comparison of the calculated CCScal and CCSexp for R-MBIC and S-MBIC labeled chiral AAs was presented in Tables S2 and S3 (Supporting information). It was found that the calculated CCS (CCScal) closely matched the experimentally determined CCS (CCSexp), with a relative error of < 4.7%.
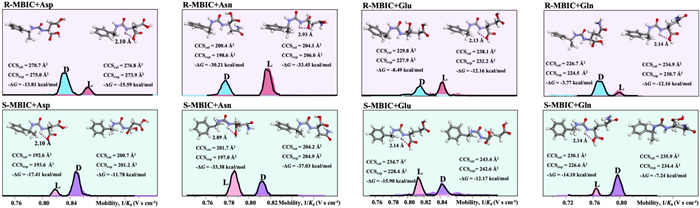
Representative TIMS differentiation of chiral MBIC labeled Asp, Asn, Glu and Gln enantiomers were shown in Fig. 3. R-MBIC-labeled l-Asp exhibited larger CCS values (CCScal = 276.8 Å2, CCSexp = 273.9 Å2) and higher mobility than its d-enantiomer (CCScal = 200.7 Å2, CCSexp = 205.0 Å2). Conversely, S-MBIC-labeled l-Glu showed smaller CCS values (CCScal = 194.7 Å2, CCSexp = 198.4 Å2) compared to d-Glu (CCScal = 243.4 Å2, CCSexp = 242.6 Å2). The likely explanation was that chiral MBIC-labeled AAs form a rigid urea-based structure, where the l-AA derivatives exhibit intramolecular hydrogen bonding, while the d-AA derivatives do not. This structural difference resulted in variations in CCS, enabling MALDI-TIMS-MS to effectively distinguish between the labeled chiral AA pairs. To quantify separation efficiency, the extraction ion mobilograms peaks and peak resolution of labeled chiral AA pairs are defined as RT. The RT of resolved R-MBIC and S-MBIC labeled 19 chiral AA pairs were all greater than 0.6 (Fig. S10 in Supporting information), indicating that the labeled AA enantiomer pairs can be effectively separated by MALDI-TIMS-MS.
Our research indicated that the more stable the molecular structure of chiral MBIC labeled l-AAs, the smaller the ΔG. This ΔG further causes differences in the logP or CCS of chiral MBIC labeled AAs, leading to distinguishable patterns in UPLC-MS and MALDI-TIMS-MS. The chiral MBIC labeled AAs of molecular weight, differences in ΔG (ΔΔG, the absolute value of ΔG of l-AA minus ΔG of d-AA), differences in logP (ΔlogP, the absolute value of logP of l-AA minus logP of d-AA), differences in CCS(ΔCCS, the absolute value of CCS of l-AA minus CCS of d-AA), RC, and RT were listed in Table S4 (Supporting information). The Pearson correlation coefficient (PCC) was calculated to analyze the correlation between these parameters (Fig. S11 in Supporting information) [42]. The result revealed that RC exhibited well correlation to ΔΔG (PCC of R-MBIC labeled AA pairs = 0.72, PCC of S-MBIC labeled AA pairs = 0.80, p-value of R-MBIC and S-MBIC labeled AA pairs ≤ 0.052). The greater the ΔΔG caused by structural differences, the greater the RC. Interestingly, this phenomenon mirrored the founding from UPLC-MS, where the energy of labeled l-AA was lower than that of labeled d-AA, resulting in distinct retention times on the C18 column. For R-MBIC labeled chiral AAs, RT exhibited well correlation to ΔCCS (PCC = 0.68, p-value ≤ 0.052). The greater the ΔCCS caused by structural differences, the greater the RT. This was similarly observed in MALDI-TIMS-MS results, where the CCS of R-MBIC labeled l-AA was higher than that of labeled d-AA, leading to variations in their mobility. Another fascinating discovery was the moderate correlation between |ΔlogP| differences and RT (PCC of R-MBIC labeled AA pairs = 0.50, PCC of S-MBIC labeled AA pairs = 0.51, p-value of R-MBIC and S-MBIC labeled AA pairs ≤ 0.052). This suggested that greater |ΔlogP| due to structural differences results in higher RT. This insight implies that researchers could potentially leverage differences in logP values to achieve the separation of chiral compounds using MALDI-TIMS-MS.
After confirming the separation efficiency of AA enantiomers, the separation application was investigated. Determining the enantiomeric excess (ee) of chiral mixtures ensures drug efficacy and safety, reaction selectivity, quality control, regulatory compliance, and environmental impact assessment. To probe the application of chiral MBIC labeling strategy in determination of ee, UPLC-MS and MALDI-TIMS-MS were used to measure a series of mixtures consisting of different percentages of AA enantiomers. The trends of the peak area or intensity of the mixture versus the percentages of l-AAs and d-AAs were plotted in Figs. S12 and S13 (Supporting information), respectively. Linear-regression analysis shows that the peak area or intensity were linearly related to the percentages of the enantiomers in the mixture. It is easy to calculate the percentage of each enantiomer in a mixture based on the UPLC-MS peak areas or MALDI-TIMS-MS intensity, and from these percentages, the ee can be determined [43]. The determination of the ee value is the basis for the qualitative and quantitative analysis of chiral compounds in a mixture.
Upon definite that the MBIC labeling method could determine ee values, a study was initiated to quantitatively analyze chiral AAs using UPLC-MS. The UPLC-MS detection method of chiral AAs were detailed in Supporting information. The calibration equations, linear ranges and limits of detection (LODs, S/N ≥ 3) of the UPLC-MS method were listed in Table S5 (Supporting information). The UPLC-MS method showed good linearity in the range of 0.22–27.4 µg/L with a correlation coefficient (R2) higher than 0.9885. The LODs for the 8 pairs of AA enantiomers were in the range of 0.06–0.11 µg/L. Compared to other UPLC-MS methods for chiral AA analysis (Table S6 in Supporting information), the MBIC derivatization-based approach achieves simultaneous resolution of 19 enantiomeric pairs within 30 min using only a C18 column, while demonstrating superior LOD. The applicability of the established UPLC-MS method for the detection of complex samples were further evaluated. All human serum samples were provided by Shenzhen Second People's Hospital, the use of human serum samples were approved by the category of RGC projects in Hong Kong. The concentration of chiral AAs in human serum were shown in Tables S7 and S8 (Supporting information). The recoveries of the UPLC-MS method for chiral AAs were in the range of 74.5%−115.4%. The UPLC-MS method based on MBIC labeling can measure the differences in the concentrations of 8 kinds of l-AAs (l-Ala, l-Val, l-Leu, l-Ile, l-Pro, l-Cys, l-Thr and l-Gln) and d-AAs (d-Leu, d-Ile, d-Cys, d-Gln) in the serum of healthy human and Parkinson's patients. Fig. 4a shown that l-Ile and d-Cys were not detected in the serum samples of Parkinson's patients. d-Leu and d-Ile were not detected in the serum samples of healthy individuals. This finding was consistent with previously reported evidence that researchers investigating Parkinson's disease model mice [44]. Additionally, the concentration of l-Val in these patients' serum samples was significantly lower than that in healthy individuals. This result was insufficient to establish robust biological explanations due to the limited dataset size, but our method provided a novel approach for clinical research on AA-based disease biomarkers.

The detection of chiral AAs in the brain was essential for uncovering neurotransmission mechanisms, diagnosing and monitoring neurological diseases, developing targeted therapies, advancing neuroscience research, and supporting personalized medicine [45, 46]. In this study, the mice brains were used as a biological model to explore application of the chiral MBIC labeling combined with MALDI-TIMS-MSI method for detection of chiral AAs in the brain. The sample preparation methods, data acquisition methods, and data analysis methods for MALDI-TIMS-MSI were described in Supporting information. All mice experiments were approved by the Animal Ethics Committee of Fuzhou University, the approval number is 2024-SG-001. The extracted ion mobilograms of all observed R/S-MBIC labeled AAs in brain extracts were presented in Fig. S14 (Supporting information). The CCS of R/S-MBIC labeled chiral AAs were calculated using Gaussian View. Ion structure can be determined by comparing the CCScal values to those generated by a computational model. For example, R-MBIC labeled Ala exhibited a peak at m/z 235.11 ± 0.01 in the mass spectrum of mouse brain extracts. In the extracted ion mobilograms of m/z = 235.11 ± 0.01, two peaks were observed. And the CCSexp of these two peaks are very close to the CCScal of R-MBIC labeled l-Ala and R-MBIC labeled d-Ala. A total of 24 kinds of chiral AAs were detected in mouse brain extracts.
Based on the MBIC-enabled chiral separation ability exhibited in tissue extracts, the separation ability of MBIC derivatization in tissue sections by MALDI-TIMS-MSI were further investigated. Regarding the sample preparation for MALDI-MSI analysis, the concentrations and solvent composition of the N-(1-naphthyl) ethylenediamine dihydrochloride (NEDC) matrix was necessary for the acquisition of high-quality MSI results. Reportedly NEDC can form relatively uniform crystals (that is ideal for consistent MALDI results) on tissues when using a solvent system of MeOH: H2O (v: v = 7:3) [47]. The concentration optimization results for the NEDC matrix are presented in Table S9 (Supporting information). When the concentration of the NEDC matrix was tested at 5, 6, 7, 8, and 9 mg/mL, the number of detectable AA species was 8, 8, 8, 16, and 9, respectively. Therefore, 8 mg/mL was selected as the optimal NEDC concentration for maximizing AAs coverage. Fig. 4b presented the extracted ion mobilograms of all observed chiral MBIC labeled chiral AAs in the mice brain. The distribution of 24 chiral AAs was observed in the mouse brain using MALDI-TIMS-MSI. This result was consistent with the types of chiral AAs that could be detected in mouse brain extracts. Our previous MALDI-TIMS-MSI methodology was limited to detecting 11 chiral AAs in mouse brain tissue [22]. In contrast, the current MBIC derivatization-based approach enables comprehensive detection of 24 chiral AA species. The method based on rigid urea-based structure for distinguishing chiral AAs could be used to observe the spatial distribution of chiral compounds in tissues.
In conclusion, we conducted the first study on the impact of rigid urea-based structures in chiral compounds on chiral separation. Labeled l-AAs allowed the carboxyl group to form intramolecular hydrogen bonds with the amino group in the rigid urea-based structure, whereas labeled d-AAs were unable to form such bonds. These structural differences led to distinct chromatographic and ion mobility separation of the labeled AA pairs. The UPLC-MS method utilizing MBIC labeling enabled the quantitative detection of 12 chiral AAs in the serum of both healthy individuals and Parkinson's disease patients. Using MBIC labeling combined with MALDI-TIMS-MSI, the distribution of 24 chiral AAs has been successfully visualized in the mouse brain. Due to limited sample availability, the biological explanation of this study requires further validation. Given the urgency of chiral separation, the derivatization method developed in this work, which combines UPLC-MS with MALDI-TIMS-MSI, establishes a robust analytical method for forthcoming chiral metabolomics research.
The authors declare that they have no known competing financial interests or personal relationships that could have appeared to influence the work reported in this paper.
Yanhui Zhong: Writing – original draft, Visualization, Supervision, Methodology, Investigation, Funding acquisition, Data curation, Conceptualization. Peisi Xie: Validation, Methodology. Chengyi Xie: Methodology, Investigation. Lei Guo: Validation, Software. Weiwei Chen: Validation, Methodology. Shuyi Wang: Methodology. Xiaoxiao Wang: Resources. Fuyue Wang: Resources. Zian Lin: Writing – review & editing, Visualization, Supervision, Conceptualization. Gongke Li: Writing – review & editing, Supervision, Project administration. Zongwei Cai: Supervision, Project administration, Funding acquisition.
This research was supported by the National Natural Science Foundation of China (Nos. 22404023, 22274021, and 22036001). Authors thank to Shenzhen Second People's Hospital for providing the human serums.
Supplementary material associated with this article can be found, in the online version, at doi:
K. Bodenhofer, A. Hierlemann, J. Seemann, et al., Nature 387 (1997) 577–580. doi: 10.1038/42426
G.M.M. Caro, U.J. Meierhenrich, W.A. Schutte, et al., Nature 416 (2002) 403–406. doi: 10.1038/416403a
M. Abdulbagi, L.Y. Wang, O. Siddig, B. Di, et al., Biomolecules 11 (2021) 1716. doi: 10.3390/biom11111716
F. Parmeggiani, S.L. Lovelock, N.J. Weise, et al., Angew. Chem. Int. Ed. 54 (2015) 4608–4611. doi: 10.1002/anie.201410670
S. Nakano, K. Kozuka, Y. Minamino, et al., Commun. Chem. 3 (2020) 181. doi: 10.1038/s42004-020-00432-8
J.L. Bada, B.P. Luyendyk, J.B. Maynard, Science 170 (1970) 730–732. doi: 10.1126/science.170.3959.730
C. Ollivaux, D. Soyez, J.Y. Toullec, J. Pept. Sci. 20 (2014) 595–612. doi: 10.1002/psc.2637
Y.K. Li, C. Liu, X. Bai, et al., Angew. Chem. Int. Ed. 59 (2020) 3486–3490. doi: 10.1002/anie.201913882
Z. Cao, C. Ge, Y. Wu, et al., Chin. Chem. Lett. 37 (2026) 111554. doi: 10.1016/j.cclet.2025.111554
Y.X. Zhang, F.Q. Zhang, A.P. Peng, et al., Chin. Chem. Lett. 37 (2026) 111500. doi: 10.1016/j.cclet.2025.111500
C. Yuan, Z. Wang, W.Q. Xiong, et al., J. Am. Chem. Soc. 145 (2023) 18956–18967. doi: 10.1021/jacs.3c05973
J. Yang, Q.Y. Song, T. Zhang, et al., Anal. Chem. 96 (2024) 17280–17289. doi: 10.1021/acs.analchem.4c03558
X.P. Feng, B.W. Shen, B. Sun, et al., Angew. Chem. Int. Ed. 59 (2020) 11355–11359. doi: 10.1002/anie.202003807
H. Park, C.B. Seo, J. Yun, et al., JACS Au 4 (2024) 3771–3776. doi: 10.1021/jacsau.4c00703
M. Wu, Y.W. Chen, Q. Lu, et al., J. Am. Chem. Soc. 145 (2023) 20646–20654. doi: 10.1021/jacs.3c07839
Q.Y. Cheng, J. Xiong, F. Wang, et al., Chin. Chem. Lett. 29 (2018) 115–118. doi: 10.1016/j.cclet.2017.06.009
X.Y. Zhao, Y. Huang, G. Ma, et al., Anal. Chem. 92 (2020) 991–998. doi: 10.1021/acs.analchem.9b03932
Y.Q. Cao, Y.J. Lu, L. Zhang, et al., Chin. Chem. Lett. 35 (2024) 109788. doi: 10.1016/j.cclet.2024.109788
J. Horak, M. Lämmerhofer, Anal. Chem. 91 (2019) 7679–7689. doi: 10.1021/acs.analchem.9b00666
H. Xiao, P. Liu, S. Zheng, et al., Chin. Chem. Lett. 31 (2020) 2423–2427. doi: 10.1016/j.cclet.2020.03.003
L. Di, S.Y. Cheng, Y. Zhu, et al., J. Chromatogr. A 1688 (2023) 463698. doi: 10.1016/j.chroma.2022.463698
C.Y. Xie, Y.Y. Chen, X.X. Wang, et al., Chem. Sci. 13 (2022) 14114–14123. doi: 10.1039/D2SC03604E
R. Karongo, M. Ge, C. Geibel, et al., Anal. Chim. Acta 1180 (2021) 338858. doi: 10.1016/j.aca.2021.338858
S. Ferré, V. González-Ruiz, J. Zangari, et al., J. Pharm. Biomed. Anal. 209 (2022) 114539. doi: 10.1016/j.jpba.2021.114539
S.J. Jaag, Y. Valadbeigi, T. Causon, et al., Anal. Chem. 96 (2024) 2666–2675. doi: 10.1021/acs.analchem.3c05426
Z. Zhu, S. Xu, Z. Wang, et al., Anal. Chem. 95 (2023) 18504–18513. doi: 10.1021/acs.analchem.3c03847
L. Gao, P. Xu, J.Y. Ren, Food Chem. 410 (2023) 135382. doi: 10.1016/j.foodchem.2022.135382
L. Wang, Z. Jin, X.Y. Wang, et al., Anal. Chem. 89 (2017) 11902–11907. doi: 10.1021/acs.analchem.7b03804
C. Ieritano, J.C.Y. Le Blanc, B.B. Schneider, et al., Angew. Chem. Int. Ed. 61 (2022) e202116794. doi: 10.1002/anie.202116794
S. Kundu, T.K. Egboluche, M.A. Hossain, Acc. Chem. Res. 56 (2023) 1320–1329. doi: 10.1021/acs.accounts.2c00701
E. Obert, M. Bellot, L. Bouteiller, et al., J. Am. Chem. Soc. 129 (2007) 15601–15605. doi: 10.1021/ja074296l
A.S. Borovik, Acc. Chem. Res. 38 (2005) 54–61. doi: 10.1021/ar030160q
H.L. Tan, Q.B. Chen, T.T. Chen, et al., ACS Appl. Mater. Interfaces 11 (2019) 37156–37162. doi: 10.1021/acsami.9b14144
J.Y. Hwang, A. Nish, J. Doig, et al., J. Am. Chem. Soc. 130 (2008) 3543–3553. doi: 10.1021/ja0777640
M.O. Lorenzo, C.J. Baddeley, C. Muryn, et al., Nature 404 (2000) 376–379. doi: 10.1038/35006031
L.C. Liu, Z.Y. Wang, Q. Zhang, et al., Anal. Chem. 95 (2023) 134–151. doi: 10.1021/acs.analchem.2c02866
M. Matoga, I. Forfar, C. Chaimbault, et al., J. Enzyme Inhib. Med. Chem. 17 (2002) 375–379. doi: 10.1080/1475636021000005640
K.H. Kim, T.K. Kim, Y.H. Kwon, et al., Arch. Pharm. Res. 20 (1997) 486–490. doi: 10.1007/BF02973945
T.J. Novak, L. DiMichele, J. Liq. Chromatogr. Relat. Technol. 37 (2014) 2756–2771. doi: 10.1080/10826076.2013.864978
K.H. Kim, H.J. Kim, J.H. Kim, J.H. Lee, S.C. Lee, J. Pharm. Biomed. Anal. 25 (2001) 947–956. doi: 10.1016/S0731-7085(01)00386-7
Q. Wu, J.Y. Wang, D.Q. Han, et al., TrAC-Trends Anal. Chem. 124 (2020) 115801. doi: 10.1016/j.trac.2019.115801
L. Guo, P.S. Xie, X.H. Shen, et al., Adv. Sci. 12 (2025) 2410840. doi: 10.1002/advs.202410840
L. Geng, L.B. McGown, Anal. Chem. 66 (1994) 3243–3246. doi: 10.1021/ac00091a038
Z.Z. Yan, F. Yang, S.R. Wen, et al., Amino Acids 54 (2022) 111–121. doi: 10.1007/s00726-021-03117-1
Y.R. Liu, Z.L. Wu, D.W. Armstrong, et al., Nat. Rev. Chem. 7 (2023) 355–373. doi: 10.1038/s41570-023-00476-z
D. Ouyang, H. Huang, Y. He, et al., Chin. Chem. Lett. 35 (2024) 108885. doi: 10.1016/j.cclet.2023.108885
Y.Y. Chen, Y.Y. Song, Z. Yang, et al., Anal. Chem. 97 (2024) 499–507.

Figure 1 (a) Chemical reaction diagram of chiral MBIC and chiral AAs. (b) Mass spectrum of the compound of MBIC and AAs.

Figure 2 UPLC chromatograms of R-MBIC and S-MBIC labeled (a) chiral Ala and (b) chiral Tyr. (c) The UPLC-MS resolution factors of AA enantiomer pairs labeled with R-MBIC and S-MBIC.

Figure 3 Representative TIMS differentiation of chiral MBIC labeled Asp, Asn, Glu and Gln enantiomers.

 扫一扫看文章

扫一扫关注我们
 DownLoad:
 下载:
下载:
