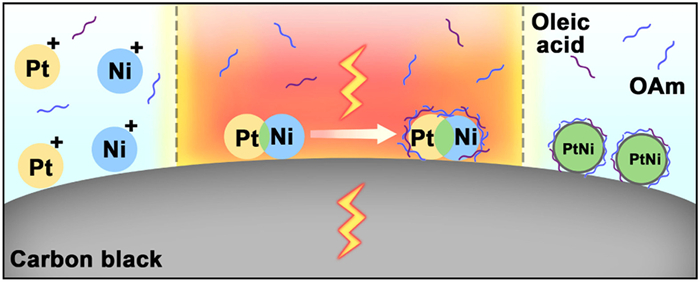
Figure 1.
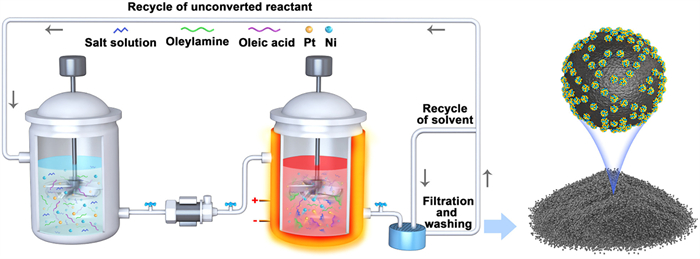
Schematic illustration of the HTLS synthesis process for PtNi/C.
Scalable and rapid liquid synthesis of PtNi electrocatalyst for hydrogen evolution reaction
Liming Li , Yanchang Liu , Peng Kang , Donghui Feng , Yuguang Zhang , Hangxing Ren , Jianrong Zeng , He Zhu , Qiang Li , Xiaoya Cui

Platinum (Pt)-based micro-/nano-catalysts showed exceptional hydrogen evolution reaction (HER) performance due to the precise control over composition, size, morphology, and crystal phase [1–6]. Nevertheless, the manufacturing of Pt-based micro-/nano-catalysts has encountered formidable challenges, such as high surface energy leading to particle agglomeration, structural instability under prolonged electrochemical operation, and susceptibility to surface poisoning, which can degrade catalytic performance over time [7–11]. Conventional synthesis methods, including chemical reduction [12–14] and solvothermal synthesis [15,16], have been extensively investigated for PtNi electrocatalyst preparation. Additionally, conventional synthesis methods often result in suboptimal control over particle size, composition, and lattice strain, limiting the ability to optimize catalytic activity and durability. These factors, combined with complex fabrication processes, low production efficiency, and high material costs, hinder the large-scale application of Pt-based catalysts in electrocatalysis [17,18]. In contrast, the high-temperature shock (HTS) technique, proposed by Chen et al. in 2016 [19,20], holds significant promise for the rational design and effective fabrication of high-quality nanocatalysts, including single metals [21–26], bimetals [27–30], high-entropy alloys (HEAs) [31–33], and metal compounds [34–39] in an ultrafast, scalable, controllable, and environmental friendly manner [40,41]. Impressively, the heating and cooling rates of HTS process can reach 105 K/s, which benefits the synthesis of fine-grained materials rich in lattice strains or defects. Moreover, the short dwelling time, ranging from milliseconds to seconds, effectively prevents particle coarsening and crystal phase transformation at high temperatures. Moreover, surface capping agents stabilize nanoparticles, preventing uncontrolled growth and phase transitions. Additionally, HTS can be readily scaled up for large-scale production of micro-/nano-catalysts, rendering it a pivotal option for industrial applications [42–44]. Consequently, the aforementioned ultrafast synthesis strategy has the potential to overcome the limitations of traditional methods and enable the rational design and scalable synthesis of a wide range of micro-/nano-catalysts, characterized by tunable compositions, structures, and related physiochemical properties.
Based on the development of the HTS technique, we have extended its application to liquid reaction systems, named as high-temperature liquid shock (HTLS) strategy [45,46]. This innovative approach directly applies the Joule heating within a liquid-state reaction system which offers versatility by the modulation of various precursor species, reducing agents, capping agents, and solvent compositions. Notably, besides the thermodynamic control over the reactants, which can also be achieved by solid-state HTS, the introduction of reducing agents, capping agents, and solution plays a pivotal role in the kinetic modification during the synthesizing process of nanocatalysts via HTLS. Such kinetic control during synthesis process can provide oversight over the water phase, oil phase, and pressure, thus offering greater control over gas-liquid interface reactions. It has been demonstrated that, in comparison to HTS, HTLS achieves a narrower particle size distribution, higher uniformity, and enhanced control over the synthesis process, making it an effective alternative choice for manufacturing of nanocatalysts. Furthermore, when compared to conventional liquid-state chemical synthesis, the HTLS method showed the capability to rapidly elevate the temperature of the reaction system to several hundred Kelvin within seconds and maintain this high temperature for extended durations, typically lasting dozens of minutes. Impressively, the kinetic control during HTLS synthesis is more precise and sharper than that achieved through traditional methods due to the higher treating temperature. Additionally, considering the HTLS operates at a higher reaction temperature, it effectively undergoes the annealing and sintering process, which can enhance the stability of nanoparticles with stronger binding forces with carbon support. After high-temperature treatment, the surface of nanoparticles even can be enveloped in a carbon film with atomic scale thickness. In summary, this unique capability assigned the HTLS method several advantages, including the creation of versatile reaction systems, high-temperature conditions, exceptional efficiency, and other benefits conductive to the rapid fabrication of nanomaterials with diverse compositions, morphologies, crystal structures, strains, and defects.
This study presents a creative HTLS approach for the scalable, facile, and rapid synthesis of PtNi electrocatalysts. Our investigation demonstrates that the HTLS method surpasses conventional synthesis techniques in several key aspects, such as superior scalability, rapid reaction kinetics, and precise control over the size and shape of nanocrystals. Notably, the as-synthesized PtNi electrocatalysts via the HTLS method exhibit outstanding catalytic activity and long-term stability in the HER. This remarkable performance can be attributed to the refined particle size and synergistic effect between different elements. We believe this rapid synthesis method established a promising platform for the industrial manufacturing and application of micro-/nano-catalysts.
A creative HTLS method was used to synthesize PtNi nanoparticle (NP) catalysts supported on carbon black (PtNi/C). Drawing insights from previous research on liquid phase and ultrafast synthesis [15,31,47,48], the synthetic mechanism of PtNi/C can be illustrated detailly (Fig. 1). First, Pt and Ni precursors are decomposed into Pt2+ and Ni2+ within a solvent subjected to ultrasonic and stirring treatments. These ions are then electrostatically adsorbed onto the surface of carbon black support, due to the electric charge effects. Subsequently, during the HTLS process conducted in an Ar atmosphere for 60 s, the reducing agent donates electrons to the Pt2+ and Ni2+, facilitating their reduction to atomic states with zero valence. Meanwhile, the elevated temperature caused aggregation, nucleation, and growth of Pt and Ni, ultimately resulting in the formation of PtNi NPs. Unlike conventional oil bath heating, where heat transfer is limited by convection and conduction, Joule heating enables ultrafast temperature rise, reaching 770 K with a rapid heating rate (~103 K/min). The direct energy input enhances reaction kinetics and facilitates uniform nanostructure formation without extended exposure to high temperatures, minimizing coarsening. These conditions enable organic ligands to coat and carbonize on the surface of PtNi NPs (Fig. S1 in Supporting information), preventing agglomeration and segregation, and thus obtain PtNi nanocatalysts with uniform size and shape. Importantly, the rapid cooling rate (~103 K/min) preserves the thin-coated structure [49], as demonstrated in Fig. S2 (Supporting information). Consistent with previous studies [50–54], liquid phase synthesis provides precise control over the morphology, particle size, and structure.
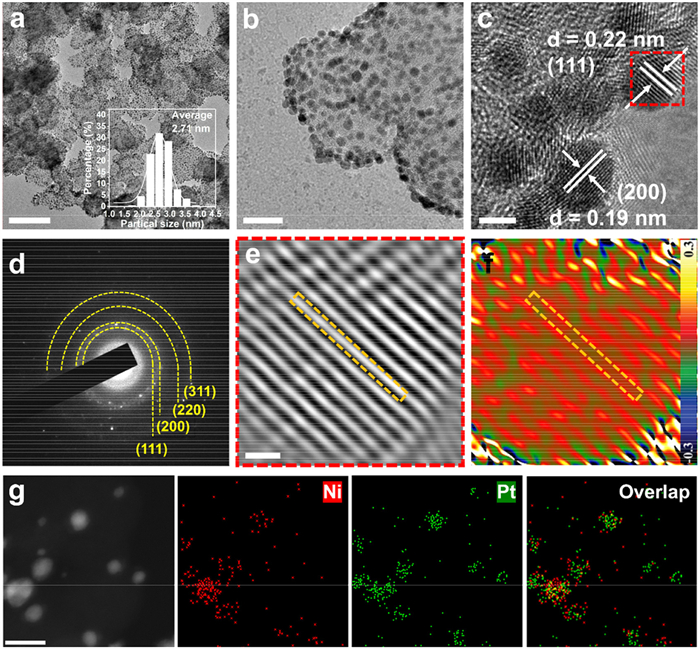
Fig. 2a shows a typical low-magnification transmission electron microscopy (TEM) image of the PtNi/C obtained by applying the HTLS method. It demonstrated that the as-prepared PtNi NPs showed refined grain size with an average diameter of 2.71 nm. Notably, these nanoparticles are densely and uniformly dispersed on a carbon support without obvious agglomeration or coarsening. This exceptional dispersion and ultrafine particle size of PtNi NPs arise from the synergistic effects between the liquid environment, organic ligands, and the rapid synthesis process [12,15,31,47,49,50,55]. The high-resolution transmission electron microscopy (HRTEM) image provides a clear exhibition of the conspicuously dense and homogeneous distribution of PtNi NPs on the carbon black support (Fig. 2b). According to the magnified HRTEM image of PtNi/C, Fig. 2c and Fig. S3 (Supporting information) reveal lattice fringes with interplanar crystal spacings of 0.22 nm and 0.19 nm, corresponding to the (111) and (200) planes within the face-centered cubic (fcc) phase, respectively. Fig. 2d exhibits the results of the selected area electron diffraction (SAED) analysis for PtNi/C, where the present diffraction circles corresponding to PtNi (111), (200), (220), and (311) planes indicate the typical fcc crystal structure. Furthermore, the fcc structure of PtNi is further validated by the results of fast Fourier transform (FFT) analysis in Fig. S4 (Supporting information). Figs. 2e and f are generated after performing masked inverse fast Fourier transform (IFFT) and geometric phase analysis (GPA) from the areas highlighted by red dashed lines in Fig. 2c, respectively. Fig. 2f reveals a periodic and discontinuous distribution of micro-stress within PtNi NPs. By comparing the same area in Figs. 2e and f (framed in yellow), it is indicated that the compression stress appears regularly at the locations where Pt or Ni atoms are present, which is different from the defect engineering [23,27,49] and multielement high-entropic structure [56,57]. This phenomenon might be attributed to the comparable spatial structure (A1, fcc) of Pt and Ni, as well as their high degree of mutual solubility. Strain engineering in PtNi nanoparticles modulates the electronic structure, optimizing hydrogen adsorption and desorption energies. This effect facilitates the Volmer-Heyrovsky mechanism, enhancing HER kinetics and catalytic efficiency. Energy dispersive spectroscopy (EDS) elemental mapping indicates the uniform distribution of Pt and Ni in PtNi NPs (Fig. 2g). The percentages of Pt and Ni were quantified by the inductively coupled plasma mass spectroscopy (ICP-MS), aligns with the results from EDS elemental mapping (Fig. S5 in Supporting information).
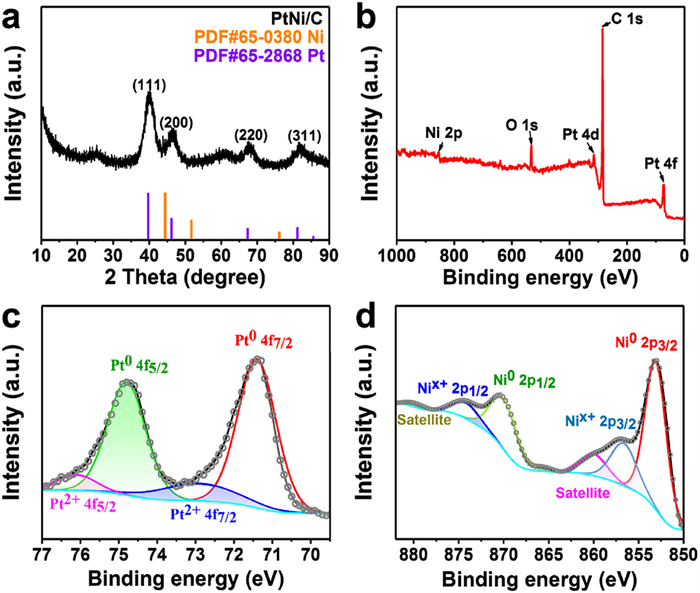
The crystal structure and surface electronic states of the PtNi/C were analyzed by X-ray powder diffraction (XRD) and X-ray photoelectron spectroscopy (XPS) characterizations, respectively (Fig. 3). The peak profile of PtNi/C, as shown in Fig. 3a, is consistent with that of fcc Pt (PDF #65−2868) and Ni (PDF #65−0380). Nevertheless, due to the alloying effect, the lattice spacing of PtNi NPs deviates slightly from that of pure Pt and Ni [16,58,59]. For instance, the lattice spacing of the (111) plane in PtNi NPs is 0.2214 nm (Fig. S3), which lies between that of pure Pt (0.2266 nm) and Ni (0.2041 nm). Consequently, the peak of PtNi (111) plane experiences a positive shift with respect to pure Pt, while displaying an inverse shift relative to pure Ni. Furthermore, the particle size (~3 nm) derived from Scherrer formula corresponds well with that determined via size statistics based on TEM images (Table S1 in Supporting information and Fig. 1a). While alloying effects primarily influence peak positions, the reduced nanoparticle size (~2.71 nm) contributes to peak broadening. This dual contribution is consistent with previous studies on Pt-based nanoalloys. As shown in Fig. 3b, Pt, Ni, C and O are the main compositions of PtNi/C. The presence of O can be attributed to the slight surface oxidation that inevitably occurs during the testing process. The Pt 4f high-resolution spectra exhibit strong peaks located at 71.4 and 74.8 eV, attributed to Pt0, while weak peaks at 72.9 and 76.1 eV are contributed from the oxidized state of Pt (Fig. 3c). In the Ni 2p spectra, the Ni element predominantly exists in a metallic state, evident from the presence of Ni0 peaks at 853.1 and 870.0 eV, due to both the alloying effect and the protective carbon layer. Nevertheless, the peaks at 856.7 and 874.1 eV were attributed to Nix+, with satellite peaks at 860.0 and 879.9 eV, indicating the slightly oxidization of Ni [60–62]. The electronic states of Pt and Ni are of great significance in achieving exceptional catalytic activity and stability.
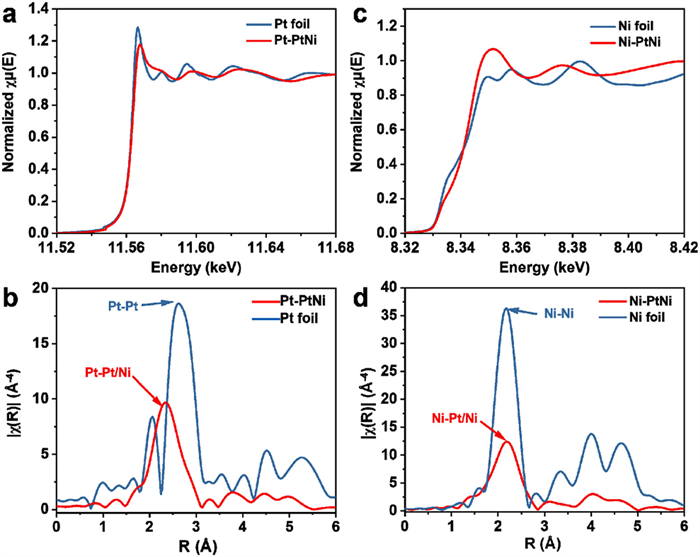
The local atomic and electronic structures of PtNi/C were investigated by the X-ray absorption fine structure (XAFS) analysis, i.e., the X-ray absorption near-edge structure (XANES) and the extended X-ray absorption fine structure (EXAFS), as shown in Fig. 4. Note that the Pt foil and Ni foil were used for reference. The white line peak at about 11.56 keV for PtNi/C showed similar intensity to that of the Pt foil, demonstrating the dominant metallic state of Pt in PtNi/C (Fig. 4a), which was also evidenced by XPS results. The main peak in the Fourier transfer of EXAFS (FT-EXAFS) spectra represents the nearest coordination shells of Pt atoms, which was fitted using Pt-Pt and Pt-Ni paths (Fig. S6 in Supporting information). The radial distance of the main peak in PtNi/C was shorter than that of Pt foil, indicating the shorter bond length within PtNi alloy (Fig. 4b). This also explained the heteroatomic interaction such as alloying effect in bimetallic nanostructures. The XANES spectra of Ni K-edge spectra of PtNi/C and Ni foil were displayed in Fig. 4c. The intensity of the pre-edge peak (at around 8335 eV) for PtNi/C decreases, while the white line (at around 8350 eV) intensity increases compared with the Ni foil. These changes demonstrated the strong hybridization between Pt and Ni and/or the formation of Ni oxides [63]. The results of Ni K-edge FT-EXAFS spectra of PtNi/C confirmed the predominant metallic state of Ni (Fig. 4d), with the main peak located at 2.2 Å. The fitting is conducted using Ni-Ni and Ni-Pt scattering paths (Fig. S7 in Supporting information) [64,65].
The HER performance of PtNi/C was investigated in a 0.5 mol/L H2SO4 aqueous solution at room temperature. All tested potentials were calibrated to the reversible hydrogen electrode (RHE). Fig. 5a exhibits the HER activities of PtNi/C and commercial Pt/C (20 wt%), measured by the linear sweep voltammetry (LSV) curves at 5 mV/s with a 90% iR correction. It obviously indicates that PtNi/C showed superior performance at both low and high current densities, with overpotentials of only 19 and 203 mV at current densities of 10 and 1000 mA/cm2, respectively. In comparison, the corresponding overpotentials of commercial Pt/C were significantly higher, measuring 30 mV and 700 mV (Fig. S8 in Supporting information). As shown in Fig. 5b, the Tafel slopes derived from the LSV curves, revealing that PtNi/C exhibited a remarkably smaller slope of 34.2 mV/dec in comparison to commercial Pt/C with a slope of 110.2 mV/dec. Note that the rate-determining steps of the HER include the Volmer step (H+ + e– + * → H*), Heyrovsky step (H* + H+ + e– → H2 + *), and Tafel step (2H* → H2 + 2*), respectively. Therefore, based on the Bulter−Volmer Equation and the Tafel slope of PtNi/C, the faster kinetics can be attributed to the Volmer-Heyrovsky mechanism [35,36,66]. Electrochemical impedance spectroscopy (EIS) results reveal that PtNi/C exhibited a smaller charge transfer resistance (Rct) of 1.6 Ω compared to commercial Pt/C (10.1 Ω), indicating a faster electron transfer rate and improved conductivity of PtNi/C, thus enhancing the HER activity (Fig. 5c). Furthermore, mass activity (MA), electrochemical active surface area (ECSA) and turnover frequency (TOF) were measured to evaluate the intrinsic activity of PtNi/C. As shown in Fig. 5d, PtNi/C outperformed commercial Pt/C with an MA of 2.44 A/mgPt at −0.07 V, in contrast to the value of commercial Pt/C at 0.46 A/mgPt. In addition, double-layer capacitances (Cdl) were tested at different scan rates to determine the ECSA of PtNi/C using the equation: ECSA = Cdl/Cs (Fig. S9 in Supporting information). The specific capacitance (Cs) remained constant in the identical solution. Therefore, Fig. 5d shows that the ECSA of PtNi/C was significantly superior, reaching up to 6.12 times that of commercial Pt/C. Furthermore, PtNi/C exhibited an exceptional TOF of 12.29 s−1 per active site at −0.07 V, surpassing that of Pt/C (2.33 s−1) and providing further evidence of the superior intrinsic activity of PtNi/C (Fig. S10 in Supporting information).

In addition to electrocatalytic activity, catalytic stability is a crucial criterion for evaluating catalysts. The long-term stability of PtNi/C was investigated using constant current chronopotentiometry (CP) and accelerated durability test (ADT). As illustrated in Fig. 5e, the PtNi/C catalysts demonstrated remarkable stability, operating consistently for over 100 h at continuous current densities of 10, 50, and 100 mA/cm2 without any significant performance degradation, as evidenced by CP measurements. Notably, there were no observable changes in morphology after the stability test (Figs. S11 and S12 in Supporting information). Furthermore, the PtNi/C catalyst exhibited negligible performance decline even after 1000 cycles of continuous hydrogen evolution, indicating excellent long-term stability without significant corrosion, as compared to the reported Pt-based catalysts in acidic media (Fig. S13 and Table S2 in Supporting information). By comparing the overpotential of the PtNi/C catalyst to state-of-the-art PtNi catalysts at 10 mA/cm2 in 0.5 mol/L H2SO4 solution, it is evident that the catalytic activity of the PtNi/C catalyst prepared by the HTLS method ranks among the highest (Fig. 5f and Table S3 in Supporting information). Surprisingly, in addition to the excellent activity at low current density, our PtNi/C catalyst demonstrated comparable performance to other advanced HER catalysts at high current densities, rendering it a promising candidate for industrial hydrogen production through electrolysis (Table S4 in Supporting information). Importantly, the HTLS manufacturing approach for excellent micro-/nano-catalysts is noteworthy for its efficiency, cost-effectiveness, and rapid production. Theoretically, it shows the capacity to produce > 1400 batches of samples per day, greatly expanding its potential for industrial application (Fig. 5g and Table S5 in Supporting information).
It is worth noting that our HTLS method involves the directly heating of the liquid phase, aligning it with traditional chemical processing methods. Therefore, this approach holds considerable potential for highly efficient industrial catalytic preparation. Fig. 6 illustrates the industrialized process for manufacturing high-efficiency catalysts using the HTLS method. Initially, the precursor solution is mixed in a reactor with motor stirring, followed by transferring to another reactor equipped with an electricity-triggered Joule heating jacket for the rapid reduction of the precursor. Finally, the catalysts are filtered and cleaned to enable the recycling and reuse of solvents and unconverted reactants. Industrial-scale implementation of HTLS can maintain uniform heating and rapid temperature fluctuations through optimized reactor designs incorporating high-efficiency Joule heating elements and precise temperature control systems. Additionally, continuous flow processing ensures consistent thermal conditions across large batches, preventing localized overheating or temperature inconsistencies. This method offers a creative, continuous, and efficient pathway for the industrial-scale fabrication of catalysts.
In summary, we introduced a facile, rapid, and scalable liquid-phase synthesis method, referred to as HTLS, for the manufacturing of PtNi alloy nanocatalysts. This innovative approach utilizes Joule heating within the liquid reaction solution. Impressively, the HTLS method achieves remarkable heating and cooling rates of ~103 K/min, while maintaining a high temperature of ~770 K. HTLS proves to be highly adaptable, allowing for the customization of various reaction systems by modifying the species of precursors, reducing and capping agents, and solutions. Notably, the as-synthesized PtNi nanocatalysts with a refined size of 2.71 nm and lattice strains were demonstrated to exhibit superior electrocatalytic activity and stability for the HER in 0.5 mol/L H2SO4 solution. The HTLS method offers a scalable and efficient approach for industrial catalyst manufacturing, demonstrating significant potential for practical applications.
The authors declare that they have no known competing financial interests or personal relationships that could have appeared to influence the work reported in this paper.
Liming Li: Data curation, Writing – original draft, Methodology. Yanchang Liu: Supervision, Methodology, Data curation. Peng Kang: Investigation, Supervision. Donghui Feng: Formal analysis, Methodology. Yuguang Zhang: Methodology. Hangxing Ren: Funding acquisition, Writing – original draft, Supervision. Jianrong Zeng: Supervision, Writing – review & editing, Software. He Zhu: Software, Formal analysis, Resources. Qiang Li: Software, Resources, Formal analysis. Xiaoya Cui: Project administration, Methodology, Writing – original draft, Conceptualization, Writing – review & editing, Supervision.
The authors thank the staff of beamline BL13SSW at Shanghai Synchrotron Radiation Facility for experiments supports. This study was financially supported by the National Natural Science Foundation of China (No. 12205165) and Hebei Province Innovation Ability Improvement Plan Project (No. 225676111H).
Supplementary material associated with this article can be found, in the online version, at doi:
Q. Li, H. Zhu, X. Chen, et al., J. Am. Chem. Soc. 144 (2022) 20298–20305. doi: 10.1021/jacs.2c07844
Z. Chen, X. Li, J. Zhao, et al., Angew. Chem. Int. Ed. 62 (2023) 202308686. doi: 10.1002/anie.202308686
J.N. Hansen, H. Prats, K.K. Toudahl, et al., ACS Energy Lett. 6 (2021) 1175–1180. doi: 10.1021/acsenergylett.1c00246
F. Dong, H. Duan, Z. Lin, et al., Appl. Catal. B: Environ. 340 (2024) 123242. doi: 10.1016/j.apcatb.2023.123242
Y. Yang, Y. Yu, J. Li, et al., Nano-Micro Lett. 13 (2021) 160. doi: 10.3390/cells10010160
C. Wang, Q. Zhang, B. Yan, et al., Nano-Micro Lett. 15 (2023) 52. doi: 10.1007/s40820-023-01024-6
X. Wang, Y. Jiang, K. Mao, et al., J. Am. Chem. Soc. 144 (2022) 22759–22766. doi: 10.1021/jacs.2c11109
J. Zhu, L. Hu, P. Zhao, et al., Chem. Rev. 120 (2020) 851–918. doi: 10.1021/acs.chemrev.9b00248
J. Liu, J. Ma, Z. Zhang, et al., J. Phys. Mater. 4 (2021) 022004. doi: 10.1088/2515-7639/abd596
X. Wang, X. Jiao, Y. Wang, et al., J. Mater. Chem. A 12 (2024) 17002–17020. doi: 10.1039/d4ta02281e
X.L. Liu, Y.C. Jiang, J.T. Huang, et al., Carbon Energy 5 (2023) 367. doi: 10.1002/cey2.367
Y. Jin, Z. Zhang, H. Yang, et al., SmartMat 3 (2022) 130–141. doi: 10.1002/smm2.1083
Y. Jiang, X. Wu, Y. Yan, et al., Small 15 (2019) 1805474. doi: 10.1002/smll.201805474
Y. Zheng, A.S. Petersen, H. Wan, et al., Adv. Energy Mater. 13 (2023) 2204257. doi: 10.1002/aenm.202204257
Z. Cao, Q. Chen, J. Zhang, et al., Nat. Commun. 8 (2017) 15131. doi: 10.1038/ncomms15131
Q. Chen, B. Wei, Y. Wei, et al., Appl. Catal. B: Environ. 301 (2022) 120754. doi: 10.1016/j.apcatb.2021.120754
X. Wang, Y. Ge, M. Sun, et al., J. Am. Chem. Soc. 146 (2024) 24141–24149. doi: 10.1021/jacs.4c08905
Y. Ge, X. Wang, B. Chen, et al., Adv. Mater. 34 (2022) 2107399. doi: 10.1002/adma.202107399
Y. Chen, G.C. Egan, J. Wan, et al., Nat. Commun. 7 (2016) 12332. doi: 10.1038/ncomms12332
Y. Chen, High Temperature Shock Technology, 1st ed., Springer, Singapore, 2023.
Y. Yao, Z. Huang, P. Xie, et al., Nat. Nanotechnol. 14 (2019) 851–857. doi: 10.1038/s41565-019-0518-7
C. Liu, Y. Shen, J. Zhang, et al., Adv. Energy Mater. 12 (2022) 2103505.
S. Liu, Y. Shen, Y. Zhang, et al., Adv. Mater. 34 (2022) 2106973. doi: 10.1002/adma.202106973
Y. Yao, F. Chen, A. Nie, et al., ACS Cent. Sci. 3 (2017) 294–301. doi: 10.1021/acscentsci.6b00374
B. Cui, H. Zhu, M. Wang, et al., ACS Mater. Lett. 6 (2024) 1532–1541. doi: 10.1021/acsmaterialslett.4c00124
X. Hou, X. Yu, M. Liu, et al., Chin. Chem. Lett. 36 (2025) 109845. doi: 10.1016/j.cclet.2024.109845
S. Liu, Z. Hu, Y. Wu, et al., Adv. Mater. 32 (2020) 2006034. doi: 10.1002/adma.202006034
Y. Qiu, Z. Hu, H. Li, et al., Chem. Eng. J. 430 (2022) 132769. doi: 10.1016/j.cej.2021.132769
F. Chen, Y. Yao, A. Nie, et al., Adv. Energy Mater. 8 (2018) 1800466. doi: 10.1002/aenm.201800466
X. Cui, Y. Liu, Q. Li, et al., Chin. Chem. Lett. 36 (2025) 110069. doi: 10.1016/j.cclet.2024.110069
Y. Yao, Z. Huang, P. Xie, et al., Science 359 (2018) 1489–1494. doi: 10.1126/science.aan5412
Y. Yao, Z. Huang, L.A. Hughes, et al., Matter 4 (2021) 2340–2353. doi: 10.1016/j.matt.2021.04.014
Y. Yao, Z. Liu, P. Xie, et al., Sci. Adv. 6 (2022) eaaz0510. doi: 10.1126/sciadv.aaz0510
C. Liu, W. Zhou, J. Zhang, et al., Adv. Energy Mater. 10 (2020) 2001397. doi: 10.1002/aenm.202001397
C. Li, Z. Wang, M. Liu, et al., Nat. Commun. 13 (2022) 3338. doi: 10.1038/s41467-022-31077-x
Y. Chen, S. Xu, S. Zhu, et al., Nano Res. 12 (2019) 2259–2267. doi: 10.1007/s12274-019-2304-0
M. Liu, G. Lv, H. Liu, et al., Chin. Chem. Lett. 35 (2024) 108459. doi: 10.1016/j.cclet.2023.108459
R. Yin, Z. Guo, R. Liu, et al., Chin. Chem. Lett. 36 (2025) 109643. doi: 10.1016/j.cclet.2024.109643
W. Yang, L. Shang, X. Liu, et al., Chin. Chem. Lett. 35 (2024) 109501. doi: 10.1016/j.cclet.2024.109501
S. Dou, J. Xu, X. Cui, et al., Adv. Energy Mater. 10 (2020) 2001331. doi: 10.1002/aenm.202001331
Z. Liu, Y. Chen, Nat. Sustain. 7 (2024) 381–382. doi: 10.1038/s41893-024-01301-1
R. Jiang, Y. Da, X. Han, et al., Cell Rep. Phys. Sci. 2 (2021) 100302. doi: 10.1016/j.xcrp.2020.100302
Y. Liu, X. Tian, Y.C. Han, et al., Chin. J. Catal. 48 (2023) 66–89. doi: 10.1016/S1872-2067(23)64428-6
X. Cui, Y. Liu, Y. Chen, Natl. Sci. Rev. 11 (2024) nwae033.
X. Cui, Y. Liu, X. Wang, et al., ACS Nano 18 (2024) 2948–2957. doi: 10.1021/acsnano.3c07703
L. Li, P. Kang, D. Feng, et al., Prog. Nat. Sci.: Mater. Int. 34 (2024) 985–989. doi: 10.1016/j.pnsc.2024.07.012
C. Zhang, C. Xue, RSC Adv. 13 (2023) 1229–1235. doi: 10.1039/d2ra06325e
H. Liu, J. Yu, J. Lin, et al., EES Catal. 1 (2023) 720–729. doi: 10.1039/d3ey00113j
J. Luo, J. Zhang, Z. Guo, et al., Nano Res. 16 (2023) 4240–4245. doi: 10.1007/s12274-022-5244-z
G. Feng, F. Ning, J. Song, et al., J. Am. Chem. Soc. 143 (2021) 17117–17127. doi: 10.1021/jacs.1c07643
H. Minamihara, K. Kusada, D. Wu, et al., J. Am. Chem. Soc. 144 (2022) 11525–11529. doi: 10.1021/jacs.2c02755
H. Li, Y. Han, H. Zhao, et al., Nat. Commun. 11 (2020) 5437. doi: 10.1038/s41467-020-19277-9
Z. Zhang, G. Liu, X. Cui, et al., Sci. Adv. 7 (2021) eabd6647. doi: 10.1126/sciadv.abd6647
F. Saleem, Z. Zhang, X. Cui, et al., J. Am. Chem. Soc. 141 (2019) 14496–14500. doi: 10.1021/jacs.9b05197
P. Wang, X. Zhang, J. Zhang, et al., Nat. Commun. 8 (2017) 14580. doi: 10.1038/ncomms14580
H. Wu, Q. Lu, Y. Li, et al., Nano Lett. 22 (2022) 6492–6500. doi: 10.1021/acs.nanolett.2c01147
H. Wu, Q. Lu, Y. Li, et al., J. Am. Chem. Soc. 145 (2023) 1924–1935. doi: 10.1021/jacs.2c12295
D. Zhang, C. Chen, X. Wang, et al., Part. Part. Syst. Charact. 35 (2018) 1700413. doi: 10.1002/ppsc.201700413
J.E. Lim, U.J. Lee, S.H. Ahn, et al., Appl. Catal. B: Environ. 165 (2015) 495–502. doi: 10.1016/j.apcatb.2014.10.042
H. Jin, Z. Xu, Z.Y. Hu, et al., Nat. Commun. 14 (2023) 1518. doi: 10.1038/s41467-023-37268-4
Q. Feng, X. Wang, M. Klingenhof, et al., Angew. Chem. Int. Ed. 61 (2022) 202203728. doi: 10.1002/anie.202203728
Z. Zhao, H. Liu, W. Gao, et al., J. Am. Chem. Soc. 140 (2018) 9046–9050. doi: 10.1021/jacs.8b04770
B.N. Wanjala, R. Loukrakpam, J. Luo, et al., J. Phys. Chem. C 114 (2010) 17580–17590. doi: 10.1021/jp106843k
Z. Zhang, G. Liu, X. Cui, et al. Adv. Mater. 30 (2018) 1801741. doi: 10.1002/adma.201801741
X. Cui, Z. Zhang, Y. Gong, et al., CCS Chem. 2 (2020) 24–30.
S. Xu, Y. Chen, Y. Li, et al., Nano Lett. 17 (2017) 5817–5822. doi: 10.1021/acs.nanolett.7b03019

Figure 2 Electron microscopic characterization and analysis for PtNi/C prepared by HTLS. (a) TEM image of PtNi/C; inset: particle size distribution of PtNi NPs. (b) HRTEM and (c) magnified HRTEM images of PtNi/C. (d) SAED pattern of PtNi/C. (e) IFFT of the red square area in (c), and (f) corresponding strain distribution along the Exy. The conversion from dark blue to bright yellow represents the transition from compressive to tensile strains. (g) EDS elemental mappings of PtNi NPs. Scale bar: (a) 100 nm, (b) 20 nm, (c) 2 nm, (e) 0.5 nm, (g) 10 nm.

Figure 3 Structural and electronic state characterization of PtNi/C. (a) XRD pattern of PtNi/C. The particle size calculated from the Scherrer equation based on XRD patterns is consistent with that of the size distribution statistics based on TEM images. XPS spectra of (b) survey scan, (c) Pt 4f, and (d) Ni 2p for PtNi/C.

Figure 4 XAFS analysis of PtNi/C, Pt foil, and Ni foil. (a) The XANES and (b) the FT-EXAFS spectra for Pt L3-edge. (c) The XANES and (d) the FT-EXAFS spectra for Ni K-edge.

Figure 5 HER performance of PtNi/C in 0.5 mol/L H2SO4 aqueous solution. (a) LSV polarization curves with iR correction at a scan rate of 5 mV/s and (b) corresponding Tafel plots. (c) Nyquist plots tested at a potential of −0.02 V. (d) Histograms of mass activity normalized by the amount of Pt and specific activity at −0.07 V. (e) Chronopotentiometry of PtNi/C electrocatalyst at multi-step current densities of 10, 50 and 100 mA/cm2 for 100 h in total. (f) Comparison of the potentials at 10 mA/cm2 of PtNi/C with other first-class PtNi HER catalysts. (g) Comparison of performance and productivity of various PtNi catalysts. NF: nickel foam, NW: nanowire, ND: nanodendrite, CN: carbon nanosheet, SA: single-atom.

 扫一扫看文章

扫一扫关注我们
 DownLoad:

 下载:
下载:
