Figure 1.
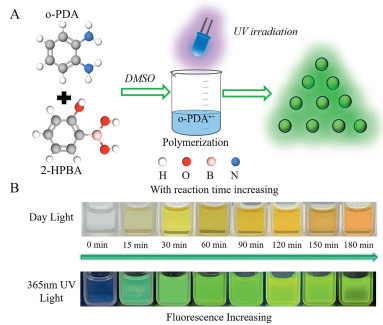
(A) Schematic diagram of B-GQDs synthesis. (B) Color change of the reaction solution under daylight and FL variation at different reaction times.

Quantum dots (QDs), as a novel class of zero-dimensional (0 D) nanomaterials, have demonstrated significant application potential across various fields owing to unique quantum confinement effects, tunable luminescence properties and exceptional optoelectronic characteristics [1-4]. Based on material composition and properties, QDs can be categorized into several types, including Ⅱ-Ⅵ semiconductor QDs [5], Ⅲ-Ⅴ semiconductor QDs [6], oxides QDs [7], carbon-based QDs [8] and perovskite QDs [9]. Among these, graphene quantum dots (GQDs) and its derivatives have emerged as a promising sensing material due to high fluorescence (FL) stability, facile synthesis and excellent biocompatibility [10-13]. However, GQDs composed solely of carbon and oxygen exhibit inherent limitations, such as relatively low FL quantum yields (QY), susceptibility to photobleaching and strong environmental dependencies, which hinder further development in practical applications [14,15].
Heteroatom doping is widely recognized as an effective strategy for modulating the properties of GQDs [16]. The introduction of heteroatoms into GQDs enables precise control over the electronic distribution, thereby optimizing the optical properties and electronic characteristics [17-19]. As an element adjacent to carbon in the periodic table, boron (B) possesses a similar atomic radius and comparable physicochemical properties, making B-doping a promising approach to address these limitations [20]. This strategy offers significant potential for enhancing FL QY, improving photostability, increasing environmental robustness, modifying electronic structures and optimizing surface chemistry. Despite these advantages, current synthesis methods for boron-doped graphene quantum dots (B-GQDs) often suffer from low efficiency and procedural complexity [21-24]. For instance, while the conventional hydrothermal method is operationally simple, its requirement for high temperature and pressure limits its scalability for mass production. Other methods, such as hydrothermal cutting and microwave-assisted synthesis, also present significant challenges. Therefore, the development of simplified and efficient methods for preparation of B-GQDs with high FL QY still holds great significance.
Water content measurement is of paramount importance in organic synthesis and chemical experiments, as it ensures the efficient progression of reactions, the high purity of products and the safety of experiments [25,26]. Existing water content methods present specific limitations that restrict their universal application [27]. The Karl Fischer (KF) titration and gas chromatography (GC), while precise, demand stringent operational conditions and specialized expertise. Similarly, thermogravimetric methods and infrared (IR) are susceptible to environmental humidity fluctuations, potentially compromising the measurement accuracy and reproducibility [28,29].
In this study, a light-driven synthesis method for preparing B-GQDs with strong green FL properties, specifically designed for water content measurement in organic solvents was developed. Compared to conventionally synthesized B-GQDs, the light-driven approach yielded materials with significantly enhanced FL.
B-GQDs were synthesized using o-phenylenediamine (o-PDA) and 2-hydroxyphenylboronic acid (2-HPBA) as precursors, with DMSO serving as an auxiliary solvent. The specific synthetic procedure is illustrated in Fig. 1A. o-PDA and 2-HPBA were uniformly dispersed in DMSO and B-GQDs with green FL were obtained under 365 nm UV irradiation. Initially, the solution appeared colorless and transparent. As the reaction proceeded, bright green FL gradually emerged under UV light, while under daylight, the solution displayed a distinct yellow color (Fig. 1B). In all characterization experiments, the B-GQDs were synthesized using a precursor molar ratio of 2:1.
Mass spectrum (MS) analysis (Fig. 2A) revealed distinct peaks corresponding to various mass-to-charge ratios (m/z), indicating the formation of different polymer species. Specifically, the peak at 139.06 was identified as corresponding to the protonated form of 2-HPBA. The peaks observed at 211.09 and 313.12 were attributed to o-PDA oligomers. Furthermore, peaks at 416.94, 517.18 and 824.28 were assigned to the protonated forms of o-PDA trimer, tetramer and higher oligomers [30], respectively. Further structural characterization was performed through MS/MS analysis of the peak at m/z 1199.44 (Fig. 2B). The fragmentation pattern revealed characteristic peaks at 211.09, 238.14 and 313.12, providing compelling evidence that the high-molecular-weight polymer is composed of lower-molecular-weight units of o-PDA and 2-HPBA. This fragmentation pattern suggested that the polymeric structure is built through the progressive assembly of these fundamental building blocks.
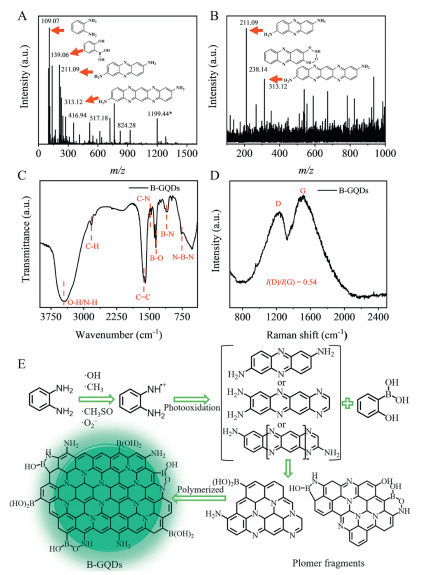
Fig. 2C presented the FT-IR spectra of B-GQDs. The FT-IR broad characteristic peak at 3450 cm−1 can be primarily attributed to the stretching vibrations of N—H and O—H groups. The peak observed at 2850 cm−1 corresponded to the in-plane bending vibrations of C—H bonds. Furthermore, the distinct peak at 1580 cm−1 was characteristic of C═C double bond stretching vibrations. The weak absorption band observed at 1420 cm−1 originates from the stretching vibrations of C—N single bonds within the six-membered ring framework. The characteristic peak at 1250 cm⁻1 was assigned to B—O stretching vibrations. Notably, the presence of peaks at 1120 cm−1 and 780 cm−1 provided substantial evidence for the condensation reaction between o-PDA polymer and 2-HPBA. These peaks were specifically indicative of B—N and N—B—O functional group formations, respectively, confirming the successful chemical conjugation between the constituent molecules [31,32]. The Raman spectrum (Fig. 2D) exhibited two characteristic peaks: the D-band at 1280 cm⁻1, indicative of disordered carbon structures and the G-band at 1620 cm⁻1, corresponding to the sp2-bonded carbon atoms in the graphitic lattice. The intensity ratio of these bands (ID/IG) served as a quantitative measure of the defect density within the graphitic framework. For B-GQDs, the calculated ID/IG of 0.54 suggested the presence of a predominantly ordered graphitic structure with a moderate concentration of structural defects.
The detailed synthesis mechanism of B-GQDs was illustrated in Fig. 2E. This process was initiated by the generation of abundant reactive radicals from DMSO under UV irradiation [33]. The reactive radicals were captured by o-PDA, resulting in its oxidation into the corresponding radical cation species, o-PDA•+. Subsequently, o-PDA•+ underwent termination reactions to form quinoid-structured dimers. The dimeric structures further propagated through polymerization, leading to the formation of o-PDA oligomers. During this process, the hydroxyl groups of 2-HPBA underwent condensation reactions with the amino groups on the growing polymer chains [34,35]. This synergistic process of polymerization and condensation ultimately yields the B-GQDs structure.
The optical properties of B-GQDs were systematically investigated using UV–vis absorption and FL spectroscopy. Fig. S1 (Supporting information) presented the UV–vis absorption spectrum of B-GQDs, revealing two characteristic absorption peaks. The intense absorption peak at 290 nm corresponded to the π-π* transition of the aromatic sp2 carbon network. The absorption band observed around 400 nm can be attributed to charge transfer transitions, resulting from electron donation from the π-conjugated domains to electron-deficient boron sites or surface functional groups (-OH, -NH2) [36]. These spectral features collectively demonstrate the existence of abundant functional groups on the surface of B-GQDs.
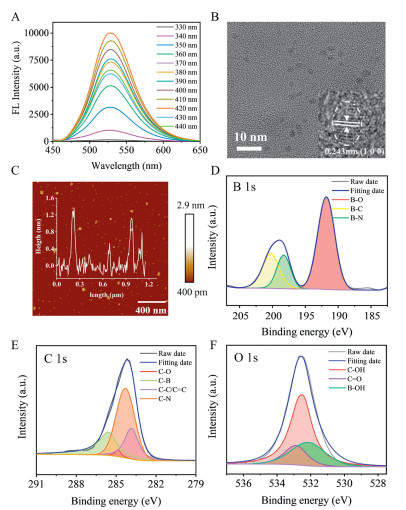
The emission spectra of B-GQDs under various excitation wavelengths were displayed (Fig. 3A). As the excitation wavelength was incrementally increased from 330 nm to 440 nm, the FL emission peak remained consistently centered at 530 nm, demonstrating excitation wavelength-independent emission characteristics. The maximum FL intensity was observed at an excitation wavelength of 420 nm. This unique excitation-independent behavior can be attributed to two primary factors. Firstly, the narrow size distribution of B-GQDs, as confirmed by TEM analysis. Secondly, the presence of uniform chromophores with minimal surface defects, which was consistent with previous reports on CDs and GQDs [37]. The B doping ratio has a significant influence on the FL QY of B-GQDs. Among the tests, the B-GQDs with 1:1 molar ratio yielded the highest FL QY (Fig. S2 in Supporting information). Comparing the other preparation methods (Table 1), the B-GQDs prepared in this study had significant advantages in preparation methods and FL QY. Apparently, the conventional hydrothermal cutting method produced GQDs with a FL QY of 8.9%, whereas the light-driven synthesis scheme produces B-GQDs with a FL QY of 71.2%, which is a 3.4-fold improvement compared to the microwave cutting method (FL QY = 21.1%) [38]. This exceptional high FL QY could be explained by the synergistic effects of boron and nitrogen elements on the QDs surface as well as the electron-donating properties of boron atoms within the conjugated carbon framework.
 DownLoad:
CSV
DownLoad:
CSV
Respectively, the TEM (Fig. 3B) analysis revealed that the synthesized B-GQDs were monodisperse, spherical nanoparticles with well-defined lattice fringes exhibiting a characteristic spacing of 0.24 nm, corresponding to the (100) crystal plane. Statistical analysis of the particle size distribution indicated that the nanoparticle diameters range from 0.75 nm to 3.75 nm, with a predominant population centered around 2.75 nm (Fig. S3 in Supporting information). The observed lattice fringes further support the successful synthesis of B-GQDs. Complementary atomic force microscopy (AFM) measurements (Fig. 3C and Fig. S4 in Supporting information) provided additional structural information, showing that the B-GQDs have a height distribution ranging from 0.3 nm to 1.4 nm. Based on the theoretical thickness of single-layer graphene (0.34 nm), these height measurements suggested that the B-GQDs consist of 1 to 4 graphene-like layers, confirming the ultra-thin, quasi-two-dimensional structure. GPC analysis showed that the number average molecular weight (Mn) and weight average molecular weight (Mw) of the synthesized B-GQDs were 577 Da and 792 Da, respectively (Fig. S5 and Table S1 in Supporting information).
The survey spectrum revealed four characteristic peaks at 192, 284, 399 and 532 eV, corresponding to the B 1s, C 1s, N 1s and O 1s orbitals, respectively (Fig. S6 in Supporting information). These peaks confirmed the presence of four primary elements in B-GQDs, with atomic percentages of 6.37% (B), 60.09% (C), 12.52% (N) and 21.02% (O). The high-resolution B 1s spectrum (Fig. 3D) demonstrates three distinct peaks, representing B—O, B—C and B—N bonds, indicating the existence of B—OH groups on the B-GQDs surface. The C 1s spectrum can be deconvoluted into four peaks, confirming the formation of a carbon skeleton (Fig. 3E). The N 1s spectrum revealed three characteristic peaks corresponding to N of graphitic, N of pyridinic and -NH₂ groups, suggesting successful incorporation of nitrogen atoms into the hexagonal carbon framework (Fig. S7 in Supporting information). Similarly, the O 1s spectrum exhibited three peaks attributed to C—OH, C═O and B-O bonds, respectively (Fig. 3F).
Under excitation at 420 nm, a strong FL emission peak was observed around 530 nm, which is consistent with the color observed under UV light (Fig. S8 in Supporting information). To achieve optimal FL performance of the material, the synthesis process of B-GQDs was systematically optimized. Three key parameters were investigated: the stoichiometric ratio of reactants, the intensity of the light source and the reaction duration. This comprehensive optimization aimed to maximize the FL stability of the resulting B-GQDs. The detailed description is provided in the supporting information and subsequent tests were conducted under the optimized conditions (Figs. S9–S11 in Supporting information).
At the same time, the stability of the prepared B-GQDs and the pH of the storage solution were tested. As shown in Fig. S12A (Supporting information), it can be observed that the test effect of B-GQDs prepared by light driving did not decrease obviously after 30 days of storage, which proved that it had good stability. In addition, in the pH range of 5–11, B-GQDs showed excellent test performance (Fig. S12B in Supporting information). GQDs exhibited weak FL intensity and no significant FL quenching was observed during water content tests in methanol (Fig. S13 in Supporting information). In contrast, B-GQDs demonstrated significantly stronger FL intensity and exhibited a pronounced response to water content.
Particularly, the B-GQDs were uniformly dispersed in different solvents, with the FL emission peaks spanning the range of 500–550 nm (Fig. S14 in Supporting information). In organic solvents, the FL intensity of B-GQDs exhibited approximately 15% variation, while in aqueous solution, the FL intensity of B-GQDs was almost quenched (Fig. S14 in Supporting information). By comparing the solvent polarity, it was inferred that solvents with higher polarity tend to exhibit a red shift in the FL emission. Water, being the most polar solvent, showed its FL emission peak at 550 nm, with the FL intensity almost completely quenched.
It is hypothesized that B-GQDs, as a modified form of GQDs, possess abundant surface functional groups such as -B(OH)2, -OH and -NH2. The polarity and hydrogen-bonding ability of water can induce the formation of a dense hydrogen-bonding network at the surface of B-GQDs. This interaction leaded to a pronounced red-shift in the FL emission peak in aqueous solution, while simultaneously enhancing non-radiative decay pathways, resulting in reduced FL intensity (Fig. 4A) [44].
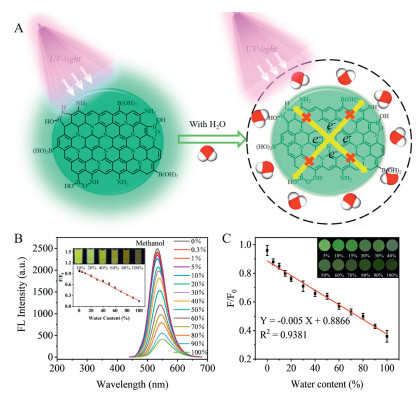
The B-GQDs solution was mixed with organic solvent-water mixtures at various volume ratios (v/v) and the FL emission spectra were recorded. Taking methanol as an example, Fig. 4B showed the FL emission intensity of B-GQDs in methanol solutions with varying water content (0–100%). A significant decrease in FL intensity was observed when the water content reached 0.3%, compared to the pure methanol solution, accompanied by a redshift in the emission peak. As the water content increased, the FL intensity decreased systematically and the emission peak continued to redshift. The color transitioned from yellow-green to dark olive. Linear fitting of the data yielded the equation Y = -0.0085X + 1.0046, with a linear correlation coefficient (R2) of 0.9931. This demonstrates that B-GQDs exhibit a good linear response for detecting water content in methanol solutions ranging from 0.3% to 100%, with a detection limit of 0.28%. Following the same procedure, solutions of DMSO (Fig. S15 in Supporting information), acetone (Fig. S16 in Supporting information), acetonitrile (Fig. S17 in Supporting information) and THF (Fig. S18 in Supporting information) with varying water content were tested. The results, exhibited a similar linear trend, with the fitting work curves and detection limits provided in Table 2.
DownLoad:
CSV
| Solvent | Linear curve | LOD (%) | R2 |
| Acetone | Y = -0.0185X + 1.0106 | 0.44 | 0.9901 |
| THF | Y = -0.0077X + 0.9781 | 0.28 | 0.9926 |
| DMSO | Y = -0.0096X + 0.9232 | 0.17 | 0.9903 |
| Methanol | Y = -0.0085X + 1.0046 | 0.28 | 0.9931 |
| Acetonitrile | Y = -0.0084X + 0.9051 | 0.16 | 0.9924 |
To expand the application of B-GQDs for water content in organic solvents and simplify the detection process for semi-quantitative analysis, a paper-based sensor by immobilizing B-GQDs on filter paper was developed. As illustrated in Fig. 4C, a distinct correlation was observed between the water content and FL intensity, where increasing moisture levels resulted in progressive FL quenching under 365 nm UV light. The calibration curve of F/F₀ versus water content exhibited excellent linearity, following the equation Y = 0.005X + 0.8866 with a correlation coefficient (R2) of 0.984. Visual inspection revealed three distinct FL color regions corresponding to different moisture levels: bright green FL for 0–10% water content, dark green for 20%−50% and brownish-green for 50%−100%. This color gradation provides a convenient visual indicator for semi-quantitative moisture assessment. In addition, to evaluate the practical applicability of the method, we conducted supplementary experiments using industrial-grade methanol (95%). The sensor exhibited reliable performance and satisfactory detection results (RSD = 2.4%), confirming its effectiveness in complex organic solvent systems (Table S2 in Supporting information).
In summary, this study developed an efficient and straightforward synthesis strategy for B-GQDs using UV irradiation as the driving force, enabling the preparation under mild conditions. The resulting B-GQDs exhibited bright FL in various organic solvents and demonstrated a sensitive and specific FL quenching response to trace water content, both in intensity and visual color. Importantly, the method was further validated in real samples, including industrial-grade methanol, confirming its detection accuracy and stability in complex organic environments. In addition, the developed paper-based sensor enabled convenient, portable and visually observable detection of water in organic reagents. This work not only provides a practical tool for rapid water detection in organic solvents but also offers a foundation for further extension to broader industrial applications through surface functionalization or device integration. Furthermore, the sensitivity of B-GQDs sensing system could be further improved through multi-elemental co-doping by enriching surface functional groups to meet the high-precision industrial-grade testing demands.
The authors declare that they have no known competing financial interests or personal relationships that could have appeared to influence the work reported in this paper.
Zhengxing Gong: Writing – original draft, Software, Data curation, Conceptualization. Kai Shi: Writing – original draft, Software, Data curation. Xiaoyan Tu: Writing – original draft. Xinfeng Zhang: Writing – review & editing, Visualization.
The authors confirm that the data supporting the findings of this study are available within the article and its supplementary materials.
The authors gratefully acknowledge the financial support from Sichuan Science and Technology Project (Nos. 2023ZYD0034 and 2024NSFJQ0061) and the State Key Lab of Geohazard Prevention & Geoenvironment Protection Independent Research Project (No. SKLGP 2023Z009).
Supplementary material associated with this article can be found, in the online version, at doi:
H. Liu, Y. Su, D. Deng, et al., Anal. Chem. 91 (2019) 9174–9180. doi: 10.1021/acs.analchem.9b01927
T. Sun, H. Song, X. Xie, et al., Chem. Eng. J. 470 (2023) 144029. doi: 10.1016/j.cej.2023.144029
X. Ma, Q. Ou, J. Yuan, et al., Chem. Eng. J. 464 (2023) 142480. doi: 10.1016/j.cej.2023.142480
Q. Chen, S. Li, X. Tu, et al., Biosens. Bioelectron. 263 (2024) 116606. doi: 10.1016/j.bios.2024.116606
Z. Chen, S. Li, Q. Mo, et al., Chin. Chem. Lett. 34 (2023) 108196. doi: 10.1016/j.cclet.2023.108196
R. Yadav, Y. Kwon, C. Rivaux, et al., J. Am. Chem. Soc. 145 (2023) 5970–5981. doi: 10.1021/jacs.2c13834
H. Peng, P. Liu, W. Wu, et al., Anal. Chim. Acta 1065 (2019) 21–28. doi: 10.1016/j.aca.2019.03.044
X. Zhang, W. Wang, L. Guan, et al., J. Anal. Test. 8 (2024) 40–51. doi: 10.1007/s41664-023-00283-x
P. Feng, X. Yang, X. Feng, et al., ACS Nano 15 (2021) 6266–6275. doi: 10.1021/acsnano.0c09228
W. Zhu, H. Song, L. Zhang, et al., RSC Adv. 5 (2015) 60085–60089. doi: 10.1039/C5RA08336B
Z. Shang, X. Yang, Q. Meng, et al., Smart Mol. 1 (2023) e20220007. doi: 10.1002/smo.20220007
S. Iravani, R.S. Varma, Environ. Chem. Lett. 18 (2020) 703–727. doi: 10.1007/s10311-020-00984-0
X. Yang, P. Zhang, J. Tan, et al., J. Anal. Test. 7 (2023) 147–156. doi: 10.1007/s41664-022-00244-w
M. Kaur, M. Kaur, V.K. Sharma, Adv. Colloid Interface Sci. 259 (2018) 44–64. doi: 10.1016/j.cis.2018.07.001
F. Yang, P. Lu, T.B. Ren, et al., Smart Mol. 1 (2023) e20220002. doi: 10.1002/smo.20220002
M. Rinawati, Y.X. Wang, W.H. Huang, et al., Carbon 200 (2022) 437–447. doi: 10.1016/j.carbon.2022.08.067
X. Huang, Z.L. He, Y. Chen, et al., Chin. Chem. Lett. 35 (2024) 109271. doi: 10.1016/j.cclet.2023.109271
S.J. Jeon, T.W. Kang, J.M. Ju, et al., Adv. Funct. Mater. 26 (2016) 8211–8219. doi: 10.1002/adfm.201603803
T.Y. Cheng, F.P. Chou, S.C. Huang, et al., J. Mater. Chem. A 10 (2022) 3650–3658. doi: 10.1039/d1ta09917e
Q. Fu, S. Sun, K. Lu, et al., Chin. Chem. Lett. 35 (2024) 109136. doi: 10.1016/j.cclet.2023.109136
C.T. Hsieh, P.Y. Sung, Y.A. Gandomi, et al., Chemosphere 318(2023) 137926. doi: 10.1016/j.chemosphere.2023.137926
X. Liu, J. Deng, J. Li, et al., Sens. Actuators B: Chem. 376 (2023) 132989. doi: 10.1016/j.snb.2022.132989
J. Feng, H. Dong, B. Pang, et al., J. Mater. Chem. C 7 (2019) 237–246. doi: 10.1039/c8tc03863e
R.S. Li, B. Yuan, J.H. Liu, et al., J. Mater. Chem. B 5 (2017) 8719–8724. doi: 10.1039/C7TB02356A
S. Jiang, L. Meng, W. Ma, et al., Mater. Chem. Front. 5 (2021) 4193–4201. doi: 10.1039/d1qm00231g
M. Bai, W.R. Seitz, Talanta 41 (1994) 993–999. doi: 10.1016/0039-9140(94)E0049-W
Y. Dong, J. Cai, Q. Fang, et al., Anal. Chem. 88 (2016) 1748–1752. doi: 10.1021/acs.analchem.5b03974
K. Anusuyadevi, S. Velmathi, J. Mol. Liq. 363 (2022) 119834. doi: 10.1016/j.molliq.2022.119834
P. Kumar, R. Sakla, A. Ghosh, et al., ACS Appl. Mater. Interfaces 9 (2017) 25600–25605. doi: 10.1021/acsami.7b05335
S. Yang, D. Liu, F. Liao, et al., Synth. Met. 162 (2012) 2329–2336. doi: 10.1016/j.synthmet.2012.11.011
E. Budak, C. Ünlü, Opt. Mater. 111 (2021) 110577. doi: 10.1016/j.optmat.2020.110577
Z. Liu, Z. Mo, X. Niu, et al., J. Colloid Interface Sci. 566 (2020) 357–368. doi: 10.1016/j.jcis.2020.01.092
J. Zhu, Y. Tang, G. Wang, et al., ACS Appl. Mater. Interfaces 9 (2017) 14470–14477. doi: 10.1021/acsami.6b11525
N. Carrillo, U. León-Silva, T. Avalos, et al., J. Colloid Interface Sci. 369 (2012) 103–110. doi: 10.1016/j.jcis.2011.12.021
D. Nicolas. Debarnot, F. Poncin. Epaillard, Anal. Chim. Acta 475 (2003) 1–15.
R. Wu, Y. Cao, Z. Chen, et al., Adv. Sens. Energy Mater. 4 (2025) 100140. doi: 10.1016/j.asems.2025.100140
Q. Fang, Y. Dong, Y. Chen, et al., Carbon 118 (2017) 319–326. doi: 10.1016/j.carbon.2017.03.061
X.T. Zheng, A. Ananthanarayanan, K.Q. Luo, et al., Small 11 (2015) 1620–1636. doi: 10.1002/smll.201402648
M.H.M. Facure, R. Schneider, L.A. Mercante, et al., Mater. Today Chem. 23 (2022) 100755. doi: 10.1016/j.mtchem.2021.100755
R. Das, S. Parveen, A. Bora, et al., Carbon 160 (2020) 273–286. doi: 10.1016/j.carbon.2020.01.030
S. Ge, J. He, C. Ma, et al., Talanta 199 (2019) 581–589. doi: 10.1016/j.talanta.2019.02.098
K.B. Cai, H.Y. Huang, M.L. Hsieh, et al., ACS Nano 16 (2022) 3994–4003. doi: 10.1021/acsnano.1c09582
X. Hai, Q.X. Mao, W.J. Wang, et al., J. Mater. Chem. B 3 (2015) 9109–9114. doi: 10.1039/C5TB01954K
X. Xu, G. Hu, L. Mo, et al., Nanoscale 13 (2021) 6846–6855. doi: 10.1039/d0nr08128k

Figure 1 (A) Schematic diagram of B-GQDs synthesis. (B) Color change of the reaction solution under daylight and FL variation at different reaction times.

Figure 2 (A) MS of B-GQDs. (B) Secondary MS of ion peak with m/z of 1199.44. (C) FT-IR spectrum of B-GQDs. (D) Raman spectrum of B-GQDs. (E) Path diagram of photocatalytic synthesis of B-GQDs.

Figure 3 (A) PL emission spectra of B-GQDs under different excitation wavelengths. (B) HRTEM image of B-GQDs (2:1) (The illustration shows the lattice of a single B-GQDs). (C) AFM diagram of B-GQDs (the inset shows the cutting height distribution along the line). (D) B 1s, (E) C 1s and (F) O 1s high-resolution spectra of B-GQDs (2:1).

Figure 4 (A) Schematic diagram of water content mechanism by B-GQDs. (B) FL spectra of B-GQDs for different water content in methanol (illustration shows the corrected working curve). (C) Linear curve of FL intensity of paper-based sensor for different water content in methanol.
Table 2. Standard curve for water content in organic solvents.
| Solvent | Linear curve | LOD (%) | R2 |
| Acetone | Y = -0.0185X + 1.0106 | 0.44 | 0.9901 |
| THF | Y = -0.0077X + 0.9781 | 0.28 | 0.9926 |
| DMSO | Y = -0.0096X + 0.9232 | 0.17 | 0.9903 |
| Methanol | Y = -0.0085X + 1.0046 | 0.28 | 0.9931 |
| Acetonitrile | Y = -0.0084X + 0.9051 | 0.16 | 0.9924 |
 下载: 导出CSV

 扫一扫看文章

扫一扫关注我们