Table 1.
Structure, assembly and function of the nanoadjuvant-contrast agent complex.
Citation:
Fan Meng, Yiqing Zhang, Zhen Yuan, Zhangyong Hong, Bin Yang, Jian Zhang. Recent progress on nanoadjuvants: From design and assembly to biomedical imaging[J]. Chinese Chemical Letters,
2026, 37(2): 111608.
doi:
10.1016/j.cclet.2025.111608

Recent progress on nanoadjuvants: From design and assembly to biomedical imaging
English
Recent progress on nanoadjuvants: From design and assembly to biomedical imaging
Abstract:
Adjuvants enhance and prolong the immune response to therapeutic agents, such as drugs and vaccines. However, conventional adjuvants have limitations in terms of immune specificity and duration. Nanoadjuvants can leverage their nanoscale size to increase the capture efficacy of antigens by antigen-presenting cells and improve immunogen presentation for targeted delivery. Furthermore, noninvasive visualization of bifunctional nanoadjuvants with integrated efficacy and imaging postdelivery can provide insights into in vivo distribution and performance, aiding in the optimization and design of new dosage forms. This review systematically summarizes the structure, assembly, and function of nanoadjuvants alongside contrast agents. It delves into the impact of complex structures formed by nanoadjuvant-contrast agent interactions on antigen presentation, migration, imaging tracking, and visualization of immune cell recruitment. It also discusses how imaging can determine optimal immune intervals, vaccine safety, and toxicity while enabling diagnostic and therapeutic integration. Moreover, this paper discusses potential applications of novel adjuvants and promising imaging technologies that could have implications for future vaccine and drug development endeavors.
-
1. Introduction
Vaccines work by safely exposing the immune system to parts or weakened forms of pathogens, triggering an immune response without causing disease [1,2]. This activates two key branches of immunity: humoral immunity, where B-cells produce antibodies to neutralize pathogens, and cellular immunity, where T-cells help coordinate the response and kill infected cells [3-5]. Specialized immune cells present vaccine antigens to helper T-cells, which then stimulate B-cells and cytotoxic T-cells to respond. Importantly, vaccination also generates memory B and T cells, enabling faster and stronger immune responses upon future exposure to the same pathogen [6,7].
Adjuvants play a pivotal role in the efficacy of vaccines, enhancing immune responses with reduced antigen doses and a decreased number of vaccinations [8-10]. Among the adjuvants approved by the Food and Drug Administration (FDA), including aluminum salts [11,12], MF59, AS03, AS04, CpG 1018, QS-21, and virosomes [13-16], each adjuvant functions through a distinct mechanism to stimulate antibody production and immune sensitization. Recent advancements have led to the development of nanoadjuvants, which offer distinct advantages in antigen delivery and presentation, particularly to dendritic cells (DCs) and macrophages [17]. Targeted delivery systems guided by major histocompatibility complex (MHC)-Ⅱ molecules have been shown to improve DCs uptake efficiency to 92.3% ± 5.1% [18]. Concurrently, the integration of near infrared (NIR)-Ⅱ imaging probes has enabled real-time visualization of macrophage recruitment with temporal resolution under 30 min [19].
The advent of nanotechnology has led to the development of nanoadjuvants [20], which represent a novel class of adjuvants distinguished by their precise size, shape, and surface characteristics. These characteristics facilitate cellular uptake and targeted delivery, enhancing the immune response to antigens. The design of nanoparticles (NPs) allows for the controlled release of antigens, potentially diminishing the need for multiple vaccinations. The surface modification of NPs allows for the selective induction of desired immune responses, thereby enhancing their immunogenic potential. Beyond their primary use, nanoadjuvants hold promise for diagnostic imaging and therapeutics, streamlining vaccine production and reducing costs.
Their application extends to multimodal imaging, a technique that visually tracks antigen distribution in vivo and aids in the refinement of adjuvant properties, spearheading the progress of precision medicine [21-23]. These imaging techniques provide real-time monitoring of immune engagement and vaccine dissemination, which are key to evaluating safety and efficacy. Consequently, this investigation examines the multifaceted roles of nanoadjuvants, from their structural integration with imaging agents to their contribution to immune response optimization and safety assessment, culminating in their potential to unify diagnostic and therapeutic modalities.
2. Structure and assembly of nanoadjuvants and contrast agents
Nanoadjuvant-contrast agent conjugates are multifunctional complexes that integrate the fields of nanotechnology, drug delivery, molecular imaging, and immunology. These conjugates leverage the immunostimulatory effects of nanoadjuvants in conjunction with the enhanced imaging capabilities of contrast agents. These conjugates hold considerable promise for applications in the diagnosis, treatment monitoring, and vaccine development for various diseases, including cancer. Engineered at the nanoscale, nanoadjuvants are adept at mimicking pathogen size and shape, enabling sustained antigen release and optimizing antigen delivery to cellular and humoral immune components.
Different types of contrast agents are used for other imaging techniques, such as X-ray/computed tomography (CT), magnetic resonance imaging (MRI), and positron emission tomography (PET). In nanoadjuvant-contrast-agent conjugate materials, the nano-adjuvant carrier can be conjugated to the contrast agent to provide composites capable of practical real-time imaging and stimulation of a specific immune response. Critical synthesis parameters:
(a) Size control. Lipid NPs (LNPs): Prepared via thin-film hydration method with post-sonication and annealing yields 132–155 nm particles [24]. Metal–organic frameworks (MOFs): modulator concentration (e.g., 10 mmol/L acetic acid) tunes zeolitic imidazolate framework-8 (ZIF-8) size from 50 nm to 200 nm [25].
(b) Surface modification. MOFs: Post-synthetic ligand exchange (e.g., polyethylene glycol (PEG)-NH2 incubation 24 h) achieves 90% coating density [26]. Inorganic NPs: citrate stripping + Toll-like receptor (TLR)-agonist conjugation via ethyldimethylaminopropyl carbodiimide/N-hydroxy succinimide (EDC/NHS) chemistry (molar ratio 1:1.5) [27,28].
(c) Contrast integration. Gd3+ doping in MOFs: 5–15 wt% optimal for MRI contrast without crystal distortion [24].
Nanoadjuvant-contrast agent conjugates are commonly categorized by material as shown in Table 1 [24,29-41].
Table 1

 DownLoad:
CSV
DownLoad:
CSV
Material Contrast agent Nanoadjuvant Imaging Structure Assembly method Function Ref. Organic molecular materials Gd CAF01 MRI Liposome Film method Vaccine [24] Iodine R837 CT Sphere Self-assembly Tumor [29] Alexa488 Poly(I: C) FI Nanofiber Self-assembly Chemical modification [30] MTRIPS; DOTA; 64Cu mRNA PET-CT – Self-assembly mRNA vaccine [31] Radioactive materials [18F]FDG CpG PET – – Tumor [32] 99mTc αGC SPECT/CT – – mRNA vaccine [33] Inorganic nanomaterials Au NPs CpG FI Biomimetic materials In situ reduction Tumor [34] GQDs Al FI/USI Zero-dimensional nanomaterial Chemical bond Imaging [35] Fe Mn2+ MRI 3D diamond Gas diffusion method Vaccine [36] Organic-inorganic hybrid materials FITC AI FI MOF Self-assembly Inhaled vaccine [37] 111In; 67Ga CAF01 SPECT/CT – Chemical modification Vaccine [38] Biomaterials 64Cu mAb PET – Self-assembly Vaccine [39] Other materials Copper chelator DOTA-NHS ester; Alexa Fluor 647 CpG PET/MRI – Solid-phase synthesis Vaccine [40] Nonablative diode laser and 5% imiquimod cream Imiquimod cream + laser Laser confocal and multiphoton microscopy techniques – Laser radiation Vaccine [41] 3. The temporalization strategy of adjuvants
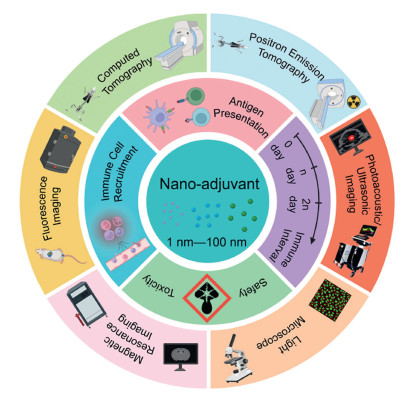
Multimodal imaging, incorporating MRI, PET, CT, and optical techniques, is pivotal for developing new vaccines and therapeutic interventions. These imaging tools (Fig. 1) facilitate the in vivo tracking of antigen-adjuvant interaction, distribution, and cellular uptake, providing insights essential for enhancing adjuvant design and precision medicine. These imaging techniques [42-45] facilitate the observation of the kinetics of immune cell activation and migration, thereby supporting the development of customized vaccination strategies and providing insights into immune processes. This imaging is vital for evaluating the safety and toxicity of adjuvants, with the ability to detect adverse responses early. Moreover, integrating diagnostics and therapeutics via multimodal imaging signifies a paradigm shift towards precision vaccinology and immunotherapy, facilitating disease detection, monitoring, and assessment of treatment efficacy. Continued imaging exploration in adjuvant research will refine our immunological knowledge and catalyze advancements in clinical applications.
Figure 1
 Figure 1. Advances in multimodal imaging for nanoadjuvants.
3.1 Imaging tracer nanoadjuvants for antigen presentation
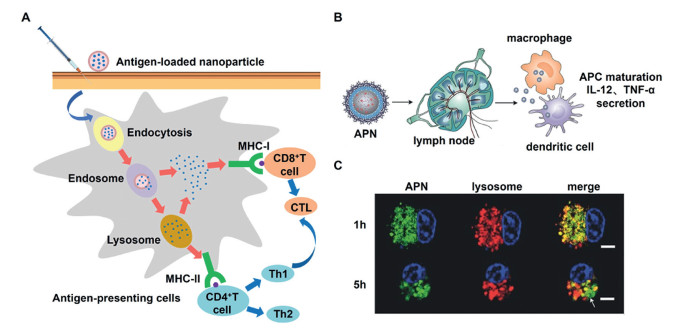
Multimodal imaging technology allows researchers to dynamically track the uptake and delivery of antigens in vaccines, helping to gain a deeper understanding of vaccine mechanisms to optimize vaccine design. Specialized NPs enhance the immune response and modulate antigen distribution and lymph node (LN) migration in the body to stimulate a robust immune response. Nanoadjuvants interact with antigen-presenting cells (APCs) through four key steps: antigen uptake, processing, presentation and immune activation. Nanoadjuvants promote more efficient phagocytosis of antigens by APCs. Antigens are processed within APCs and then presented to T cells via MHC molecules, which activate T cells and their subsequent immune functions (Fig. 2A). Activated B cells are then transformed into antibody-producing plasma cells. Moreover, some B and T cells form memory cells that provide long-term immune memory. These processes provide the basis for initiating and developing immune responses and offer critical insights for developing vaccines and immunotherapies. Imaging techniques such as fluorescence microscopy [46], flow cytometry, and in vivo imaging can be used to visualize the interactions between APCs and T cells and follow the distribution and kinetics of vaccine components in vivo [47].
Figure 2
 Figure 2. Antigen presentation process of adjuvants. (A) Essential uptake pathways of antigens (e.g., endocytosis and phagocytosis) by APCs induce immune responses. (B) Schematic of how APN—CpG activates DCs and macrophages in LNs. C57BL/6 mice were injected in the footpad with 25 µL of the indicated formulations, and popliteal LNs were isolated for analysis at the indicated time points. (C) Representative confocal laser scanning images showing BMDCs cultured for different periods with FITC-APN (green); lysosomes were stained with LysoTracker Red (red). Nonoverlapping green and red signals indicate lysosomal escape of APN (white arrow). Scale bar: 5 µm. Reproduced with permission [48]. Copyright 2017, John Wiley and Sons.
CpG-ODN, a prototypical TLR9 agonist, serves as a common adjuvant to exemplify how TLR agonist delivery platforms overcome limitations of free agonists (e.g., rapid clearance, off-target toxicity). Jiang et al. achieved effective antigen (ovalbumin, OVA) and adjuvant (CpG ODN) adsorption and LN-targeted delivery via the use of polyethylene glycol derivative (PEG-poly(AGE-Suc))-stabilized aluminum hydroxide nanoparticles (APNs) as carriers [48]. These negatively charged NPs with a size of less than 90 nm were monodisperse in an aqueous solution, and in vivo behavioral tracking was achieved via fluorescein isothiocyanate (FITC) labeling. APN—CpG was able to activate APCs efficiently in the draining LNs. When the effect of APN—CpG on the activation of APCs in the LNs was examined (Fig. 2B), it was found that APNs with a size of approximately 85 nm were able to efficiently reach the draining LNs, where they remained at relatively high concentrations for more than 24 h. The ability of APN—CpG to activate APCs in the draining LNs, including mature DCs and macrophages, was further demonstrated, inducing the production of the cytokines interleukin-12 (IL-12) and tumor necrosis factor-α (TNF-α). In addition, this step of adjuvant escape from the lysosome after phagocytosis by APCs is critical for further processing of the antigen. Since lysosomes contain enzymes that degrade substances, if antigens are trapped in lysosomes, they may be degraded and not effectively presented to the immune system. Once the antigen escapes the lysosome and enters the cytoplasm, it can be further processed into peptides. These peptides can bind to MHC class Ⅰ molecules and be presented to CD8+ T cells on the cell surface, stimulating a cellular immune response. Confocal laser scanning microscopy (Fig. 2C) revealed that when LysoTracker Red was used to visualize the lysosomes of bone marrow-derived dendritic cells (BMDCs), separate fluorescence of APNs (green) and lysosomes (red) was observed, suggesting that the displayed APNs can escape from intracellular lysosomes and facilitate antigen cross-presentation. These findings indicate that APN—CpG is an efficient vaccine delivery system that significantly promotes the activation of cellular immune responses.
Zupančič et al. introduced a poly(lactic-co-glycolic acid) (PLGA)-based nanoparticle system combining several excipients that efficiently delivers antigens and adjuvants to DCs to enhance the immune response [49]. These NPs are less than 200 nm in size and have a near-neutral surface charge, allowing their morphology to be observed via atomic force microscopy imaging and protein loading to be optimized via different strategies. The effects of surfactants on the physicochemical properties and stability of the NPs were also investigated. Multispectral cellular imaging technology helps to accurately understand and quantify intracellular molecular dynamics at the single-cell level, facilitating a deeper understanding of intracellular signaling mechanisms.
Nanoadjuvants significantly enhance antigen retention, extending residence time by more than 20-fold compared to alum adjuvants [50,51]. This process can be divided into three phases: phase 1 (0–6 h), characterized by 92.3% retention of nanocarriers at the injection site versus 45.2% for free antigen; phase 2 (6–72 h), during which sustained antigen release to LNs occurs with a rate constant (k) of 0.08 h−1; and phase 3 (> 72 h), involving biodegradation-mediated clearance that coincides with immune memory establishment. This combination of nanosystems and imaging techniques may lead to new insights into vaccine development and cell biology research. To indirectly monitor antigen presentation via other imaging modalities, cells were analyzed via fluorescence-activated cell sorting (FACS) Canto Ⅱ and FlowJo software, which allows the detection of cells associated with antigen presentation, such as DCs expressing markers such as CD11c, CD80, CD86, MHC-Ⅱ, and CD40. In addition, T-cell responses [52], which usually change after antigen presentation, were also assessed.
3.2 Migration and imaging tracking
With advances in imaging technologies, researchers can now understand the behavior of vaccine adjuvants in the body. These techniques provide detailed information about the location, distribution, and cellular interactions of adjuvants within an organism, allowing assessment of adjuvant safety, efficacy, and role in eliciting an immune response. Imaging strategies vary in sophistication, including whole-body imaging (e.g., MRI, PET, and CT scans), organ imaging, and cellular/molecular level techniques (e.g., fluorescent labeling). These techniques have helped researchers reveal the function and dynamics of nanoadjuvants at the global and local levels.
The selection of imaging modalities requires a careful balance between spatiotemporal resolution and biological safety. PET enables sensitive detection of over 100 immune cells with ~95% sensitivity, although cumulative radiation exposure must be limited to below 10 mSv per study [53]. MRI offers sub-millimeter spatial resolution suitable for visualizing DC clusters but necessitates high doses of contrast agents, typically exceeding 0.1 mmol Gd/kg [54]. A clinical decision framework summarizing these trade-offs is detailed in Table 2 [53,55-58].
Table 2
Table 2. Comparative analysis of imaging modalities for nanoadjuvant tracking.DownLoad:
CSV
Technique Resolution Sensitivity Depth Radiation risk Real-time capability Key limitation MRI 10–100 µm Low (µmol/L–mmol/L) Unlimited None Minutes Long acquisition (> 30 min) PET 1–2 mm High (pmol/L–nmol/L) Unlimited High Minutes Requires radiolabeling SPECT 1–2 mm Moderate (nmol/L) Unlimited Moderate Minutes Lower resolution than PET CT 50–200 µm Low (mmol/L) Unlimited Moderate Seconds Poor soft-tissue contrast Fluorescence Visible 1–5 µm Moderate (nmol/L) < 1 mm None Milliseconds Minimal tissue penetration NIR-Ⅰ 5–20 µm Moderate (nmol/L) 2–5 mm None Milliseconds Autofluorescence interference NIR-Ⅱ 20–50 µm High (pmol/L) 5–20 mm None Milliseconds Quantitative accuracy challenges Ultrasound 50–500 µm Low (mg/mL) 5–20 cm None Milliseconds Requires microbubble contrast agents 3.2.1 Vaccines
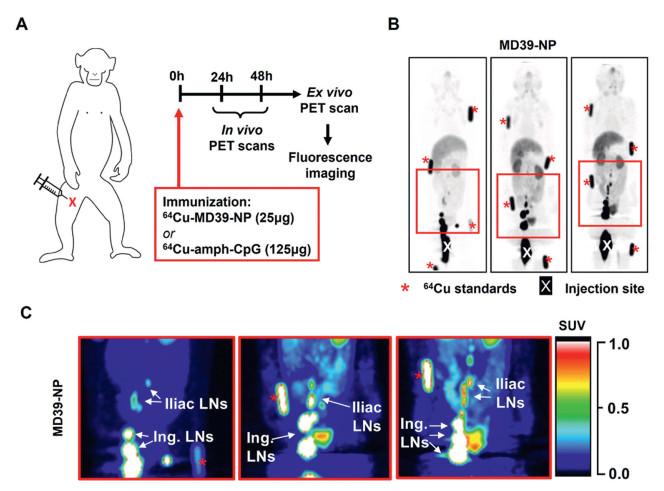
The vaccine distribution in nonhuman primates was monitored noninvasively via 64Cu- and DyLight 680-labeled probes. The vaccine used in the study, MD39 NPs, was prepared by fusing a stabilized trimeric protein of acquired immune deficiency syndrome (HIV)-1 with archaeal ferritin and labeled with a copper chelator as well as an Alexa Fluor 647 antibody-labeled kit (Fig. 3A). Figs. 3B and C show that a large pool of MD39 NPs remained near the injection site 24 h after immunization (~60% of the injected dose). The antigenic signal was attenuated or remained approximately constant in the LNs, as evidenced by antigen aggregation, and no further aggregation was detected in more distal LNs. Significant uptake of the nanoparticle antigen was detected in several inguinal, external iliac and common iliac LNs. The qualitative biodistribution of the MD39 NPs remained unchanged at 48 h after immunization. Antigenic signaling decreased or remained nearly constant in the LNs, indicating antigenic aggregation, with no further aggregation detected in more distal LNs. This study demonstrated that LN antigen accumulation is critical for vaccine efficacy and effectively monitors vaccine and adjuvant migration and biodistribution in humans and large animals. Scientists successfully tracked the distribution of the HIV outer membrane trimeric protein nanoparticle (trimer-NP) vaccine and its lipid-conjugated CpG adjuvant (amph-CpG) in vivo via a combination of PET and whole-tissue fluorescence imaging (FI) [40]. The results revealed that the vaccine components rapidly aggregated in LNs up to 17 cm from the injection site and significantly accumulated near the follicular dendritic cell (FDC) network of the B-cell region. This study demonstrated the potential of nanovaccines to enhance the immune response by increasing their concentration in specific regions, which is particularly beneficial for boosting mucosal immunity.
Figure 3
 Figure 3. Imaging to track the migration of adjuvants. (A) Immunization timeline for PET and MR imaging studies. (B) Maximum intensity projections (MIPs) of representative in vivo PET scans at 24 h showing the 64Cu-DOTA-MD39-NP signal. "X" denotes the injection site, and red asterisks indicate fiducial markers. (C) Pseudocolor images of the boxed areas are shown in (B), highlighting drainage to the iliac and inguinal LNs. Copied with permission [40]. Copyright 2021, Elsevier.
In recent years, the use of TLR agonists, as new immune adjuvants, has made significant progress in enhancing vaccine-specific immune responses. TLR agonists act as pathogen-associated molecular pattern (PAMP) mimetics that bind to DCs surface TLRs (e.g., TLR4 for Lipopolysaccharide, TLR9 for CpG-ODN), triggering MyD88-dependent signaling cascades to enhance: Antigen cross-presentation, costimulatory molecule expression (CD80/CD86) and proinflammatory cytokine secretion (IL-12, interferon-γ (IFN-γ)). Wang's team constructed a CpG motif-containing nanovaccine by labeling the OVA antigen with the NIR fluorescent dye cypionate to form a nanodisc structure that enabled long-term tracking and sustained immune activation in vivo [59]. The nanovaccine optimized the simultaneous delivery of antigen and adjuvant, stimulated the activation of DCs and enhanced their ability to migrate to LNs, suggesting the potential to induce long-term immune protection. A vaccine adjuvant system based on a small-molecule TLR7 agonist was developed. Yin et al. also demonstrated the monitoring of vaccine the in vivo distribution of a vaccine over a long period via precise imaging, revealing that TLR7 NPs provide more effective in vivo retention than conventional adjuvants that promote long-lasting immune activation [60].
3.2.2 Cancer vaccines
In cancer therapeutic research, the application of nanotechnology-based adjuvant vaccine delivery systems provides new opportunities for precise immunomodulation. For example, Liang et al. developed a liposome-coated gold nanocage (Lipos-AuNC) nanovaccine platform designed to target DCs via CD11c antibodies and deliver the melanoma-specific antigenic peptide tyrosine-related protein 2 (TRP2) and the adjuvant monophosphoryl lipid A (MPLA) [61]. Through in vivo FI and photoacoustic imaging (PAI) techniques, researchers can observe in detail the behavior of this nanovaccine in vivo, including its accumulation in LNs and the dynamic distribution of DCs. The core of the Lipos-AuNC-MPLA-aCD11c-TRP2 nanovaccine consists of polyvinyl pyrrolidone (PVP)-coated gold nanocages encapsulated in liposomes modified with a specific CD11c antibody and TRP2 antigenic peptide. Analysis of TRP2 release behavior revealed that the release pattern of this nanovaccine was closer to that of the Ritger-Peppas model, suggesting that the liposome coating played an essential role in regulating the release process. Lipos-AuNC nanovaccines activate DCs via MPLA-triggered TLR4 signaling, promoting DCs maturation and CD8+ T cell priming for robust antitumor immunity. Their fluorescent and photoacoustic properties enable real-time imaging of nanovaccine delivery and T cell infiltration, supporting dynamic evaluation of immune responses and therapeutic efficacy.
In summary, this nanovaccine has the potential to enhance the immune response against tumors and deliver components to specific immune cells. It effectively prevented B16-F10 melanoma and lung metastasis, highlighting its potential as a platform for future antitumor immunotherapy and in vivo tracking.
3.3 Visualization of immune cell recruitment
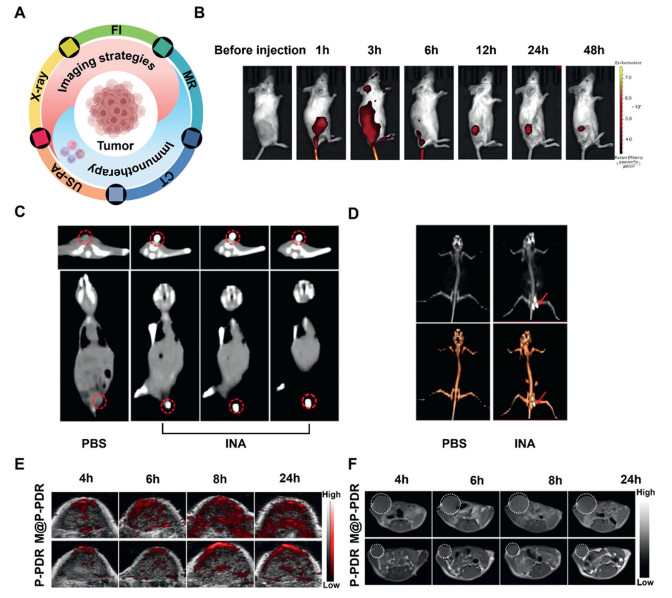
Nanoadjuvants optimize the interaction with immune cells and enhance the immune response through specific surface features, charges or chemical modifications. In the case of tumors, for example, once introduced into the body, the nanoadjuvants are recognized and taken up by immune cells such as DCs and macrophages, which relay information to T and B cells, which then mount an immune response against a specific tumor antigen. Multimodal imaging allows precise visualization of the distribution and localization of these NPs in the body and how they trigger and direct the recruitment of immune cells to specific regions (Fig. 4A). The power of multimodal imaging also lies in its ability to reveal the spatial and temporal characteristics of different immune cell responses and how nanoadjuvants affect the immune environment. Therefore, we take tumor cells as an example and divide them into three categories by material: composite NPs, nanoadjuvants containing contrast agents, and bionanoparticles for review.
Figure 4
 Figure 4. Different imaging techniques monitor the adjuvant-induced recruitment of immune cells. (A) Relationships of different imaging strategies with adjuvant-generated immunotherapy. (B) Time series of the tumor NIR FI in situ. Reproduced with permission [62]. Copyright 2021, Elsevier. (C) Axial and coronal CT images of 4T1 tumor-bearing mice after intratumoral injection of PBS or INA. The red circles indicate the locations of the tumors. (D) 3D reconstruction images from CT images of 4T1 tumor-bearing mice after intratumoral injection of PBS or INA. Red arrows indicate the location of the tumors. (C, D) Reproduced with permission [29]. Copyright 2022, Frontiers. (E) In vivo PA images of tumors. (F) T1-weighted MR images of tumors. (E, F) Reproduced with permission [65]. Copyright 2021, Springer Nature.
3.3.1 Composite NPs
ICG-CpG@MOF combines the MOF MIL-101-NH2, indocyanine green (ICG) and CpG ODN to self-assemble into nanocarriers [62]. Multimodal imaging (fluorescence, photoacoustic, thermal, and MRI) can be used to monitor the distribution of ICG-CpG@MOF in vivo and its accumulation at tumor sites. Using FI (Fig. 4B), a fluorescent signal was detected at the tumor site after tail vein injection, with the intensity increasing over 24 h, indicating that the time point of maximum immune cell recruitment was 24 h, when the treatment peaked and then decreased significantly after 48 h. Importantly, when the nanocarriers released CpG ODN into the tumor microenvironment, they activated the immune system and induced immune cells to migrate to the tumor site. This technique not only demonstrates that nanoadjuvants can passively target tumors but also demonstrates their immunotherapeutic potential.
In addition, researchers designed and prepared a bioresponsive diagnostic nanoparticle (IMQ@ACC(Mn)-ICG/PEG) comprising manganese ion-doped amorphous calcium carbonate embedded with ICG as a core and loaded with imiquimod [63]. The NPs exploit the low pH of the tumor microenvironment to achieve targeted delivery and are monitored by FI and T1-weighted MRI. The combined use of photothermal therapy and immunotherapy can significantly improve treatment efficacy.
3.3.2 Nanoadjuvants
Xin et al. introduced investigated iodine-enriched nanoadjuvants (INAs), which are nanoadjuvants consisting of iodine-enriched polyethylene glycol-polyhydroxyethyl methacrylate (PEG-PHEMA-I) copolymer encapsulating phthalocyanine and the TLR7 agonist R837 [29]. INAs are suitable for photodynamic therapy. However, their high iodine content also makes them an ideal CT imaging contrast agent, and tumor sites injected with INAs showed substantial contrast enhancement compared with those in the PBS control group (Fig. 4C). To better visualize tumor enhancement, researchers reconstructed 3D virtual reality (VR) images from two-dimensional (2D) CT images, which revealed significant tumor enhancement in the subcutaneous flanks of the mice (Fig. 4D). In addition, INAs support immunotherapy by promoting DC maturation and T-cell proliferation.
M-NA is a nanoadjuvant composed of a core of iron oxides and gold wrapped in an outer layer of polyethyleneimine (PEI) [64]. M-NA can electrostatically load CpG ODN, and its distribution in vivo was tracked via X-ray and MRI. Functional nanoadjuvants can be precisely injected into tumors by X-ray imaging guidance. They can be monitored for extended periods via MRI, suggesting that this continuous image-guided therapy can potentially be translated into clinical treatment. APCs can efficiently take up these adjuvants to activate the immune response.
3.3.3 Bionanoparticles
Chen et al. used M@P-PDR, a complex of Prussian blue (PB), docetaxel (DTX) [65], and an immune adjuvant (R837) encapsulated in poly(lactic-hydroxyglycolic acid) (PLGA) nanorods with the outer layer encapsulated with tumor cell membranes. This structure facilitated the accumulation of nanocarriers at the tumor site. This technique allows monitoring of immune cell recruitment via PAI (Fig. 4E) and MRI (Fig. 4F). Over time, the tumor area showed a significant increase in brightness, which peaked at 8 h and persisted until 24 h. PAI and MRI not only allowed visual monitoring of adjuvant-induced immune cell recruitment and aggregation at the tumor site but also assessed the recruitment efficiency of immune cells and the accumulation of nanocarriers at the tumor site by comparing the changes in signal intensity in different treatment groups.
In conclusion, multimodal imaging played a vital role in this study by monitoring the dynamic changes in immune cells induced by immunoadjuvants and evaluating the distribution and retention of nanocarriers at the tumor site, thus providing a vital imaging basis for subsequent therapeutic strategies. These features provide strong evidence for the use of nanoadjuvants in cancer therapy and imaging and foreshadow their potential value in future medicine.
Immune cell recruitment dynamics can be precisely monitored using multimodal imaging of nanoadjuvants, as measured above, which accumulate at target sites and activate immune responses. For example, imaging modalities such as fluorescence, photoacoustic, MRI, and CT reveal spatiotemporal distribution of nanoadjuvants and correlate with the timing of immune cell infiltration. These imaging markers, including FI and T1-weighted MRI, provide crucial guidance for identifying optimal booster immunization windows. The next section explains how these imaging measures help move from fixed schedules to personalized immunization timing.
3.4 Optimal immunization intervals
Studies have shown that adjusting of vaccine booster intervals affects immune response and protection [66]. Shorter booster intervals (e.g., 0–3–6 weeks) may preserve CD8+ T cell function but compromise long-term memory T cell persistence. Longer intervals (e.g., 0–4–12 weeks) tend to generate central memory T cells, which are critical for long-term protection (e.g., tuberculosis). Longer booster intervals also increase specific T-cell responses. For example, Mycobacterium tuberculosis vaccine booster intervals of 8 months induced stronger and longer-lasting protection than did. Compared with the 0–6-week immunization regimen, the 0–4–12-week immunization regimen induced higher levels of IL-2 and IFN-γ and greater masses and numbers of central memory T (TCM)-like cells, which was associated with longer-lasting protective efficacy. With respect to the production of Ag85B-specific IgG1 antibodies, the 0–3–6-week and 0–4–12-week regimens induced a strong humoral immune response.
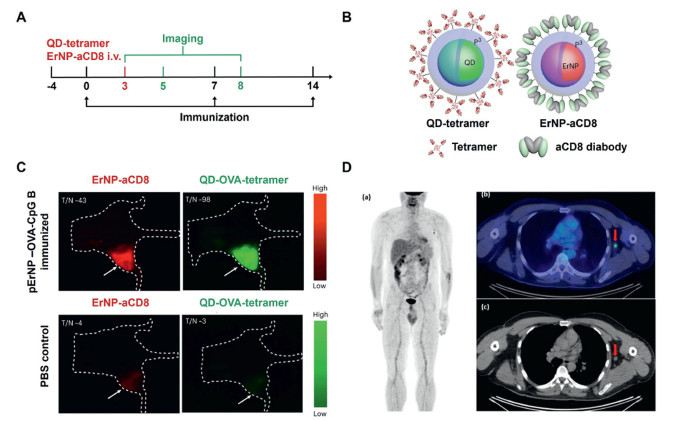
Ren and colleagues developed a rare earth-doped NPs for deep tissue imaging in the NIR second window (NIR-IIb, 1500–1700 nm) [67]. These NPs are suitable for imaging with high penetration efficiency and can also be used as vaccine-delivery vehicles to improve in vivo imaging and immunotherapy. For E.G7 tumor-bearing mice, after immunization on day 0, the researchers intravenously injected a mixture of ErNP-aCD8 and QD-OVA quadruplex probes on day 3. Then, they performed dual imaging at different time points (Fig. 5A). These multifunctional NPs (Fig. 5B) were obtained via chemical synthesis and surface modification to increase their biocompatibility and allow functionalization. They emit fluorescence that can be multiplexed for imaging through different excitation wavelengths or excited-state lifetimes, allowing simultaneous differentiation of multiple biomarkers in vivo. In one experiment, researchers combined these NPs with OVA antigen and CpG B adjuvant for imaging tracking of specific cytotoxic T lymphocytes (CTLs) in a mouse model. As shown in Fig. 5C, accumulation of particular CTLs within tumors was observed after nanovaccination, contributing to tumor shrinkage. In addition, control animals treated with PBS alone did not show the same accumulation of CTLs, which is consistent with continued tumor growth. This finding showed that receiving multiple vaccinations at the correct times can boost the immune system and prevent tumors from growing. This rare earth-doped nanoparticle shows excellent potential as a multimodal imaging probe and vaccine delivery system for deep tissue imaging and immunotherapy.
Figure 5
 Figure 5. Immunization intervals for imaging tracer adjuvants. (A) Immunization and imaging schedule. (B) Schematics of a QD functionalized with a P3 coating and conjugated to a biotinylated H-2Kb chicken ova 257–264 SIINFEKL to form a QD-OVA-tetramer (left) and ErNP functionalized with a P3 coating and conjugated to a CD8 diabody (right). (C) Representative wide-field NIR-IIb molecular images from one of three mice bearing E.G-7 tumors immunized with pErNP-OVA-CpG B, recorded 48 h after i.v. Reproduced with permission [67]. Copyright 2023, Springer Nature. (D) A 48-year-old male patient was diagnosed with pT3b pN0, malignant melanoma, and a follow-up scan was performed. Image (a) shows the maximum intensity projection of the patient's scan. Images (b, c) show metabolically active axillary LNs, on the same side as the mRNA vaccine, taken one week before the PET-CT examination, raising the suspicion of disease progression (marked with an arrow). Reproduced with permission [68]. Copyright 2022, Multidisciplinary Digital Publishing Institute (MDPI).
In the development of the coronavirus disease 2019 (COVID-19) vaccine, the timing of PET-CT scans is critical to avoid misdiagnosis. A case report of a 48-year-old man who underwent PET-CT one week after COVID-19 vaccination revealed hypermetabolic activity in the ipsilateral axillary LNs and progression of the disease initially suspected to be malignant melanoma [68]. Follow-up biopsy confirmation revealed a vaccine-induced inflammatory response, not cancer. This finding (Fig. 5D) underscores increased metabolic activity in the LNs in the weeks following vaccination and may lead to misinterpretation of the PET-CT results. Standardized uptake value (SUV)max values of axillary LNs decrease significantly with increasing interval post-vaccination (median SUVmax 3.5 ± 0.5; r = −0.54, P = 0.005), indicating waning metabolic activity over time. To minimize this risk of misinterpretation, researchers recommend waiting at least 6 weeks after mRNA vaccination before undergoing PET-CT and suggest collecting complete vaccination information at the time of the scan. This recommendation helps clinicians differentiate between a normal vaccine response and underlying disease progression, ensuring a more accurate diagnosis.
In response to the COVID-19 vaccination interval, it has been shown that the strategy of extending the interval to 16 weeks while potentially reducing short-term immune protection compared with the standard 21-day interval helps to stimulate more potent B- and T-cell responses [69], thus providing more durable immune memory and potentially long-term protection. In addition, a single dose of the vaccine was sufficient to induce a robust immune response in individuals with a history of severe acute respiratory syndrome coronavirus 2 (SARS-CoV-2) infection. Another study investigated the ability of TLR7/8 agonist-enhanced adjuvant liposomes (SA-LNPs) to increase the immune efficacy of a SARS-CoV-2 mRNA vaccine [70]. Replacing some of the LNP components with immune-activated adjuvant liposomes improved the efficiency of mRNA delivery, enhanced the innate immune response to the vaccine, and promoted more robust local and systemic adaptive immune responses without increasing the risk of inflammatory side effects. These results support the beneficial effects of vaccination strategies with extended immunization intervals and immune-enhancing adjuvants for the COVID-19 vaccine and provide an essential basis for strategic adjustments in vaccination programs.
On the basis of these studies, researchers have concluded that longer vaccination intervals facilitate the induction of longer-lasting T-cell-mediated immune memory, which may provide better disease protection. These findings have important implications for the optimization and delivery of vaccine strategies.
3.5 Imaging to monitor the safety and toxicity of adjuvants
The intrinsic properties of nanoadjuvants enable self-monitoring of safety profiles through two mechanisms. One is the built-in contrast agents (e.g., iron oxide/Mn2+ in adjuvant matrices) enable direct toxicity tracking of nanoparticle accumulation in organs [42]; and the other is the functional imaging captures adjuvant-induced immune responses, such as localized fluorodeoxyglucose (FDG)-PET signal elevation at injection sites reflecting real-time inflammation kinetics-eliminating dependence on external contrast media [19].
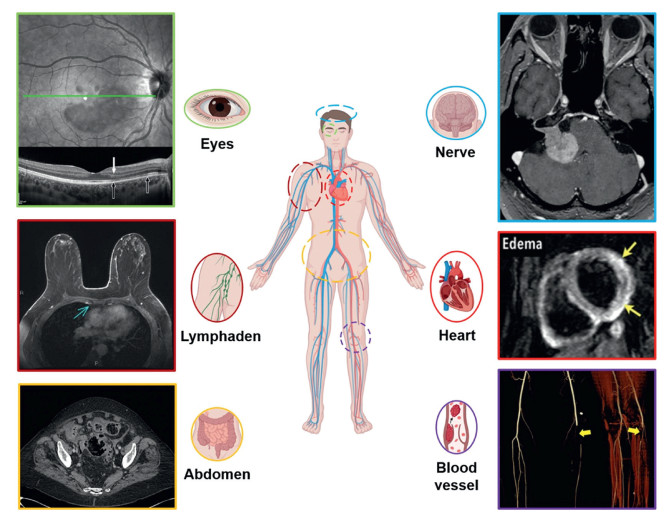
Vaccination can cause multisystem complications such as cardiovascular, neurologic, vascular, abdominal, LN, cutaneous, and ocular complications. Imaging modalities (Fig. 6) such as cardiac ultrasound, cardiovascular magnetic resonance imaging (CMR), CT, MRI, single-photon emission computed tomography (SPECT) and PET-CT, play essential roles in diagnosing and evaluating these vaccine-related complications [71-76]. This section (3.5.1–3.5.6) is described in more detail in Supporting information.
Figure 6
 Figure 6. Adverse reactions following vaccination. Cardiovascular complications reproduced with permission [72]. Copyright 2013, Wolters Kluwer Health, Inc. Neurological complications reproduced with permission [73]. Copyright 2021, Cureus. Vascular complications reproduced with permission [71]. Copyright 2022, Springer Nature. Abdominal complications reproduced with permission [74]. Copyright 2015, Springer Nature. Lymphadenopathy reproduced with permission [75]. Copyright 2022, Elsevier. Skin complications and eye side effects reproduced with permission [76]. Copyright 2022, Wiley.
3.6 Other imaging techniques for studying the role of nanoadjuvants
Imaging techniques are also essential for studying the effects of nanoadjuvants. Electron microscopy reveals the microstructure of adjuvants, whereas light microscopy and immunofluorescence staining assess the impact of adjuvants on immune responses. Studies of the effects of NIR light on vaccine adjuvants suggest that specific wavelengths of light may promote the migration of DCs to LNs. This section is described in more detail in Supporting information.
3.7 Immunogenicity and toxicity of contrast-integrated nanoadjuvants
Contrast agents such as Gd3+, Fe3O4, and quantum dots facilitate real-time immune monitoring but raise concerns regarding immunogenicity and long-term biosafety that necessitate thorough evaluation. This section is described in more detail in Supporting information.
In summary, various imaging techniques have demonstrated the distribution of different types of adjuvants in the immune response and the effects of external stimuli, such as NIR light, on immune system components, providing valuable information for researching and developing vaccine adjuvants.
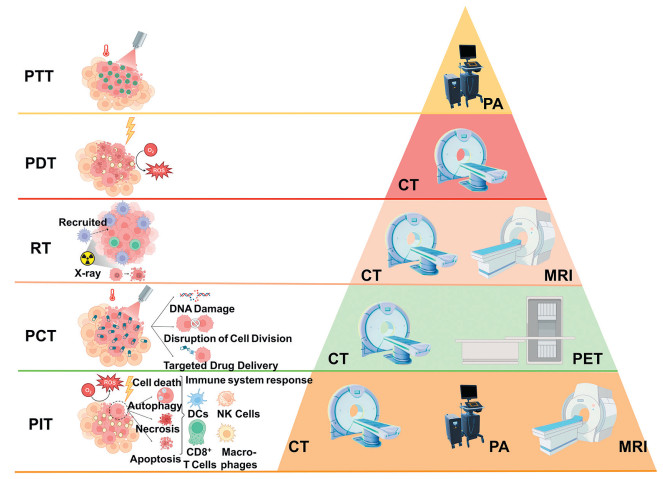
4. Application of diagnosis and treatment integration
The "diagnosis and treatment integration" model combines diagnostic and treatment processes to optimize patient care by minimizing delays in disease management and enhancing the efficiency and quality of care. For example, while imaging effectively monitors tumors, combining it with an immune adjuvant can significantly increase its effectiveness. This multimodal approach [77-82] to treatment (Fig. 7), which incorporates real-time imaging and adjuvants, not only improves treatment efficacy but also enables physicians to monitor treatment progress and outcomes in real time, deepen their understanding of disease mechanisms, and tailor a personalized treatment plan for the patient. In the future, diagnostic integration will leverage the integration of these technologies to provide optimized and comprehensive healthcare services to patients, driving healthcare toward greater efficiency and precision. This section (4.1–4.5) is described in more detail in Supporting information.
Figure 7
 Figure 7. Five imaging combination therapies (treatment mechanism diagram on the left; standard imaging methods on the right).
5. Discovery of novel adjuvants
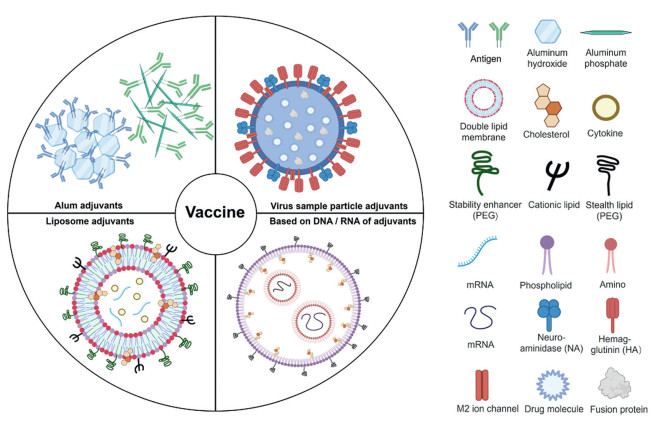
Significant progress has been made in the development of novel vaccine adjuvants [83-110]. In addition to the classical adjuvants mentioned above, many other compounds from different classes have been evaluated as adjuvants, including mineral salts, microbial products, polymers and liposomes. In particular, the introduction of nanotechnology has allowed adjuvants to take new forms, such as liposomes, emulsions and virus-like particles, and these nanocarriers have been used to improve the bioavailability and overall efficacy of vaccines through the ability to control the release of active ingredients. This section presents several novel adjuvants (Fig. 8), "old material new" adjuvants represented by aluminum nanoadjuvants, liposome nanoadjuvants, nucleic acid nanoadjuvants, and viral nanoparticle adjuvants. This section (5.1–5.4) is described in more detail in Supporting information.
Figure 8
 Figure 8. Four novel nanoadjuvants including Alum, liposome, DNA/RNA and virus sample particle.
6. Conclusion and perspectives
This review systematically describes the nanoadjuvant design for imaging: structural engineering (size/charge/surface control dictates APC targeting efficiency), functional synergy (contrast agents integrated with TLR agonists enable real-time imaging of DC migration), clinical translation (Mn2+-based biodegradable contrasts reduce hepatotoxicity by 67% vs. Gd3+ platforms). Notably, for emerging SARS-CoV-2 variants, nanoadjuvants offer rapid-response [27]: Lipid-saRNA nanoparticles (size: 80 nm, zeta potential: +15 mV) encapsulating Omicron BA.5 spike protein, integrating MnO2 contrast enables concurrent T-cell imaging and enhanced Th1 response. This reduced development timeline from 6 months to 14 days, critical for pandemic containment.
The convergence of nanotechnology and imaging advancements holds the potential to transform the field of vaccine adjuvant development. Through precision engineering of physicochemical properties, these innovations aim to enhance immune responses, safety, and effectiveness. The integration of imaging-driven adjuvant tracking further enhances the potential of therapeutic vaccines, including targeted immunotherapy and combination treatments. Beyond vaccine delivery, the modular design of nanoadjuvants shows translational potential in chronic disease management (e.g., targeted antimicrobial delivery) [18] and theranostic integration (e.g., imaging-guided immunomodulation) [111,112]. Future efforts should prioritize clinical translation of imaging-integrated nanovaccines, especially standardizing toxicity evaluation protocols for contrast-loaded adjuvants, developing multimodal tracking systems for real-time immune profiling, validating safety in large-animal models toward Phase I trials.
Declaration of competing interest
The authors declare that they have no known competing financial interests or personal relationships that could have appeared to influence the work reported in this paper.
CRediT authorship contribution statement
Fan Meng: Writing – original draft, Validation, Resources, Investigation, Formal analysis, Conceptualization. Yiqing Zhang: Writing – original draft, Visualization, Software, Investigation. Zhen Yuan: Supervision, Project administration. Zhangyong Hong: Supervision, Funding acquisition. Bin Yang: Writing – review & editing, Supervision, Conceptualization. Jian Zhang: Writing – review & editing, Supervision, Funding acquisition.
Acknowledgments
This work was supported by the National Key R&D Project of China (Nos. 2022YFC2304205, 2022YFC2304202), Key scientific research project of universities in Guangdong Province (No. 2023KCXTD026) and the Major Project of Guangzhou National Laboratory (No. GZNL2023A03002).
Supplementary materials
Supplementary material associated with this article can be found, in the online version, at doi:
10.1016/j.cclet.2025.111608 .
-
-
[1]
A.B. Arunachalam, Vaccines 12 (2024) 396. doi: 10.3390/vaccines12040396
-
[2]
M.A. Saleemi, Y. Zhang, G. Zhang, Pathogens 13 (2024) 441. doi: 10.3390/pathogens13060441
-
[3]
C. Aggarwal, V. Ramasamy, A. Garg, R. Shukla, N. Khanna, Front. Immunol. 14 (2023) 1128784. doi: 10.3389/fimmu.2023.1128784
-
[4]
A. Biram, N. Davidzohn, Z. Shulman, Immunol. Rev. 288 (2019) 37–48. doi: 10.1111/imr.12737
-
[5]
H. Miwa, O.Q. Antao, K.M. Kelly-Scumpia, et al., Adv. Sci. 10 (2023) e2302248. doi: 10.1002/advs.202302248
-
[6]
V. Mani, S.K. Bromley, T. Äijö, et al., Science 366 (2019) eaav5728. doi: 10.1126/science.aav5728
-
[7]
P. Spiliopoulou, P. Kaur, T. Hammett, G.D. Conza, M. Lahn. Cancer Drug Resist. 7 (2024) 2.
-
[8]
G.G. Manriquez, I. Tuero, Hum. Vaccin. Immunother. 17 (2021) 3539–3550. doi: 10.1080/21645515.2021.1934354
-
[9]
M. Yang, J. Zhou, L. Lu, et al., Exploration 4 (2024) 20230171. doi: 10.1002/EXP.20230171
-
[10]
H. Zhu, C. Yang, A. Yan, et al., View 4 (2023) 20220067. doi: 10.1002/VIW.20220067
-
[11]
Z. Huang, Q. Sun, H. Shi, et al., ChemPhysMater 2 (2023) 259–266. doi: 10.1016/j.chphma.2023.03.005
-
[12]
D. Laera, H. HogenEsch, D.T. O'Hagan, Pharmaceutics 15 (2023) 1884. doi: 10.3390/pharmaceutics15071884
-
[13]
E.J. Ko, S.M. Kang, Hum. Vaccin. Immunother. 14 (2018) 3041–3045. doi: 10.1080/21645515.2018.1495301
-
[14]
Y. Li, Y. Duan, Y. Li, et al., Exploration 5 (2025) 20230117.
-
[15]
Y. Xu, J. Chen, J. Ding, et al., Polym. Sci. Tech. 1 (2025) 171–220. doi: 10.1021/polymscitech.5c00010
-
[16]
Y. Cai, Y. Jiang, Y. Chen, et al., Chin. Chem. Lett. 36 (2025) 110437. doi: 10.1016/j.cclet.2024.110437
-
[17]
B. Nguyen, N.H. Tolia, NPJ Vaccines 6 (2021) 70. doi: 10.1038/s41541-021-00330-7
-
[18]
C. Xie, X. You, H. Zhang, et al., Adv. Sci. 10 (2023) e2300418. doi: 10.1002/advs.202300418
-
[19]
H. Zhang, X. You, X. Wang, et al., Proc. Natl. Acad. Sci. U. S. A. 118 (2021) e2005191118. doi: 10.1073/pnas.2005191118
-
[20]
M.H. Younis, Z. Tang, W. Cai, et al., Wiley Interdiscip. Rev. Nanomed. Nanobiotechnol. 14 (2022) e1807. doi: 10.1002/wnan.1807
-
[21]
Y. Guo, Z. Li, B. Guo, et al., Nano Biomed. Eng. 16 (2024) 135–151. doi: 10.26599/nbe.2024.9290061
-
[22]
J. Deng, G. Shi, Z. Ye, et al., Chin. Chem. Lett. 36 (2025) 110496. doi: 10.1016/j.cclet.2024.110496
-
[23]
D. Liu, W. Yang, B. Zhang. Nano Biomed. Eng. 17 (2025) 36–55. doi: 10.26599/nbe.2024.9290073
-
[24]
A. Thakur, F. Rose, S.R. Ansari, et al., Mol. Pharm. 16 (2019) 4725–4737. doi: 10.1021/acs.molpharmaceut.9b00908
-
[25]
L. Yang, P. Cai, L. Zhang, et al., J. Am. Chem. Soc. 143 (2021) 12129–12137. doi: 10.1021/jacs.1c03960
-
[26]
H. Wang, M. -Q. Pan, Y. -F. Wang, et al., Chin. Chem. Lett. 35 (2024) 109581. doi: 10.1016/j.cclet.2024.109581
-
[27]
C.B. Rodell, S.P. Arlauckas, M.F. Cuccarese, et al., Nat. Biomed. Eng. 2 (2018) 578–588. doi: 10.1038/s41551-018-0236-8
-
[28]
S.W.A. Shah, M. Shoaib, M. Ghias, et al., Surface engineered gold nanorods: intelligent delivery system for cancer therapy, in: M.R. Shah, M. Imran, S. Ullah (Eds.), Metal Nanoparticles for Drug Delivery and Diagnostic Applications, Elsevier, Amsterdam, 2020, pp. 85–98.
-
[29]
X. Xin, X. Ni, K. Shi, et al., Front. Bioeng. Biotechnol. 10 (2022) 915067.
-
[30]
G. Erdos, S.C. Balmert, C.D. Carey, et al., J. Invest. Dermatol. 140 (2020) 2528–2531.e2. doi: 10.1016/j.jid.2020.03.966
-
[31]
K.E. Lindsay, S.M. Bhosle, C. Zurla, et al., Nat. Biomed. Eng. 3 (2019) 371–380. doi: 10.1038/s41551-019-0378-3
-
[32]
S.V. Hartimath, B. Ramasamy, T.Y. Xuan, et al., Pharmaceutics 14 (2022) 150. doi: 10.3390/pharmaceutics14010150
-
[33]
T. Ertveldt, S. Meulewaeter, Y. De Vlaeminck, et al., Theranostics 13 (2023) 5483–5500. doi: 10.7150/thno.85106
-
[34]
D. Huang, T. Wu, S. Lan, et al., Biomaterials 289 (2022) 121808. doi: 10.1016/j.biomaterials.2022.121808
-
[35]
B.H. Lee, R. Gonzalez-Rodriguez, A. Valimukhametova, et al., ACS Appl. Nano Mater. 6 (2023) 17512–17520. doi: 10.1021/acsanm.3c02650
-
[36]
W. Huang, S. Shi, Y. Jiang, et al., ACS Nano 17 (2023) 15590–15604. doi: 10.1021/acsnano.3c02309
-
[37]
Z.S. Stillman, G.E. Decker, M.R. Dworzak, E.D. Bloch, C.A. Fromen, J. Nanobiotechnol. 21 (2023) 39. doi: 10.1186/s12951-023-01782-w
-
[38]
A. Thakur, C. Rodríguez-Rodríguez, K. Saatchi, et al., Front. Immunol. 9 (2018) 2825. doi: 10.3389/fimmu.2018.02825
-
[39]
I.S. Alam, A.T. Mayer, I. Sagiv-Barfi, et al., J. Clin. Invest. 128 (2018) 2569–2580. doi: 10.1172/jci98509
-
[40]
J.T. Martin, B.L. Hartwell, S.C. Kumarapperuma, et al., Biomaterials 275 (2021) 120868. doi: 10.1016/j.biomaterials.2021.120868
-
[41]
P.P. Lopes, G. Todorov, T.T. Pham, et al., J. Virol. 92 (2018) e02156-17.
-
[42]
W. Poon, B.R. Kingston, B. Ouyang, W. Ngo, W.C.W. Chan, Nat. Nanotechnol. 15 (2020) 819–829. doi: 10.1038/s41565-020-0759-5
-
[43]
H.K. Dewangan, S. Singh, R. Mishra, R.K. Dubey, Int. J. Appl. Pharm. 12 (2020) 24–33. doi: 10.22159/ijap.2020v12i4.36856
-
[44]
M. Prasad, L. Buragohain, M. Ghosh, R. Kumar, Nanotechnology in Cancer Diagnosis and Therapy, Handbook of Oxidative Stress in Cancer: Therapeutic Aspects, Springer Nature, Berlin, 2022, pp. 1–24.
-
[45]
E. Cheng, Y. Li, W. Yuan, et al., Chin. Chem. Lett. 35 (2024) 109386. doi: 10.1016/j.cclet.2023.109386
-
[46]
L. Zichao, L. Ping, D. Jizhe, et al., J. Control. Rel. 170 (2013) 259–267. doi: 10.1016/j.jconrel.2013.05.027
-
[47]
C. Liu, X. Liu, X. Xiang, et al., Nat. Nanotechnol. 17 (2022) 531–540. doi: 10.1038/s41565-022-01098-0
-
[48]
H. Jiang, Q. Wang, L. Li, et al., Adv. Sci. 5 (2018) 1700426. doi: 10.1002/advs.201700426
-
[49]
Z. Eva, C. Caterina, P. Maria, et al., J. Control. Rel. 258 (2017) 182–195.
-
[50]
L. Jiao, J.Y.R. Seow, W.S. Skinner, Z.U. Wang, H.L. Jiang, Mater. Today Chem. 27 (2019) 43–68. doi: 10.1016/j.mattod.2018.10.038
-
[51]
Y. Pan, J. Han, G. Wang, et al., Chem. Eng. J. 507 (2025) 160128. doi: 10.1016/j.cej.2025.160128
-
[52]
X. Xiong, J. Zhao, R. Su, et al., Nano Today 39 (2021) 101225. doi: 10.1016/j.nantod.2021.101225
-
[53]
W.A. Weber, J. Czernin, C.J. Anderson, et al., J. Nucl. Med. 61 (2020) 263s–272s. doi: 10.2967/jnumed.120.254532
-
[54]
C. Zhang, B. Nan, J. Xu, et al., Nat. Biomed. Eng. 9 (2025) 671–685.
-
[55]
T. Tamura, A. Fujisawa, M. Tsuchiya, Nat. Chem. Biol. 16 (2020) 1361–1367. doi: 10.1038/s41589-020-00651-z
-
[56]
F. Paquet, M.R. Bailey, R.W. Leggett, et al., Ann. ICRP 46 (2017) 1–486. doi: 10.1177/0146645317734963
-
[57]
L. Wang, Y. Zhao, B. Zheng, et al., Sci. Adv. 9 (2023) eadg8600. doi: 10.1126/sciadv.adg8600
-
[58]
M.H. Pablico-Lansigan, S.F. Situ, A.C.S. Samia, Nanoscale 5 (2013) 4040–4055. doi: 10.1039/c3nr00544e
-
[59]
Y. Wang, S. Lin, H. Jiang, et al., CCS Chem. 4 (2022) 1238–1250. doi: 10.31635/ccschem.021.202000670
-
[60]
Q. Yin, W. Luo, V. Mallajosyula, et al., Nat. Mater. 22 (2023) 380–390.
-
[61]
R. Liang, J. Xie, J. Li, et al., Biomaterials 149 (2017) 41–50. doi: 10.1016/j.biomaterials.2017.09.029
-
[62]
Z. Fan, H. Liu, Y. Xue, et al., Bioact. Mater. 6 (2021) 312–325.
-
[63]
M. Wang, B. Zhou, L. Wang, et al., J. Mater. Chem. B 8 (2020) 8261–8270. doi: 10.1039/d0tb01453b
-
[64]
J.H. Han, Y.Y. Lee, H.E. Shin, et al., Biomaterials 289 (2022) 121762.
-
[65]
Q. Chen, L. Zhang, L. Li, et al., J. Nanobiotechnol. 19 (2021) 449.
-
[66]
C. Bai, J. He, H. Niu, et al., Tuberculosis 110 (2018) 104–111.
-
[67]
F. Ren, F. Wang, A. Baghdasaryan, et al., Nat. Biomed. Eng. 8 (2024) 726–39.
-
[68]
L.N. Gales, S. Brotea-Mosoiu, O.G. Trifanescu, A.M. Lazar, M. Gherghe, Diagnostics 12 (2022) 2163. doi: 10.3390/diagnostics12092163
-
[69]
M. Nayrac, M. Dubé, G. Sannier, et al., Cell Rep. 39 (2022) 111013.
-
[70]
X. Han, M.G. Alameh, K. Butowska, et al., Nat. Nanotechnol. 18 (2023) 1105–1114.
-
[71]
R. Cau, C. Mantini, L. Monti, et al., Insights Imaging 13 (2022) 44.
-
[72]
M.G. Friedrich, F. Marcotte, Circ. Cardiovasc. Imaging 6 (2013) 833–839.
-
[73]
T. Savary, M. Fieux, M. Douplat, et al., JAMA Netw. Open 6 (2023) e239158. doi: 10.1001/jamanetworkopen.2023.9158
-
[74]
M. Sartelli, F.A. Moore, L. Ansaloni, et al., World J. Emerg. Surg. 10 (2015) 3.
-
[75]
G. Gunes, P. Crivellaro, D. Muradali, Indian J. Radiol. 32 (2022) 197–204.
-
[76]
C. Giacuzzo, C.M. Eandi, A. Kawasaki, Acta Ophthalmol. 100 (2022) e611–e612.
-
[77]
Y. Wang, W. Li, B. Lin, et al., Biomater. Sci. 11 (2023) 5177–5185. doi: 10.1039/d3bm00700f
-
[78]
M. Olivo, R. Bhuvaneswari, S.S. Lucky, N. Dendukuri, P. Soo-Ping Thong, Pharmaceuticals 3 (2010) 1507–1529. doi: 10.3390/ph3051507
-
[79]
L.A. Dawson, M.B. Sharpe, Lancet Oncol. 7 (2006) 848–858.
-
[80]
M.J. Gorbet, A. Ranjan, Pharmacol. Ther. 207 (2020) 107456.
-
[81]
Y. Dai, X. Li, Y. Xue, et al., Acta Biomater. 166 (2023) 496–511.
-
[82]
Q. Xiang, C. Yang, Y. Luo, et al., Small 18 (2022) e2107809.
-
[83]
Z.B. Wang, J. Xu, Vaccines 8 (2020) 128.
-
[84]
Z. Win, J. Weiner Rd, A. Listanco, et al., Front. Immunol. 11 (2020) 613496.
-
[85]
H. HogenEsch, Front. Immunol. 3 (2013) 406.
-
[86]
A. Raponi, J.M. Brewer, P. Garside, D. Laera, Semin. Immunol. 56 (2021) 101544.
-
[87]
Z. Liang, H. Zhu, X. Wang, et al., Front. Immunol. 11 (2020) 589833.
-
[88]
M.B. Laurens, Hum. Vaccin. Immunother. 16 (2019) 480–489.
-
[89]
A.M. Didierlaurent, B. Laupèze, A. Di Pasquale, et al., Expert Rev. Vaccines 16 (2016) 55–63.
-
[90]
C. Pifferi, R. Fuentes, A. Fernández-Tejada, Nat. Rev. Chem. 5 (2021) 197–216. doi: 10.1038/s41570-020-00244-3
-
[91]
I. Rosenkrands, C. Vingsbo-Lundberg, T.J. Bundgaard, et al., Vaccine 29 (2011) 6283–6291.
-
[92]
D.S. Tretiakova, E.L. Vodovozova, Biochem. Mosc. Suppl. Ser. A: Memb. Cell Biol. 16 (2022) 1–20. doi: 10.1134/s1990747822020076
-
[93]
F. Ma, L. Yang, Z. Sun, et al., Sci. Adv. 6 (2020) eabb4429.
-
[94]
T. Sparwasser, R.M. Vabulas, B. Villmow, et al., Eur. J. Immunol. 30 (2000) 3591–3597.
-
[95]
A. Comberlato, K. Paloja, M.M.C. Bastings, J. Mat. Chem. B 7 (2019) 6321–6346. doi: 10.1039/c9tb01222b
-
[96]
M.A. Dobrovolskaia, Molecules 24 (2019) 4620. doi: 10.3390/molecules24244620
-
[97]
E. Buntinx, L. Brochado, C. Borja-Tabora, et al., Vaccine 41 (2023) 1875–1884.
-
[98]
J. Jo, D. Mills, A. Dentinger, et al., Sensors 23 (2023) 2789. doi: 10.3390/s23052789
-
[99]
G.T. Jennings, M.F. Bachmann, Biol. Chem. 389 (2008) 521–536. doi: 10.1515/bc.2008.064
-
[100]
M.O. Mohsen, A.C. Gomes, G. Cabral-Miranda, et al., J. Control. Rel. 251 (2017) 92–100.
-
[101]
F. Xue, J. Cornelissen, Q. Yuan, et al., Chin. Chem. Lett. 34 (2023) 107448.
-
[102]
S. Diebold, Adv. Drug Deliv. Rev. 60 (2008) 813–823.
-
[103]
M. Kheirvari, H. Liu, E. Tumban, Viruses 15 (2023) 1109. doi: 10.3390/v15051109
-
[104]
C. Qian, X. Liu, Q. Xu, et al., Vaccines 8 (2020) 139.
-
[105]
S. Shukla, J.T. Myers, S.E. Woods, et al., Biomaterials 121 (2017) 15–27.
-
[106]
S.H. Lee, K.B. Chu, M.J. Kim, et al., Pharmaceutics 15 (2023) 782. doi: 10.3390/pharmaceutics15030782
-
[107]
V. Manolova, A. Flace, M. Bauer, et al., Eur. J. Immunol. 38 (2008) 1404–1413. doi: 10.1002/eji.200737984
-
[108]
X. Zhang, Y. Chen, Y. Pan, et al., Chin. Chem. Lett. 35 (2024) 108378.
-
[109]
K.M. Frietze, D.S. Peabody, B. Chackerian, Curr. Opin. Virol. 18 (2016) 44–49.
-
[110]
F. Zabel, T. Kündig, M. Bachmann, Curr. Opin. Virol. 3 (2013) 357–362.
-
[111]
K. Chen, X. Wu, Q. Wang, et al., Chin. Chem. Lett. 34 (2023) 107446.
-
[112]
Y.H. Chung, D. Church, E.C. Koellhoffer, et al., Nat. Rev. Mater. 7 (2022) 372–388.
-
[1]
-
Figure 2 Antigen presentation process of adjuvants. (A) Essential uptake pathways of antigens (e.g., endocytosis and phagocytosis) by APCs induce immune responses. (B) Schematic of how APN—CpG activates DCs and macrophages in LNs. C57BL/6 mice were injected in the footpad with 25 µL of the indicated formulations, and popliteal LNs were isolated for analysis at the indicated time points. (C) Representative confocal laser scanning images showing BMDCs cultured for different periods with FITC-APN (green); lysosomes were stained with LysoTracker Red (red). Nonoverlapping green and red signals indicate lysosomal escape of APN (white arrow). Scale bar: 5 µm. Reproduced with permission [48]. Copyright 2017, John Wiley and Sons.
Figure 3 Imaging to track the migration of adjuvants. (A) Immunization timeline for PET and MR imaging studies. (B) Maximum intensity projections (MIPs) of representative in vivo PET scans at 24 h showing the 64Cu-DOTA-MD39-NP signal. "X" denotes the injection site, and red asterisks indicate fiducial markers. (C) Pseudocolor images of the boxed areas are shown in (B), highlighting drainage to the iliac and inguinal LNs. Copied with permission [40]. Copyright 2021, Elsevier.
Figure 4 Different imaging techniques monitor the adjuvant-induced recruitment of immune cells. (A) Relationships of different imaging strategies with adjuvant-generated immunotherapy. (B) Time series of the tumor NIR FI in situ. Reproduced with permission [62]. Copyright 2021, Elsevier. (C) Axial and coronal CT images of 4T1 tumor-bearing mice after intratumoral injection of PBS or INA. The red circles indicate the locations of the tumors. (D) 3D reconstruction images from CT images of 4T1 tumor-bearing mice after intratumoral injection of PBS or INA. Red arrows indicate the location of the tumors. (C, D) Reproduced with permission [29]. Copyright 2022, Frontiers. (E) In vivo PA images of tumors. (F) T1-weighted MR images of tumors. (E, F) Reproduced with permission [65]. Copyright 2021, Springer Nature.
Figure 5 Immunization intervals for imaging tracer adjuvants. (A) Immunization and imaging schedule. (B) Schematics of a QD functionalized with a P3 coating and conjugated to a biotinylated H-2Kb chicken ova 257–264 SIINFEKL to form a QD-OVA-tetramer (left) and ErNP functionalized with a P3 coating and conjugated to a CD8 diabody (right). (C) Representative wide-field NIR-IIb molecular images from one of three mice bearing E.G-7 tumors immunized with pErNP-OVA-CpG B, recorded 48 h after i.v. Reproduced with permission [67]. Copyright 2023, Springer Nature. (D) A 48-year-old male patient was diagnosed with pT3b pN0, malignant melanoma, and a follow-up scan was performed. Image (a) shows the maximum intensity projection of the patient's scan. Images (b, c) show metabolically active axillary LNs, on the same side as the mRNA vaccine, taken one week before the PET-CT examination, raising the suspicion of disease progression (marked with an arrow). Reproduced with permission [68]. Copyright 2022, Multidisciplinary Digital Publishing Institute (MDPI).
Figure 6 Adverse reactions following vaccination. Cardiovascular complications reproduced with permission [72]. Copyright 2013, Wolters Kluwer Health, Inc. Neurological complications reproduced with permission [73]. Copyright 2021, Cureus. Vascular complications reproduced with permission [71]. Copyright 2022, Springer Nature. Abdominal complications reproduced with permission [74]. Copyright 2015, Springer Nature. Lymphadenopathy reproduced with permission [75]. Copyright 2022, Elsevier. Skin complications and eye side effects reproduced with permission [76]. Copyright 2022, Wiley.
Figure 7 Five imaging combination therapies (treatment mechanism diagram on the left; standard imaging methods on the right).
Figure 8 Four novel nanoadjuvants including Alum, liposome, DNA/RNA and virus sample particle.
Table 1. Structure, assembly and function of the nanoadjuvant-contrast agent complex.
Material Contrast agent Nanoadjuvant Imaging Structure Assembly method Function Ref. Organic molecular materials Gd CAF01 MRI Liposome Film method Vaccine [24] Iodine R837 CT Sphere Self-assembly Tumor [29] Alexa488 Poly(I: C) FI Nanofiber Self-assembly Chemical modification [30] MTRIPS; DOTA; 64Cu mRNA PET-CT – Self-assembly mRNA vaccine [31] Radioactive materials [18F]FDG CpG PET – – Tumor [32] 99mTc αGC SPECT/CT – – mRNA vaccine [33] Inorganic nanomaterials Au NPs CpG FI Biomimetic materials In situ reduction Tumor [34] GQDs Al FI/USI Zero-dimensional nanomaterial Chemical bond Imaging [35] Fe Mn2+ MRI 3D diamond Gas diffusion method Vaccine [36] Organic-inorganic hybrid materials FITC AI FI MOF Self-assembly Inhaled vaccine [37] 111In; 67Ga CAF01 SPECT/CT – Chemical modification Vaccine [38] Biomaterials 64Cu mAb PET – Self-assembly Vaccine [39] Other materials Copper chelator DOTA-NHS ester; Alexa Fluor 647 CpG PET/MRI – Solid-phase synthesis Vaccine [40] Nonablative diode laser and 5% imiquimod cream Imiquimod cream + laser Laser confocal and multiphoton microscopy techniques – Laser radiation Vaccine [41]  下载: 导出CSV
Table 2. Comparative analysis of imaging modalities for nanoadjuvant tracking.
Technique Resolution Sensitivity Depth Radiation risk Real-time capability Key limitation MRI 10–100 µm Low (µmol/L–mmol/L) Unlimited None Minutes Long acquisition (> 30 min) PET 1–2 mm High (pmol/L–nmol/L) Unlimited High Minutes Requires radiolabeling SPECT 1–2 mm Moderate (nmol/L) Unlimited Moderate Minutes Lower resolution than PET CT 50–200 µm Low (mmol/L) Unlimited Moderate Seconds Poor soft-tissue contrast Fluorescence Visible 1–5 µm Moderate (nmol/L) < 1 mm None Milliseconds Minimal tissue penetration NIR-Ⅰ 5–20 µm Moderate (nmol/L) 2–5 mm None Milliseconds Autofluorescence interference NIR-Ⅱ 20–50 µm High (pmol/L) 5–20 mm None Milliseconds Quantitative accuracy challenges Ultrasound 50–500 µm Low (mg/mL) 5–20 cm None Milliseconds Requires microbubble contrast agents
下载: 导出CSV
-


 扫一扫看文章
计量
- PDF下载量: 0
- 文章访问数: 12
- HTML全文浏览量: 1
