Received Date:
23 April 2025 Accepted Date:
25 June 2025 Revised Date:
20 June 2025 Available Online:
15 February 2026
Abstract:
One-dimensional (1D) organic-inorganic halide perovskites have produced significant research interest due to their unique structure and superior tunable luminescence properties. Here, we successfully achieved a unique color-tunable phenomenon of Mn-doped 1D post-perovskite (TDMP)PbBr4 (TDMP = trans-2,5-dimethylpiperazine) (TPBM-14) under high pressure. Which exhibited tunable photoluminescence (PL) emission from red to yellow orange. Meanwhile, the band gap continued to decrease below 20.0 GPa, accompanied by piezochromism, which was associated the shrinkage and distortion of inorganic, which enhances the crystal field splitting energy and reduces the energy gap of the 4T1 to 6A1 transition. The unique octahedral corner- and edge-sharing structure of (TDMP)PbBr4, the synergistic effect of Mn doping and pressure induces local lattice distortion in TPBM-14, leading to a significant enhancement of the STE emission at 8.1 GPa. Our research explores the intrinsic connection between the band structure and optical properties of TPBM-14 under high pressure and offers valuable insights for performance optimization.
1D organic-inorganic lead (Pb) halide perovskites exhibit unique optical properties, such as high luminescence quantum efficiency, large absorption coefficient, and wide tunable range of luminescence colors, demonstrating remarkable performance in photoelectric field [1-6]. The toxicity and instability of Pb have greatly stimulated research in modifying the existing perovskite materials [7-9]. Among the array of modulation approaches, metal ion doping has emerged as an effective approach for tailoring chemical composition and tuning optoelectronic characteristics by exciton-dopant coupling. This strategy affords a variety of opportunities for endowing metal halide perovskites (MHPs) with new optical, electronic and magnetic properties, enabling the development of multifunctional materials [10-15]. To date, a variety of metal ions have been intentionally incorporated into MHPs frameworks [16-18]. Notably, Mn2+ exhibit considerable promise owing to their high luminous efficiency and non-toxic characteristics. Within Mn2+-doped perovskite systems, the intense exchange interaction among charge carriers enables Mn2+ d electrons to mediate efficient energy transfer pathways. This mechanism overcomes the parity-forbidden nature of the 4T1 to 6A1 electronic transition within the octahedral crystal field, ultimately generating prominent red-light emission with high color purity [19-21]. Furthermore, the integration of intrinsic narrow emission and broad dopant emission enhances opportunities for diversifying the luminescent properties of perovskite. Thus, it is pivotal for exploring the relationship of structure and optical properties for Mn2+-doped perovskite.
Pressure, is an effective device for probing the electronic and structural profiles of MHPs. It enables the compression of crystal lattices, leading to tighter atomic packing and reduced interatomic distances, which effectively alters electron orbitals and bonding configurations [22-27]. In the recent period, high-pressure studies on MHPs have garnered increasing attention. Systematic investigations into the behavior of MHPs under pressure have provided valuable insights into the structure-property relationship [28-36]. Several novel properties have been identified, such as enhanced structural stability, pressure-induced emission (PIE), pressure-induced emission enhancement (PIEE), and metallization effects [37-44]. In addition, Cao et al. reported pressure-induced emission enchantment for Mn2+-doped CsPbCl3 (3D) nanocrystals (NCs) at a specific pressure threshold of 1.41 GPa [45]. Shi et al. demonstrated the manipulation of optical properties within Mn2+-doped 2D (PEA)2PbBr4 (PEA+ = C6H5C2H4NH3+) NCs, achieving a continuous narrowing of the bandgap and significant piezochromism [46]. Zhang et al. realized an extensive reduction in the bandgap by up to 12.2% through compression-decompression cycles in Mn-doped Cs2NaBiCl6, with the Mn2+ emission being markedly augmented under pressure [47]. These findings indicate that the synergistic effect of Mn2+ doping and pressure can effectively modulate the optical properties. It is necessity for further research into the structural and optical properties of Mn2+-doped 1D MHPs under high pressure.
Here, we systematically investigated the structural evolution and optical properties of TPBM-14 under high pressure. This finding reveals that the compound exhibits reversible pressure-induced emission tuning, transitioning from red to yellow-orange emissions accompanied by pressure-induced emission quenching. A series of in situ high-pressure experiments were regulated to examine the structural evolution and luminescence mechanism associated with Mn2+ doping under high pressure. This work offers valuable insights into the relationship between emission behavior and structure in 1D perovskites following Mn doping, and provides a new thought for designing new perovskites with excellent optoelectronic properties.
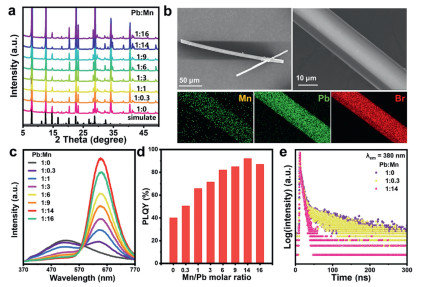
The (TDMP)PbBr4 and Mn-doped (TDMP)PbBr4 with varying doping ratios were prepared by cooling-crystallization. The XRD diffraction peaks of all samples were in agreement with the previously reports (Fig. 1a), confirming that Mn2+-doped (TDMP)PbBr4 was successfully prepared without any impurity phase [48-50]. As the concentration of Mn2+ increased, the diffraction peaks shifted systematically toward lower angles, which could be attributed to the stronger complexation affinity of Mn2+ with diamine ligands compared to Pb2+. The Mn2+ preferentially interact with amine groups in organic molecules, subsequently occupying interstitial sites within the organic layers. This substitution-induced lattice expansion ultimately leads to a slight enlargement of the crystal lattice. The morphological characterization of the synthesized samples was shown in Fig. 1b and Fig. S1 (Supporting information). TDMP-14 (the Pb: Mn ratio is 1:14) exhibits rod-like structures with length exceeding several hundred micrometers and diameters of approximately 10 µm. Elemental mapping reveals homogeneous distribution of Pb, Br, and Mn elements throughout the Mn2+-doped (TDMP)PbBr4. PL performance testing of both pristine and doped samples (Fig. 1c) demonstrates that (TDMP)PbBr4 displayed broad white emission, including the FE state (at 380 nm) and STE state (at 510 nm), respectively. Previous research demonstrated the STE emission was fundamentally related to Jahn-Teller distortion within the octahedral lattice [49,50]. After doping with Mn2+, three PL peaks emerge: FE, STE and an additional broad peak at 640 nm attributed to the ligand-field transition (4T1 to 6A1) of Mn2+, consistent with previous reports [49]. Notably, when the Pb: Mn ratio reaches 1:14, the emission intensity maximizes at 640 nm with a photoluminescence quantum yield (PLQY) of 92% (Fig. 1d).
Figure 1
Figure 1.
(a) The XRD pattern and simulated diffraction pattern of (TDMP)PbBr4 with different Mn doping ratios. (b) SEM images and corresponding element mappings of Pb, Br in TDMP-14 microrods. (c) The PL spectra and (d) PLQY of (TDMP)PbBr4 with different Mn2+ doping ratios. (e) PL decay lifetime curves at 640 nm.
To demonstrate that Mn-doped (TDMP)PbBr4 possesses multiple emission centers and to explore the luminescence mechanism after Mn2+-doped, we performed time-resolved photoluminescence measurements on it. Fig. 1e and Fig. S2 (Supporting information) display the PL decay lifetime curves at 380, 510, and 640 nm. For the emissions from free excitons FE and STE, their lifetimes are only on the nanosecond scale and gradually decrease upon increasing Mn2+ doping ratio. Which is due to Mn2+-doped provides additional energy transfer pathways for FEs. After Mn2+-doped, the lifetime extends to the millisecond scale and remains unchanged with varying doping concentrations, which is consistent with reports on Mn-doped perovskites and other materials [51-53].
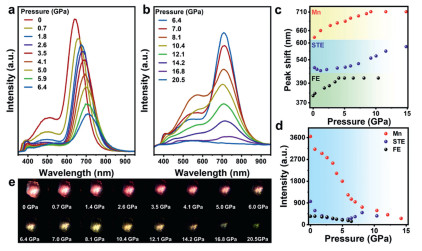
To check into the optical properties of Mn-doped (TDMP)PbBr4, we implemented in situ high-pressure PL measurements on TPBM-14 (Figs. 2a and b). With pressure increases, all three PL peaks exhibit noticeable red shifts, accompanied by a broadening of full width at half-maximum (FWHM). Specifically, Mn2+-related emission peak red-shifts significantly from 640 nm to 710 nm as the pressure reaches 6.4 GPa. Upon pressure reaches to 20.5 GPa, the PL peak continues to red-shift to 735 nm (Fig. 2c). Moreover, the PL intensities of all three peaks gradually decrease and vanish completely at 6.4 GPa (Fig. 2d). Surprisingly, the STE emission intensity exhibits a sudden increase at 8.1 GPa, followed by a decrease and eventual quenching at 20.5 GPa. In addition, due to its unique post-perovskite chains composed of octahedra with shared corners and edges and the inherent spatial effects that limit the distortion of the octahedra, Mn-doped (TDMP)PbBr4 exhibited significant differences in optical properties compared to Mn-doped 2D perovskite (PEA)2PbBr4 nanocrystals (NCs) (4.4 GPa) [46] and Mn-doped 3D perovskite CsPbBr3 NCs (5.8 GPa) [43]. As pressure is increased, the color transitions of PL from bright red to dark red which can be clearly observed in PL micrographs and intensity of PL peaks (Fig. 2e). Above 6.4 GPa, the PL color shifts to yellow and eventually faded away at 20.5 GPa, aligning with the color transition observed in (TDMP)PbBr4 between 4.0 GPa and 20.0 GPa (Fig. S4 in Supporting information) [48]. Meanwhile, in situ high-pressure PL measurements of samples with varying ratios show red-shifting of all PL peaks under pressure, as further evidenced by the fluorescence images (Fig. S5 in Supporting information). Compared to the color change of (TDMP)PbBr4, the lattice expansion caused by Mn2+ doping for initial structure requires higher pressure. These results demonstrate that both TPBM-14 and (TDMP)PbBr4 exhibit significantly pressure-tunable emission behaviors. In addition, following decompression, the PL spectra recovered their original shape and position; however, the intensity remained slightly lower than that at ambient pressure (Fig. S6 in Supporting information).
Figure 2
Figure 2.
(a, b) The pressure-dependent PL spectra of TPBM-14 microrods from 0 to 20.5 GPa. (c) The PL peaks shift of TPBM-14 microrods from 0 to 14.2 GPa. (d) Pressure-induced evolution of PL micrographs. (e) The intensity of all PL peaks under compression.
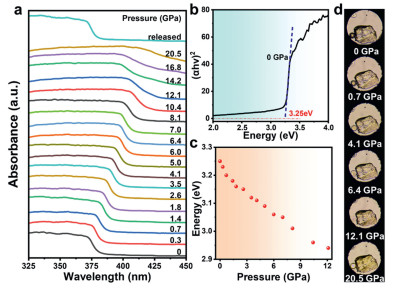
In addition, the modulation of the band gap can visually reflect the variations in optical properties of metal halide perovskites under high pressure. To further investigate the evolution of TPBM-14 optical properties, we performed in situ high-pressure absorption spectrum experiments ranging from ambient conditions to 20.5 GPa. The absorption spectra are illustrated in Fig. 3a with pressure as the independent variable, revealing a significant regularity in their evolution with increasing pressure. In usual atmospheric pressure, the absorption edge of TPBM-14 is located at 375 nm, and no significant change is observed after doping, which is in accordance with previous findings [49]. The bandgap value is determined to be 3.25 eV (Fig. 3b) calculated by extrapolating the linear region of (αhυ)2versus hυ in Tauc plots, where α is the absorption coefficient and hυ is the photon energy. As the pressure increases, the absorption edge exhibits a continuous redshift, consistent in the redshift observed in all three PL peaks. In addition, this trend is similar with the absorption edge evolution observed in (TDMP)PbBr4 (Fig. S7 in Supporting information) [48]. When the pressure reaches 20.5 GPa, the bandgap value of TPBM-14 decreases from 3.25 eV to 2.76 eV (Fig. 3c). A sharp decline in the bandgap was observed above 12.1 GPa, which was consistent with the pressure point at which PL begin to quench. It is attributed to lattice contraction under high pressure and potential structural amorphization induced by extreme compression. Upon completely release of pressure, the absorption spectra of pressure-treated TDMP-14 displayed a subtle deviation from its original state. Furthermore, optical micrographs recorded under high pressure (Fig. 3d) demonstrate a distinct color evolution of TDMP-14, transitioning from colorless to yellow. This observation highlights a remarkable piezochromic effect under compression.
Figure 3
Figure 3.
(a) The UV–vis absorption spectra of TPBM-14 at various pressures. (b) The bandgap Tauc plots for TPBM-14 at ambient conditions (0 GPa). (c) Bandgap evolution of TPBM-14 at various pressures. (d) The optical micrographs of TPBM-14 under different pressures.
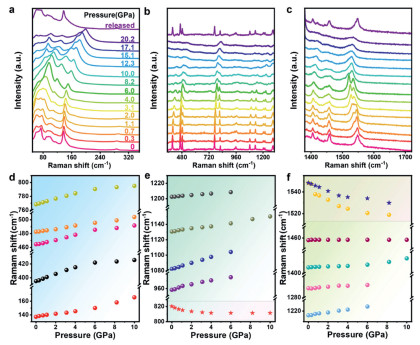
To further investigate the structural origin of optical properties changes, the in situ high-pressure Raman spectroscopy experiments on TPBM-14 was conducted (Figs. 4a-c). The low-frequency lattice vibrational modes (50–350 cm-1) correspond to Pb-Br and Mn-Br vibrational modes within the inorganic framework, characterized by ionic and covalent interactions. In contrast, the intramolecular vibrational modes of the organic constituents appeared in the higher frequency region (above 350 cm-1) [49,50]. With increasing pressure, the low-frequency lattice vibrational modes exhibit a normal blue-shift, reflecting progressive inorganic lattice contraction. Meanwhile, most vibrational modes of the organic moieties exhibit slightly blue shift to higher wavenumbers and unobvious adjusted intensity (Figs. 4d-f), which indicates that the degree of inorganic lattice distortion under pressure is greater than that of the organic cations. Additionally, the CH2/NH2 cyclic rocking mode at 820 cm-1 and the NH₂ rocking mode at 1549 cm-1 display anomalous red shift, which is attributed to the combination of motional constraints and deformation of the organic cations coupled with lattice compression. At approximately 8.2 GPa, vibrational modes exhibit obvious variations, indicating obvious local tilting and distortions in the inorganic sublattices. This observation provides further insight into the enhanced STE emission detected at this pressure threshold, which is ascribed to the strengthened phonon-electron coupling induced by pressure-driven lattice distortions. When the pressure reaches 12.3 GPa, the disappearance of specific Raman peaks combined with broadening and weakening of other vibrational modes suggest the partial disordering within both the inorganic and organic components. The Raman experiments support the proposed PL emission quenching and absorption edge broadening that TPBM-14 begins to amorphized after 12.0 GPa. When the pressure is fully released, the amorphous characteristics reflected in the Raman signals revert to their original state, aligning with the changes detected in the PL and absorption spectra.
Figure 4
Figure 4.
(a-c) Typical Raman spectra of TPBM-14 microrods from 0 to 20.2 GPa. (d-f) The Raman shift of TPBM-14 microrods under high pressure.
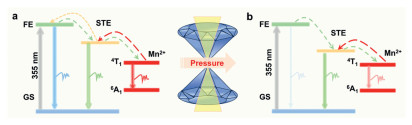
Based on the above experimental analysis, the photophysical process of TPBM-14 is shown in Fig. 5. Under environmental conditions, the 4T1 to 6A1 transition of Mn2+ creates a new emission channel at 640 nm in (TDMP)PbBr4, resulting in red emission for TPBM-14. Under UV excitation, the TPBM-14 is initially excited to the FE state, followed by relaxation to the STE state and the d-d transition of Mn, the latter of which can return to the FE state via radiative recombination (Fig. 5a). After compression, the intensity of all PL peaks decreases, accompanied by a significant redshift in PL peak positions, due to lattice contraction caused by pressure, which increases the crystal field splitting energy and reduces the energy gap of 4T1 to 6A1 transition. Strong electron-phonon interactions also hinder d-d transition relaxation from FE to Mn pair configurations. The redshift observed in absorption spectra further supports this result. Compared with Mn-doped 2D (PEA)2PbBr4 NCs and Mn-doped 3D CsPbBr3 NCs, the pressure point of PL emission tuning was hysteretic, resulting from the unique post-perovskite chains composed of octahedra with shared corners and edges and the inherent spatial effects [43,46]. Meanwhile, the struggle between interlayer contraction and lattice distortion drives moderate band-gap narrowing. Above 8.1 GPa, the abnormal enhancement of the STE emission can be attributed to the distortion and deformation of the inorganic lattice, which prevents the excitons in the STE state from being recaptured return to the state of FE (Fig. 5b), suggesting that enhanced phonon coupling obstructs the transition of excitons from the STE state back to their respective FE states.
Figure 5
Figure 5.
Schematic illustrations of emission evolution by configuration coordinate diagram upon compression. The term GS, FE and STE in the diagram represent Ground state, free exciton state, and self-trapped exciton state, respectively.
In summary, we systematically investigated the connection between the optical properties and structural evolution of Mn-doped 1D post-perovskite (TDMP)PbBr4 under high pressure. We successfully achieved the pressure-tunable emission from red to yellow, attributed to the compression of Mn-Br bond caused by octahedral contraction, which intensifies crystal field splitting and facilitates the 4T1 to 6A1 transition. In addition, due to its unique post-perovskite chains composed of octahedra with shared corners and edges and the inherent spatial effects, Mn2+-doped (TDMP)PbBr4 exhibited significant differences in optical properties compared to Mn-doped 2D (PEA)2PbBr4 NCs and 3D CsPbBr3 NCs. Simultaneously, the bandgap progressively diminished from an initial 3.25 eV to 2.76 eV, accompanied by a pronounced piezochromic effect. The Raman spectroscopy under high pressure further indicated that the optical properties changes are closely connected with the contraction and distortion of octahedra. Our study reveals the relationship between the structure and optical properties of Mn-doped 1D post-perovskites under high pressure, providing critical insights into the physical and chemical mechanisms of Mn-doped organic-inorganic MHPs systems under high pressure and further broadening their applications in optoelectronic.
Declaration of competing interest
The authors declare that they have no known competing financial interests or personal relationships that could have appeared to influence the work reported in this paper.
This work was supported by the National Natural Science Foundation of China (Nos. 12404024, 12474414, 12174144, 12474009), the Natural Science Foundation of Guangdong Province (Nos. 2023A1515012706, 2022A1515011669), the Cooperative education platform of Guangdong Province (No. (2016)31), the Open Project of State Key Laboratory of Superhard Materials, Jilin University (No. 202414), the Guangdong Basic and Applied Basic Research Foundation (No. 2020A1515110120), the Major Science and Technology Research and Development Project of Jiangxi Province (No. 20223AAE01003), Basic and Applied Basic Research Foundation of Jiangmen (No. 2020030102940008548), the Science Foundation for High-level Talents of Wuyi University (Nos. 2021AL019, 2019AL029).
Supplementary materials
Supplementary material associated with this article can be found, in the online version, at doi:10.1016/j.cclet.2025.111507.
[1]
X. Xu, X. Zhang, W. Deng, J. Jie, X. Zhang, Small Methods 2 (2018) 1700340. doi: 10.1002/smtd.201700340
Z. Wang, Y. Xiao, B. Liu, et al., Adv. Opt. Mater. 12 (2024) 2301796. doi: 10.1002/adom.202301796
Figure 1
(a) The XRD pattern and simulated diffraction pattern of (TDMP)PbBr4 with different Mn doping ratios. (b) SEM images and corresponding element mappings of Pb, Br in TDMP-14 microrods. (c) The PL spectra and (d) PLQY of (TDMP)PbBr4 with different Mn2+ doping ratios. (e) PL decay lifetime curves at 640 nm.
Figure 2
(a, b) The pressure-dependent PL spectra of TPBM-14 microrods from 0 to 20.5 GPa. (c) The PL peaks shift of TPBM-14 microrods from 0 to 14.2 GPa. (d) Pressure-induced evolution of PL micrographs. (e) The intensity of all PL peaks under compression.
Figure 3
(a) The UV–vis absorption spectra of TPBM-14 at various pressures. (b) The bandgap Tauc plots for TPBM-14 at ambient conditions (0 GPa). (c) Bandgap evolution of TPBM-14 at various pressures. (d) The optical micrographs of TPBM-14 under different pressures.
Figure 5
Schematic illustrations of emission evolution by configuration coordinate diagram upon compression. The term GS, FE and STE in the diagram represent Ground state, free exciton state, and self-trapped exciton state, respectively.

 DownLoad:

 下载:
下载:


