Orbital hybridization states of carbon assisted robust inorganic-rich solid electrolyte interphase towards high initial coulombic efficiency hard carbon anode
Citation:
Zeren Zhou, Yixiang Zhang, Qixian Zhang, Qiaoyan Lin, Yong Shuai, Zhijiang Wang, Lishuang Fan. Orbital hybridization states of carbon assisted robust inorganic-rich solid electrolyte interphase towards high initial coulombic efficiency hard carbon anode[J]. Chinese Chemical Letters,
2026, 37(2): 111506.
doi:
10.1016/j.cclet.2025.111506
Orbital hybridization states of carbon assisted robust inorganic-rich solid electrolyte interphase towards high initial coulombic efficiency hard carbon anode
English
Orbital hybridization states of carbon assisted robust inorganic-rich solid electrolyte interphase towards high initial coulombic efficiency hard carbon anode
MIIT Key Laboratory of Critical Materials Technology for New Energy Conversion and Storage, School of Chemistry and Chemical Engineering, Harbin Institute of Technology, Harbin 150001, China
b.
School of Materials Science and Engineering, Shanghai University, Shanghai 200444, China
c.
School of Energy Science and Engineering, Harbin Institute of Technology, Harbin 150001, China
Received Date:
06 May 2025 Accepted Date:
25 June 2025 Revised Date:
18 June 2025 Available Online:
15 February 2026
Abstract:
Hard carbon is a vital anode material for sodium-ion batteries; however, the nonuniform growth of solid electrolyte interphase (SEI) film substantially diminishes its initial coulombic efficiency (ICE) and cycle life. The chemical and morphological properties of surface highly influence the electrode/electrolyte interfacial reactions. In this study, we have tuned orbital hybridization states forming an interface enriched with sp2 hybridized carbon (sp2–C), which decreases the binding energy to solvent molecules and inhibits excessive solvent decomposition during SEI formation. Benefiting from successfully constructed inorganic-rich SEI, the ICE increased to 91% and sodium storage capacity reached 346 mAh/g. Besides, the capacity retention rate was 90.7% after 700 cycles at 1 A/g higher than pristine electrode (83.8%).
Sodium-ion batteries (SIBs) are considered the most promising large-scale energy storage technology, attributed to their abundant resources and low cost [1,2]. Hard carbon (HC) with low-cost and high-performance has been widely used as anodes materials [3,4]. However, HC still suffers from low initial Coulombic efficiency (ICE) and poor cycling stability, which are crucial for practical application [5-7]. Simply tuning the structure of HC anodes is insufficient to enhance their performance [8-10]. Notably, optimizing electrode/electrolyte interface via constructing appropriate SEI is effective to improve HC performance [11,12].
Many studies have demonstrated that SEI has a significant impact on electrode performance [13,14]. During the SEI formation process, organic and inorganic components are generated. The organic SEI is relatively thick and uneven, which is broken and reconstructed during cycling process with SEI thickness increasing [15,16]. In situ interfacial characterization techniques revealed that the organic-dominated structure of the solid electrolyte interphase (SEI) leads to inferior mechanical strength. Furthermore, the dissolution of organic species causes the embedded inorganic components to lose structural support and subsequently detach, ultimately compromising the structural integrity of the entire SEI and rendering it unstable within the electrolyte environment [17]. Thereby sodium ion transporting rate and cycling life decreases a lot. Constructed inorganic rich SEI can effectively improve the sodium storage performance and cycling stability of HC [18,19].
The composition and structure of SEI are often regulated by adjusting electrolyte components (such as high concentration electrolyte [20], localized high-concentration electrolytes [21]), however, the crucial role of electrode materials in SEI formation is neglected. The SEI composition can also be regulated by tuning intrinsic properties of material [22,23] and electronic properties of anodes [24], which were linked with SEI composition [25]. Gong et al. reported an anion-reduction-catalysis strategy to obtain a inorganic rich SEI through coating tellurium nanosheets [26]. Nonetheless, it is still very sticky to precisely regulate and achieve the targeted SEI in hard carbon.
Herein, we have designed a sp2 hybridized carbon rich (sp2–C) interface to suppress excessive adsorption and decomposition of solvents during the formation of SEI, thereby, inorganic-rich SEI is obtained successfully. The sp2–C delivers a low adsorption energy to solvent molecules forming anion rich interface structure. Consequently, the optimized anodes exhibit excellent performance with a high ICE of 91% and favorable sodium storage capacity of 346 mAh/g. The reaction kinetics and SEI structure are also illustrated carefully to understand the electrochemical processes.
The hard carbon (BHC) was purchased from Best Carbon Co., Ltd. Pitch powder was dissolved in an N-methylpyrrolidone (NMP) solvent to prepare a 2 wt% solution. Subsequently, the hard carbon was mixed with varying masses of the pitch solution. After drying and carbonization, a surface-rich sp2 carbon product (PHC) was obtained. Fig. 1a illustrates the influence of orbital hybridization on distribution of solvent molecules and anions at interface. The sp2/sp3 carbon with abundant defects exhibits higher adsorption energy toward solvent molecules, leading to a greater concentration of solvent molecules at interface. More solvent decomposition forms an SEI film with a high organic content. In contrast, sp2-rich carbon demonstrates weaker adsorption energy to solvent molecules, resulting in predominant anion accumulation at the interface, which corresponds to an SEI film characterized by elevated inorganic content. The formation of a thin and uniform inorganic-rich SEI film significantly enhances the interfacial stability of hard carbon anodes, thereby achieving superior initial coulombic efficiency and long-term cycling stability.
Figure 1
Figure 1.
(a) Diagram of orbital hybridization states formation SEI. (b) Raman spectra of samples. XPS results of (c) BHC and (d) PHC. (e) Nitrogen adsorption-desorption isotherms. (f) Adsorption energy between Na+-G2 group and carbon layer. Contact angle results of electrolyte on (g) BHC and (h) PHC.
The Raman spectra of different samples are presented in Fig. 1b and Fig. S1a (Supporting information). The G band corresponds to in-plane stretching vibration mode of carbon bonds, which is associated with graphitization degree [27,28], while D band originates from disorder-induced boundary vibration modes in hexagonal Brillouin zone and serves as an indicator of defects [29]. The calculated intensity ratio AG/AD of based hard carbon (BHC) is 0.376, whereas pitch coated hard carbon (PHC) exhibits an increased value of 0.52, suggesting a higher content of surface sp2 hybridized carbon. Further analysis via X-ray photoelectron spectroscopy (XPS) elucidates surface chemical states of hard carbon. Deconvolution results (Figs. 1c and d) confirm a marked increase in sp2 hybridized carbon content and a decrease in sp3 hybridized carbon on the surface of PHC. While BHC exhibits more sp3–C because of surface defects and irregular arrangement of carbon. The peak deconvolution results of O 1s XPS spectra for BHC and PHC samples are shown in Figs. S1b and c (Supporting information). Quantitative analysis reveals that the C=O peak area in PHC (4.75%) is lower than that in BHC (6.69%), while the C–O–C content increases from 52.37% (BHC) to 55.47% (PHC). These results indicate a reduction of C=O groups and an increase in C–O–C content on the PHC surface, which could weaken the adsorption of electrolyte solvent molecules and thereby enhance the ICE. Nitrogen adsorption-desorption isotherms (Fig. 1e) reveal a specific surface area of 8.845 m2/g for BHC, which decreases to 2.948 m2/g for PHC because of less exposed micropores. The corresponding pore size distribution curves (Fig. S1d in Supporting information) demonstrate a significant reduction in larger open pores within PHC, effectively suppressing irreversible electrolyte decomposition, thereby enhancing the initial coulombic efficiency [30]. The XRD patterns of samples (Fig. S1e in Supporting information) indicate no notable changes in their crystalline structures, only the surface chemistry was modulated.
The structural models of BHC and PHC systems are constructed as depicted in Figs. S2a and b (Supporting information) respectively. Differential charge density maps of Na+-G2 group adsorbed on carbon layers (Figs. S2c and d in Supporting information) illustrate the electron transfer between Na+-G2 and carbon. Notably, a critical comparison of adsorption energy is presented in Fig. 1f, where BHC exhibits an adsorption energy of −0.29 eV and PHC demonstrates a reduced value of −0.08 eV. This indicates that sp2-rich carbon effectively suppresses the adsorption quantity of solvent molecules at electrode-electrolyte interface, thereby mitigating excessive electrolyte decomposition and enhancing the ICE [31]. As shown in Figs. S3a and b (Supporting information), for the ester-based solvent molecule ethylene carbonate (EC) and dimethyl carbonate (DMC), PHC still exhibits a relatively low adsorption energy than BHC. Fig. S3c (Supporting information) displays the first discharge curves of half-cells using 1 mol/L NaPF6 in EC/DMC (1:1, v/v) electrolyte, showing an improvement in the ICE from 82.2% to 86.8%. Furthermore, contact angle measurements conducted on both electrodes (Figs. 1g and h). It reveals that the electrolyte exhibits a contact angle of 11.53° on BHC electrode surface, which increases to 17.24° on PHC electrode surface. Although contact angle is enlarged, the electrode can still maintain good wettability with electrolyte. This observation indicates that sp2-rich carbon interface exhibits reduced adsorption energy toward electrolyte molecules, avoiding excessive decomposition of electrolyte.
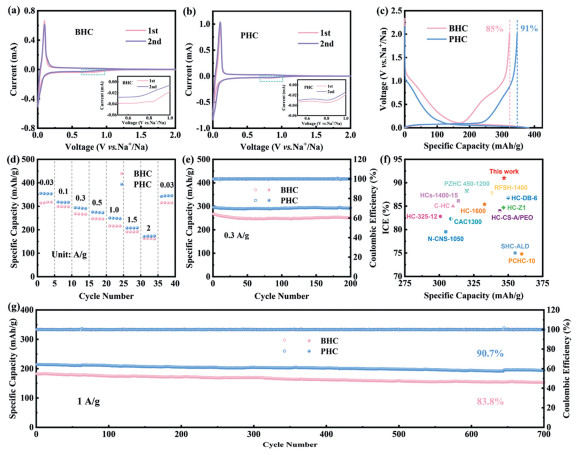
The cyclic voltammetry (CV) curves of hard carbon/sodium half-cell (Figs. 2a and b) exhibit an irreversible reduction peak near 0.8 V, corresponding to decomposition of electrolyte at hard carbon surface to form a SEI film [32-34]. A pair of characteristic redox peaks appeared around 0.1 V, attributing to intercalation/deintercalation behavior of Na+ within hard carbon layers [35,36]. In Fig. 2b, the irreversible reduction peak near 0.8 V diminishes significantly, indicating suppressed irreversible electrolyte decomposition during the first discharge process, which contributes to improved ICE. The first discharge curve of hard carbon electrode (Fig. 2c) comprises a typical sloping region and a plateau region. The BHC electrode delivers an ICE of 85% and a reversible discharge capacity of 323 mAh/g, while the PHC electrode demonstrates enhanced performance with an ICE of 91% and a reversible capacity of 346 mAh/g. Other samples were also tested by half cells and GCD curves were shown in Fig. S4 (Supporting information). When the coating layer is thin, the sp2 carbon can effectively reduce the adsorption energy of solvent molecules, thus preventing excessive solvent decomposition and improving the initial coulombic efficiency. However, when the coating layer becomes excessively thick, the surface forms pitch-derived hard carbon with narrow interlayer spacing, which may lead to irreversible sodium ion intercalation, thereby reducing the ICE [37]. Rate capability tests across various current densities (Fig. 2d) reveal that PHC consistently exhibits higher discharge capacity than BHC. As shown in Fig. 2e, the cycling performance at 0.3 A/g demonstrates a capacity retention of 98.9% for PHC after 200 cycles, surpassing the 94% retention of BHC. Compared with literature-reported values (Fig. 2f), PHC achieves a superior combination of ICE and reversible capacity. To further evaluate cycling stability, long-term tests at 1 A/g reveal a capacity retention of 90.7% for PHC after 700 cycles, significantly higher than 83.8% retention observed for BHC (Fig. 2g).
Figure 2
Figure 2.
CV curves of (a) BHC anode and (b) PHC anode. (c) The GCD profiles in first cycle of samples. (d) Rate performance of electrodes. (e) Cycle performance in 0.3 A/g. (f) Performance comparison chart. (g) Cycle performance in 1 A/g.
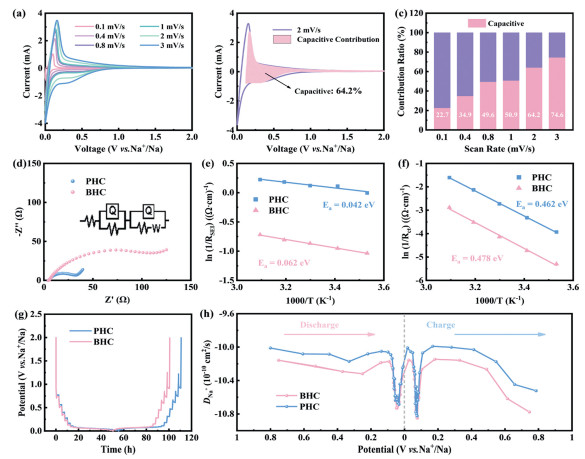
The cyclic voltammetry profiles at various scan rates are presented in Fig. 3a. The CV peaks near 0.1 V exhibit minimal polarization voltage, suggesting favorable electrochemical behavior of Na+. As calculated in Fig. 3b, the capacitive contribution of PHC electrode accounts for 64.2% achieving better rate performance. Quantitative analysis of capacitive contribution at different scan rates (Fig. 3c) reveals a gradual increase in capacitive dominance with elevated scan rates. Concurrently, the PHC electrode demonstrates significantly lower electrochemical impedance compared to BHC (Fig. 3d). As shown in Figs. 3e and f, activation energy calculations derived from temperature-dependent impedance measurements indicate that Na+ transfer through SEI activation energy for PHC (0.042 eV) is lower than that of BHC (0.062 eV), while electrochemical reaction activation energy of PHC (0.462 eV) is also reduced relative to BHC (0.478 eV). Lower activation energy is beneficial to accelerate sodium ions transfer, corresponding to better electrochemical performance. The galvanostatic intermittent titration technique (GITT) voltage-time profiles and corresponding diffusion coefficient profiles are depicted in Figs. 3g and h. The DNa+ demonstrates a gradual decline in diffusion coefficients as the voltage decreases, reaching a minimum near 0.1 V, followed by a slight recovery at lower voltages under 0.1 V. While PHC delivers a analogous diffusion coefficient trend to BHC but higher values. Therefore, PHC electrode delivers a higher Na+ transport rate, revealing a better sodium storage capacity in high current density.
Figure 3
Figure 3.
(a) CV curves in different scan rates. (b) Capacitive Contribution fitting results. (c) Capacitive contribution ratio. (d) EIS results of samples. The activation energies of (e) charge-transfer process and (f) Na+ transport through SEI. (g) Time-voltage curves. (h) DNa+–voltage curves.
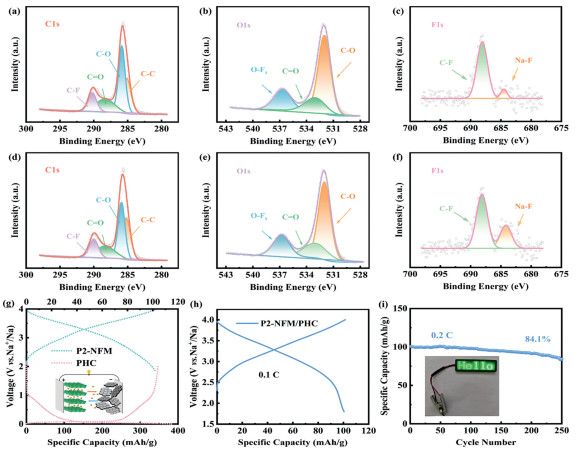
X-ray photoelectron spectroscopy measurements were conducted on cycled electrodes to characterize the composition and structural features of SEI. As shown in Figs. 4a and d, the C–O and C=O peaks in C 1s spectrum of BHC electrodes exhibit greater intensity compared to those in PHC electrode, indicating a higher proportion of organic species within SEI [14,26]. The reduced sp2–C content in BHC enhances its adsorption energy to solvent molecules, resulting in excessive decomposition of solvent (Figs. 4b and e). The F 1s profiles in Figs. 4c and f reveal that PHC contains a higher NaF content than BHC. This elevated inorganic component facilitates the formation of a favorable SEI layer, which is beneficial for long-term cycling stability. Figs. S5a and b (Supporting information) further demonstrate that SEI on PHC electrode contains a greater amount of NaF inorganic constituent. Specifically, the BHC surface exhibits a higher organic content and lower inorganic content in its SEI compared to PHC. More inorganic constituent can form a thin and firm SEI, keeping stable during cycles. While SEI with more organic component usually undergoes multiple crushing and rebuilding during cycle, resulting poor cycle life.
Figure 4
Figure 4.
XPS spectra of (a, d) C 1s, (b, e) O 1s, (c, f) F 1s. (g) GCD curves of half-cell about P2-NFM/Na and PHC/Na. (h) Charge and discharge profiles of P2-NFM/PHC full cell at a current density of 0.1 C (1 C = 120 mA/g). (i) Cycle performance of coin full cell at a current density of 0.2 C (1 C = 120 mA/g) based on cathode.
The PHC electrode was further assembled to be coin full-cell after cycling three times in HC/Na half-cell. The cathode material employed Na2/3Ni1/3Fe1/3Mn1/3O2 (P2-NFM), while Fig. 4g demonstrates half-cell performance of P2-NFM/Na and PHC/Na. Notably, the cathode exhibits a reversible capacity of 103 mAh/g. The charge-discharge profiles of full-cell presented in Fig. 4h deliver a reversible capacity of 100 mAh/g at a current density of 0.1 C (1 C = 120 mA/g). As depicted in Fig. 4i, P2-NFM/PHC full-cell demonstrates stable cycling performance at 0.2 C, maintaining a capacity retention rate of 84.1% after 250 cycles.
In summary, we propose a carbon orbital hybridization modulation strategy to regulate the hard carbon properties and design an interface layer enriched with sp2–C. Owing to lower adsorption energy of sp2–C toward solvent molecules compared to sp3–C, the interfacial region exhibits reduced solvent accumulation and enhanced anion enrichment. This interface effectively modulates the composition of SEI, forming an inorganic-rich SEI layer, which significantly improves ICE of hard carbon. Optimized PHC demonstrates a high ICE of 91% and a sodium storage capacity of 346 mAh/g. This work elucidates the critical role of carbon hybridization states in governing hard carbon performance, offering a novel design principle for high-performance hard carbon materials with substantial commercial potential.
Declaration of competing interest
The authors declare that they have no known competing financial interests or personal relationships that could have appeared to influence the work reported in this paper.
We acknowledge financial support from the Heilongjiang Province "Double First Class" Discipline Collaborative Innovation Project (No. LJGXCG2023–061). The authors would like to thank Shiyanjia Lab (http://www.shiyanjia.com) for the XPS analysis.
Supplementary materials
Supplementary material associated with this article can be found, in the online version, at doi:10.1016/j.cclet.2025.111506.
L. Xiao, H. Lu, Y. Fang, et al., Adv. Energy Mater. 8 (2018) 1703238. doi: 10.1002/aenm.201703238
[37]
H. Chen, N. Sun, Y. Wang, et al., Energy Storage Mater. 56 (2023) 532–541. doi: 10.1016/j.ensm.2023.01.042
Figure 1
(a) Diagram of orbital hybridization states formation SEI. (b) Raman spectra of samples. XPS results of (c) BHC and (d) PHC. (e) Nitrogen adsorption-desorption isotherms. (f) Adsorption energy between Na+-G2 group and carbon layer. Contact angle results of electrolyte on (g) BHC and (h) PHC.
Figure 2
CV curves of (a) BHC anode and (b) PHC anode. (c) The GCD profiles in first cycle of samples. (d) Rate performance of electrodes. (e) Cycle performance in 0.3 A/g. (f) Performance comparison chart. (g) Cycle performance in 1 A/g.
Figure 3
(a) CV curves in different scan rates. (b) Capacitive Contribution fitting results. (c) Capacitive contribution ratio. (d) EIS results of samples. The activation energies of (e) charge-transfer process and (f) Na+ transport through SEI. (g) Time-voltage curves. (h) DNa+–voltage curves.
Figure 4
XPS spectra of (a, d) C 1s, (b, e) O 1s, (c, f) F 1s. (g) GCD curves of half-cell about P2-NFM/Na and PHC/Na. (h) Charge and discharge profiles of P2-NFM/PHC full cell at a current density of 0.1 C (1 C = 120 mA/g). (i) Cycle performance of coin full cell at a current density of 0.2 C (1 C = 120 mA/g) based on cathode.


 DownLoad:

 下载:
下载:


