Engineering Research Center of Ministry of Education for Geological Carbon Storage and Low Carbon Utilization of Resources, Beijing Key Laboratory of Materials Utilization of Nonmetallic Minerals and Solid Wastes, School of Materials Science and Technology, China University of Geosciences, Beijing 100083, China
b.
Shandong Haihua Group Co., Ltd., Weifang 261000, China
c.
School of Science, China University of Geosciences, Beijing 100083, China
d.
Beijing Synchrotron Radiation Facility Institute of High Energy Physics, Chinese Academy of Science, Beijing 100049, China
Received Date:
11 May 2025 Accepted Date:
10 June 2025 Revised Date:
07 June 2025 Available Online:
15 February 2026
Abstract:
Polyethylene oxide (PEO)-based solid polymer electrolytes (SPEs) have long faced limitations due to low ionic conductivity at ambient temperature and poor interfacial stability with lithium metal anodes. Here, we present a structural engineering strategy to address these challenges through shear-induced crystallization of concentrated PEO-LiTFSI solutions, which self-assemble into flower-like spherulites with radially aligned lamellar crystals. This unique structure creates continuous Li+ transport highways through densely packed crystalline domains, achieving a record-high ionic conductivity of 1.70 × 10⁻⁴ S/cm at 25 ℃ for pristine PEO-based systems. Strategic incorporation of lithium montmorillonite (MMTli, 10 wt%) further optimizes the composite electrolyte, balancing high ionic conductivity (1.47 × 10⁻⁴ S/cm) with enhanced electrochemical stability (4.99 V vs. Li+/Li), elevated Li+ transference number (0.62), and mechanical robustness. The composite electrolyte enables stable Li plating/stripping over 800 h in symmetric Li||Li cells and powers LiFePO4||Li solid-state batteries with 82% capacity retention after 200 cycles at 0.2 C under ambient conditions. This work pioneers a scalable processing paradigm for crystalline polymer electrolytes, offering new insights into ion transport mechanisms and validating clay minerals as multifunctional additives for next-generation energy storage systems.
To address the increasing demand for energy-dense and safe electrochemical energy storage systems, significant efforts have been directed towards the development of solid-state lithium metal batteries that offer high energy density and enhanced safety [1-4]. The performance of solid-state lithium batteries largely depends on the solid electrolyte, prompting extensive research to develop electrolytes with high ionic conductivity, robust chemical stability and cost-effectiveness [5-9]. SPEs offer distinct advantages over inorganic solid electrolytes, such as Li7La3Zr2O12 [10], Li1.3Al0.3Ti1.7(PO4) [11], Li10GeP2S12 [12], and Li5.4PS4.4Cl1.6 [13], including superior flexibility [14,15], favorable interfacial compatibility [16], and ease of processing [17]. As a result, SPEs are well-positioned for large-scale production [18,19] and are considered one of the most promising candidates for commercial all-solid-state rechargeable lithium batteries.
Crystalline SPEs represent a significant class of SPEs that have garnered extensive attention over the past three decades [20-23]. These materials are typically synthesized by dissolving lithium salts, such as LiClO4, in a polymer matrix, resulting in a coexistence of crystalline and amorphous phases during preparation [24,25]. Polyethylene oxide (PEO), derived from the polymerization of ethylene oxide, is a high molecular weight polymer with favorable processability and ionic conductivity. Consequently, PEO-based SPEs have been intensively studied. However, ion conduction in PEO-based systems remains inherently limited, typically on the order of 10–6 S/cm at ambient conditions [26,27]. It is widely accepted that Li+ transport predominantly occurs within the amorphous regions above the glass transition temperature (Tg), while the crystalline regions are largely impermeable to Li+ [25]. To address this limitation, numerous studies have focused on reducing the crystallinity of the SPEs, for instance, by doping with Al2O3 [28], SiO2 [29], TiO2 [30], and fast-ion conductor nanoparticles [31-34]. Nevertheless, this insight and strategy is no less controversial. Notably, Bruce et al. demonstrated that ionic conductivity within the static, ordered environment of the crystalline phase can exceed that of the corresponding amorphous phase above Tg [23,24,35,36]. In the crystalline phase, ion transport is predominantly influenced by cations, whereas both cations and anions exhibit mobility in the amorphous phase. Bruce et al. proposed that Li-ions in the crystalline phase conduct rapidly through aligned channels formed by polymer molecular chains, leading to enhanced ionic conductivity [37]. This hypothesis has been robustly validated by research conducted by Yi Cui's group [14]. They introduced a PEO-Li salt solution into the nanoporous channels of polyacrylonitrile (PAN) films, creating composite polymer electrolyte with directionally arranged PEO-Li salt channels. The ionic conductivity within these composite electrolyte channels reached an impressive 2.3 × 10⁻⁴ S/cm at 30 ℃, significantly surpassing that of randomly oriented PEO/Lithium bis(trifluoromethanesulphonyl)imide (LiTFSI) samples. These findings suggest that for PEO-based SPEs, the formation of additional crystalline regions with oriented PEO molecular chains can substantially enhance the number of ion transport pathways, thereby potentially increasing ionic conductivity.
An alternative strategy to achieve oriented PEO chains involves the utilization of spherulites in polymers. Spherulites represent a ubiquitous crystalline morphology observed in polymers upon crystallization from the melt or concentrated solutions. These structures are polycrystalline aggregates that exhibit radial growth patterns emanating from a central nucleus, with lamellae serving as the fundamental building blocks formed by the ordered stacking of polymer chains (Fig. S1 in Supporting information) [38]. Studies have shown that spherulites derived from the evaporation-induced crystallization of concentrated polymer solutions tend to exhibit more complete and larger morphologies compared to those obtained from dilute solutions [39]. In addition, relatively ordered spherulite morphologies can be induced through the application of external shear stress due to intervention on the growth of crystal nuclei [40-43]. In the PEO-LiTFSI system, while the presence of LiTFSI exerts a significant influence on the crystallization behavior of PEO [19,44], it does not fundamentally impede the crystallization process. Nevertheless, this strategy seems to have been ignored in current studies.
Herein, for the first time, we synthesized a highly crystalline, oriented SPE with distinctive flower-like spherulite morphologies through the application of shear induction to a concentrated PEO-Li salt solution. This approach facilitated the alignment of PEO molecular chains within the crystalline regions, achieving an unprecedented ionic conductivity of 1.70 × 10⁻⁴ S/cm at room temperature. To the best of our knowledge, this is the highest ionic conductivity reported to date for an all-solid "PEO-Li salt" SPE (no other fillers or plasticizer, Table S2 in Supporting information). Building on this, we further incorporated clay-based nanofiller, that is lithium montmorillonite (MMTli), into the SPE to create a composite solid polymer electrolyte (CSPE) for significantly enhancing its electrochemical and thermal stabilities. When integrated into LiFePO4||Li solid-state batteries, the CSPE enabled a specific discharge capacity of 154 mAh/g at rate of 0.1 C under 25 ℃, attributable to its superior overall performance. Furthermore, the battery demonstrated stable cycling over 200 cycles at rate of 0.2 C, maintaining 82% of its initial capacity (125 mAh/g). This work enhances our understanding of ion conduction in crystalline SPEs and explores the promising application of clay mineral fillers in electrochemical energy storage, providing a viable strategy for the development of high-performance crystalline SPEs.
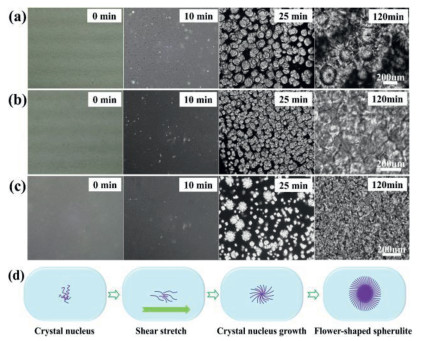
We first conducted three controlled experiments to identify the essential factors affecting spherulite growth and morphology during the evaporation and crystallization of PEO-LiTFSI solution. Fig. 1a illustrates the formation process of flower-like spherulites under an optical microscope. A 10 wt% PEO-LiTFSI solution was uniformly cast onto a glass slide using a doctor blade and subsequently monitored under optical microscope (Fig. 1a, the crystallization process is detailed in Fig. S2 in Supporting information). Observations indicated that within 10 min, there was a marked increase in the number of the crystal nuclei. And prominent spherulites were evident after 25 min, which then gradually evolved into flower-like formations. Upon near-complete solvent evaporation after 120 min, fully developed flower-like spherulites emerged, each averaging over 400 µm in diameter, with individual petals reaching lengths approaching nearly 100 µm. In the absence of shear induction, for the same concentration of PEO-LiTFSI solution, larger yet densely packed spherulites lacking characteristic flower-like morphologies were observed, with an average size of approximately 180 µm (Fig. 1b). For a 4 wt% PEO-LiTFSI solution, gentle casting allowed the solution to spread naturally. Fewer crystal nuclei were noted, hindering spherulites growth and leading to the formation of dense, disordered stacks of spherulites, each smaller than 100 µm (Fig. 1c). Based on these experimental observations, we infer that while spherulites typically form spherical aggregates via radial growth from a central nucleus, the solvent evaporation stress during film formation limits spherulites development in the vertical plane. Additionally, the presence of LiTFSI disrupts the ordered arrangement of molecular chains, resulting in flat spherulites without regular lamellar arrangements. However, for concentrated PEO-LiTFSI solutions, the precipitated PEO chains lead to more perfect spherulites. Moreover, if shear stress is applied during nucleation (Fig. 1d), the disturbed polymer chains outside the nucleus become orderly due to shear tension, guiding subsequent PEO chain growth along the induced direction and ultimately forming distinctive flower-like spherocrystals. Conversely, in the absence of such stress, spherulites struggle to achieve an orderly crystal structure. This demonstrates that the concentration of the polymer solution and shear induction are key factors affecting the spherulite structure and morphology within the PEO-Li-SPEs.
Figure 1
Figure 1.
Optical microscope images of the growth process of spherulites produced by (a) blade coating 10 wt% PEO-LiTFSI concentrated solution, (b) casting 10 wt% PEO-LiTFSI concentrated solution, and (c) casting 4 wt% PEO-LiTFSI dilute solution. (d) Schematic diagram of formation mechanism of flower-like spherulite.
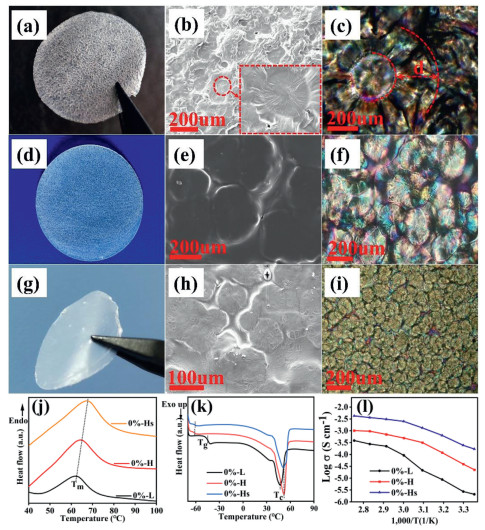
SPE membranes prepared by different methods exhibit significant variations in appearance. Fig. 2a illustrates the SPE fabricated by blade coating 10 wt% PEO-LiTFSI concentrated solution (designated as 0%-Hs). The 0%-Hs sample appears translucent with a rough surface and contains numerous closely packed circular structures. The SEM image of the sample reveals unique morphologies resembling "whirlpools" (Fig. 2b), each approximately 200 µm in diameter, characterized by slightly concave centers and elevated edges (inset of Fig. 2b). Under polarizing optical microscopy, the whirlpool structure exhibits a flower-like pattern, with stamens and petals measuring around 200 µm in diameter and length, respectively (Fig. 2c). In contrast, the absence of shear induction results in a markedly different appearance for the SPE membrane (designated as 0%-H). Its transparency decreases, and the membrane features dense white spots (Fig. 2d). SEM images (Fig. 2e) indicate that the cluster size increases to nearly 200 µm, with corresponding spherulite growth observed under polarizing optical microscopy (Fig. 2f). For the SPE prepared from a 4 wt% PEO-LiTFSI dilute solution (designated as 0%-L), a transparent and soft appearance is achieved after drying and cutting (Fig. 2g). SEM analysis (Fig. 2h) reveals the membrane consists of many dense small clusters, approximately 50–80 µm in diameter, interspersed with amorphous regions. The corresponding polarizing optical microscopy image (Fig. 2i) clearly depicts yellow-green spherulites surrounded by purplish-red amorphous areas, consistent with the observed sizes. The visual characteristics of these samples are closely associated with their crystallinity levels.
Figure 2
Figure 2.
Morphology and physicochemical properties of three different SPE membranes. (a) The optical image, (b) SEM image and (c) polarizing optical microscopy image of 0%-Hs sample, and the same test for (d-f) sample 0%-H and (g-i) sample 0%-L. (j) The DSC curves of rise and (k) drop temperature function of temperature, and (l) the ionic conductivities of the three SPE samples.
Transparency generally correlates inversely with crystallinity. DSC curves for heating and cooling (Figs. 2j-k) show distinct melting points, glass transition temperatures (Tg), and crystallization points among the three samples, reflecting differences in crystallinity summarized in Table 1. Crystallinity (χc) of all electrolytes were calculated using Eq. 1:
Xc=ΔHmΔHPEOfPEO×100%
(1)
Table 1
Table 1.
The physiochemical data for the phase behavior of SPE.
where ΔHm represents the melting enthalpy of the SPE membranes, and ΔHPEO is the enthalpy of fusion for fully crystalline PEO at 196.4 J/g [45], with fPEO being the weight fraction of PEO in the SPE membrane. For reference, the DSC curve of a pure PEO membrane without Li salt (Fig. S3 in Supporting information) shows Tg, crystallization temperature (Tc), and melting temperature (Tm) values of −63.3, 42.3, and 70.4 ℃, respectively. Upon adding lithium salt, the 0%-L membrane exhibits a higher Tg (−45 ℃), Tc (47.2 ℃) and lower Tm (61.55 ℃), attributed to a substantial decrease in crystallinity from 83.96% to 19.76%. Notably, the crystallinity of the 0%-H and 0%-Hs is significantly higher than that of the 0%-L, especially for 0%-Hs, which reaches up to 57.48%. This increase in crystallinity corresponds directly to the degree of order in the polymer chains within the sample. The smaller spherulites in the 0%-L result in entangled polymer chains and reduced crystallinity, while the larger spherulites in the 0%-H indicate relatively stretched chains and higher order, resulting in greater crystallinity. As for 0%-Hs, the presence of numerous flower-like spherulites, characterized by orderly lamellar crystals forming the "petal" structures, significantly enhances crystallinity. Ionic conductivity measurements over a temperature range from 25 ℃ to 90 ℃ (Fig. 2l) demonstrate that conductivity increases with temperature due to enhanced ion Table 1. The physiochemical data for the phase behavior of SPE mobility. At room temperature (25 ℃), the 0%-H exhibits higher conductivity (2.27 × 10⁻⁵ S/cm) compared to 0%-L (2.08 × 10⁻⁶ S/cm), while the 0%-Hs membrane achieves an impressive conductivity of 1.70 × 10⁻⁴ S/cm. A positive correlation between ionic conductivity and crystallinity suggests that the ordered crystalline phase facilitates ion migration. Specifically, the low crystallinity of the 0%-L membrane, with its small and densely packed spherulites and intertwined polymer chains, hinders ion migration. Conversely, the higher crystallinity of the 0%-H membrane, featuring larger spherulites and more ordered polymer chains, leads to increased room-temperature conductivity. The further increase in crystallinity for the 0%-Hs membrane, characterized by extensive crystalline regions and large, orderly lamellar crystals, creates a highly conductive environment, likely contributing to its superior ionic conductivity.
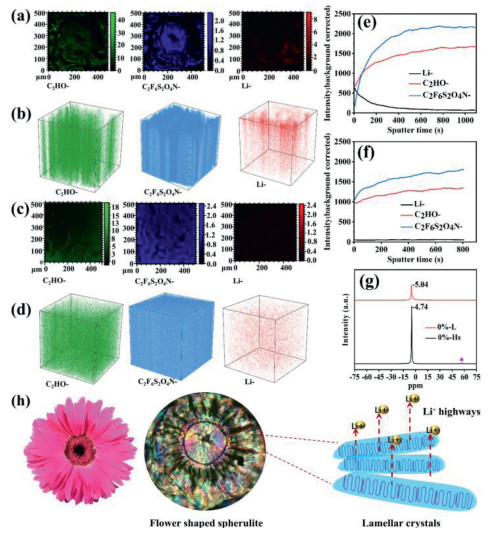
TOF-SIMS offers ultrahigh chemical selectivity and is capable of separately analyzing the individual components of the region of interest. To find out the PEO molecular chain arrangement and Li+ distribution in samples, we performed TOF-SIMS mapping and depth profiling of the 0%-Hs and 0%-L. And this reveals the composition of fragments from the samples during the sputtering process [46,47]. Here, both Li- and C2F6S2O4N- fragments originate from the LiTFSI, while C2HO- fragments come from the PEO molecular chains. Fig. 3a shows the mapping image of a single flower-like spherulite of 0%-Hs sample under Cs+ source sputtering. It can be seen that the signals of C2HO- and Li- are stronger in the "petal" parts, indicating that the polymer chains of PEO are denser in the lamellar crystals, and Li+ tend to be distributed among the lamellar crystals. In contrast, the signal of C2F6S2O4N- is stronger and more evenly distributed, which is attributed to the presence of two sulfonamide groups in the LiTFSI. The 3D images corresponding to the sputtering volume are shown in Fig. 3b Interestingly, PEO molecular chains (the 3D image of C2HO-) seem to form lots of vertical strip-like pathways, which are consistent with the distribution of Li-, reflecting that the lamellar crystals of the flower-like spherulites are continuous Li+ transport pathways. The 3D images of C2F6S2O4N- is consistent with its mapping image, showing a strong signal. Compared with this sample, the signals distribution of C2HO-, Li- and C2F6S2O4N- in 0%-L sample (Figs. 3c and d) are more uniform, while the signal of Li- is weak and there are no continuous Li-ions transport channels. Fig. 3e reveals the trends of C2HO-, Li- and C2F6S2O4N- fragments in the 0%-Hs as a function of sputtering depth in a negative mode. The curves are consistent with their 3D images, with significant signal intensity variations on the sample surface. The Li- fragments levels are higher at the beginning of the sputtering process, but down to a lower level as the sputter time increases. However, C2HO- and C2F6S2O4N- fragments concentration were initially low and gradually stabilized at higher levels with the increase of sputtering time. In contrast, the distribution of C2HO-, Li- and C2F6S2O4N- fragments in the 0%-L (Fig. 3f) sample is relatively uniform and does not change significantly with the etching depth, but Li- stay at a low level. The above results suggest that the Li-ions in the 0%-Hs has continuous directional transmission channels, while the Li-ions in the 0%-L sample has no continuous transmission paths. This explains the high ionic conductivity of the 0%-Hs sample at room temperature. The local chemical environments and dynamics of Li-ions in 0%-Hs and 0%-L were further studied using 7Li solid-state NMR (Fig. 3g). A strong signal at approximately −4.74 ppm was observed in the spectrum of 0%-Hs due to the higher concentration of Li-ions in the sample. In contrast, a weak 7Li NMR signal at approximately −5.04 ppm was observed in 0%-L, which is attributed to the relatively low concentration of lithium salt in this sample. For the 0%-Hs sample, in addition to the sharp and strong peak, a new resonance is appeared at 58 ppm, which can be attributed to the Li-ions located in the interfacial phases among the large lamellar crystals of 0%-Hs sample [48]. The changes in the chemical shift of these 7Li peaks suggest different Li-ions chemical environments in 0%-Hs compared to that in the 0%-L, consistent with the directional continuous transport paths of Li-ions created by the flower-like spherulites in 0%-Hs sample [49]. In view of the above analysis, we speculate that the conduction mechanism of lithium ions in a flower-like spherulite is as follows (Fig. 3h): The "petal" part of the spherulites are lots of large lamellar crystals closely distributed perpendicular to the SPE membrane, and the lithium ions are mainly distributed between the interfaces of the lamellar crystals and each other, which provides the directional and continuous paths for Li-ions transmission. Therefore, this electrolyte shows high ionic conductivity even at room temperature.
Figure 3
Figure 3.
The research and analysis of Li+ conduction mechanism in 0%-Hs. (a) The 2D images and (b) corresponding 3D views of 0%-Hs in negative ion mode by TOF-SIMS testing. (c, d) The same tests for sample 0%-L. The TOF-SIMS depth profiles for (e) 0%-Hs and (f) 0%-L, and (g) the 7Li NMR spectrum of the sample of 0%-Hs and 0%-L. (h) The POM image of flower-like spherulite and the diagram of Li-ion conduction paths.
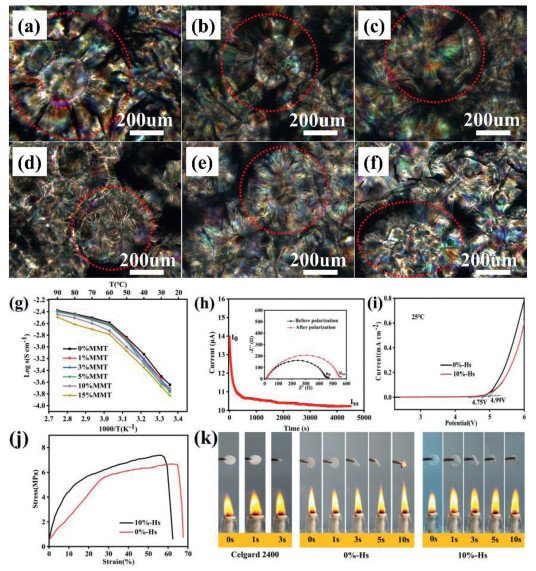
Figs. 4a-f show the polarizing optical microscopy images of CSPE formed by doping with 1, 3, 5, 10 and 15 wt% MMTli (denoted as 1%-Hs, 3%-Hs, 5%-Hs, 10%-Hs and 15%-Hs, respectively) into 0%-Hs SPE. It can be seen that after adding MMTli, the size of spherulite is slightly reduced (the red dotted circle, the diameter is decreased to 300–400 µm), but it still maintains a relatively complete flower-like feature, and the arrangement of polymer molecular chains is still relatively orderly. However, when the amount of MMTli was up to 15 wt%, the flower-like structure of spherulites was destroyed and the large crystalline structure of the polymer is significantly damaged. This change process is consistent with the results of XRD diffraction patterns (Fig. S5 in Supporting information), and the pure PEO membrane has very strong crystallinity, and there are relatively strong characteristic diffraction peaks at (120) and (112) crystal plane, but when lithium salt was added, the diffraction peak intensity of crystal plane (120) and (112) is weakened, indicating that the integrity of the crystals decreases. However, when MMTli was added into 0%-Hs electrolyte, the integrity of the crystallization to further weakened, and the diffraction peak of (112) crystal plane is split. And when the addition of MMTli increased to 15%wt, the characteristic diffraction of (120) crystal plane decreased significantly, and the diffraction peak of (112) crystal plane widened and split. It is worth noting that the change of diffraction peak strength is also consistent with the change of ionic conductivity of the sample (the ionic conductivity of the sample slightly decreases to varying degrees with the addition of MMTli (Fig. 4g)). The activation energy of different samples is shown in Table S3 (Supporting information). When the temperature > 60 ℃, the activation energy of x%-Hs (x = 0, 1, 3, 5, 10, 15) composite electrolyte increases gradually from 0.18 eV to 0.25 eV. When the temperature < 60 ℃, the activation energy first increased and then decreased. When the MMTli added 10 wt%, the activation energy reached the minimum value of 0.59 eV. However, when the amount of MMTli added reached 15 wt%, the activation energy began to increase. The trend of ionic conductivity of the samples at room temperature (Fig. S6a in Supporting information) is consistent with the change of activation energy. Obviously, the addition of MMTli evidently altered the spherulite morphology and reduced crystal integrity, which in turn had a discernible impact on ionic conductivity. However, the 10%-Hs still maintained a high ionic conductivity of 1.47 × 10⁻⁴ S/cm, so the subsequent experiments took this sample as the research object. Fig. 4h displays the chronoamperometry profile and alternating current impedance spectra of 10%-Hs and 0%-Hs, and the corresponding tLi+ can be calculated as 0.62 and 0.45 (Fig. S6b in Supporting information). The increase of tLi+ is attributed to the trapping effect of TFSI− large anions [50] by the edge charges of MMTli nanosheets. Fig. 4i shows the Linear Sweep Voltammetry (LSV) of the sample for evaluating voltage tolerance window. It showed that the 0%-Hs polymer membrane began to decompose significantly when the voltage exceeded 4.8 V, while the decomposition resistance voltage of 10%-Hs could be maintained at 4.99 V, indicating that the addition of MMTli could improve the electrochemical stability window of the SPE. Fig. 4j shows the stress-strain curves of the two electrolytes. Compared to the 0%-Hs electrolyte, the tensile strength of the 10%-Hs composite electrolyte increased significantly from 6.2 MPa to 7.6 MPa. This enhancement is attributed to the interactions between exfoliated MMTli and PEO molecular chains. Heat resisting property of the CSPE was evaluated by combustion experiments. As shown in Fig. 4k, the commercial diaphragm was ignited instantaneously under the external flame of the alcohol lamp and burns out in < 3 s. And the flame retardant effect of 0%-Hs sample is slightly better, which can keep about 5 s without being ignited. In contrast, the 10%-Hs sample has a significant flame advantage. When the electrolyte was heated for 10 s by the external flame of the alcohol lamp, only bending deformation occurs, but it was not ignited, which is attributed to the key role of doped MMTli.
Figure 4
Figure 4.
(a-f) The polarizing optical microscopy images of samples doped with 1 wt%−15 wt% of MMTli. (g) The function curves of ionic conductivity and temperature of these CSPEs. (h) Chronoamperometry of the Li/10%-Hs/Li symmetric cell with an applied voltage of 10 mV, and the inset is the impedance spectra of the symmetric cells before and after polarization. (i) LSV scans and (j) stress-strain curves for 0%-Hs and 10%-Hs. (k) The combustion testing comparation with commercial separator.
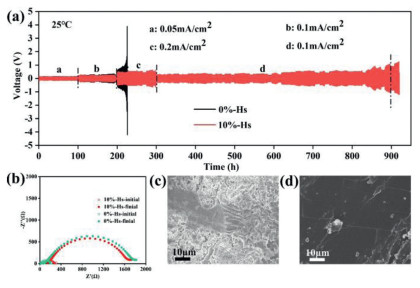
The stability between the electrolyte and the lithium metal is another important consideration, therefore, Li plating/stripping experiments in symmetric batteries were carried out. Fig. 5a shows the voltage-time cycle curves of the Li|0%-Hs|Li and Li|10%-Hs|Li symmetrical batteries charged and discharged for 1 h at different current densities overpotential of the Li|0%-Hs|Li battery increases significantly, and short circuit occurs at respectively. It can be seen that when the current density increases to 0.2 mA/cm2, the retardant about 220 h. For the Li|10%-Hs|Li battery, there is no significant increase in overpotential when the current density increases to 0.2 mA/cm2, and the stable cycle can continue for about 600 h at 0.1 mA/cm2. Moreover, EIS tests were performed for the lithium symmetric batteries before and after the cycle. As shown in Fig. 5b, it is obvious that the impedance of Li|10%-Hs|Li battery changes little before and after the cycle, which means that the electrolyte is more stable to lithium foils. Figs. 5c and d are the SEM images of the surface of lithium foil after Li|0%-Hs|Li and Li|10%-Hs|Li symmetrical batteries cycling, respectively. It can be seen that the former is covered with uneven and mossy dendrites, which are formed by a large number of lithium dendrites and dead lithium. While the latter is flatter, there is a small number of local protrusions, indicating that the side reaction has been better inhibited. This finding aligns with previous test results, indicating that the addition of MMTli can inhibit the side reactions between the polymer electrolyte and lithium metal, thereby effectively enhancing the stability of CSPE in contact with lithium metal.
Figure 5
Figure 5.
(a) Voltage profiles of long-term lithium plating/stripping cycles with a 2-h period in Li|0%-Hs|Li and Li|10%-Hs|Li symmetric batteries at the varies current density at room temperature. (b) AC impedance spectra of the lithium symmetric battery before and after cycles, and (c, d) surface morphologies of the corresponding lithium foils after cycles.
To investigate the distribution of MMTli in 10%-Hs, GIWAXS tests were performed. As shown in Fig. S7 (Supporting information), the ring diffraction patterns that appear in the samples are attributed to the (120) and (112) planes of the PEO crystallites, respectively [14]; and the downward wedge-shaped sharp angle is generated by the diffraction slit, and the bottom blue solid semicircle is the spot center. For 10%-Hs sample, a green dispersion ring and an oval yellowish-brown bright spot appear near the spot center of GIWAXS image, while the diffraction pattern of 0%-Hs sample does not show this phenomenon. This means that the crystallizability of 10%-Hs sample is lower than that of 0%-Hs sample, and the MMTli nanosheets in the sample film show horizontal orientation distribution [51]. Due to the excellent thermal stability of MMTli, when it is horizontally distributed in the polymer membrane, the 10%-Hs sample can have excellent thermal stability. In addition, the edge of MMTli nanosheet carries a small amount of positive charge, which can promote the dissociation of LiTFSI and immobilize TFSI-large anions [50], so that the electrolyte membrane has a high tLi+ and electrochemical stability. In addition, although the addition of MMTli slightly reduces the ordering of the polymer electrolyte membrane, MMTli can immobilize TFSI- and promote the conduction of Li+, thereby allowing the SPE 10%-Hs to still maintain a higher ionic conductivity.
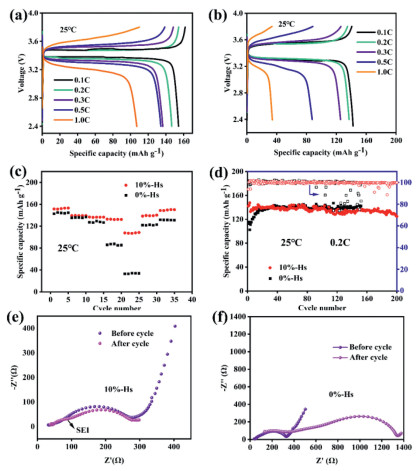
To demonstrate the feasibility of the 10%-Hs in the lithium metal batteries, solid-state LiFePO4|10%-Hs|Li batteries at room temperature were tested. Fig. 6a presents the typical charge–discharge profiles of the LiFePO4|10%-Hs|Li batteries in a voltage range of 2.3–3.8 V at various rates from 0.1 C to 1.0 C at 25 ℃. Voltage profiles at different rates from 0.1 C to 1.0 C present clear plateaus at around 3.48 V, which is slightly increased at higher rates during charging. And the corresponding overpotentials of 10%-Hs at different rates are obviously lower than that of 0%-Hs (Fig. 6b), showing a more stable charging/discharging process. When testing those batteries at gradually increased rates at 0.1, 0.2, 0.3, 0.5 and 1.0 C, the LiFePO4|10%-Hs|Li batteries displayed high specific capacities of 154, 147, 136, 134 and 107 mAh/g, respectively, and which are obviously higher than those in LiFePO4|0%-Hs|Li batteries (Fig. 6b). Fig. 6c exhibits the rate performances of the above two batteries. LiFePO4|10%-Hs|Li batteries have the better capacity, its reversible capacity is 109 mAh/g at 1 C, while the corresponding capacity of LiFePO4|0%-Hs|Li batteries is only 34 mAh/g. When the cycle is finished at the high rate of 1 C, the discharge capacity of the LiFePO4|10%-Hs|Li batteries can still be restored to 149 mAh/g as the rate returns to 0.1 C, which is 96.7% of the initial capacity at 0.1 C. As for long-term cycling (Fig. 6d), the LiFePO4|10%-Hs|Li batteries exhibit the distinct stability for about 200 cycles at 0.2 C, in which 82% retention of capacity (125 mAh/g) and ~100% coulombic efficiency were achieved. Whereas the coulombic efficiency of LiFePO4|10%-Hs|Li batteries began to fluctuate dramatically and gradually decreased when the cycling was about 92 cycles, and the battery was seriously short-circuited at 152 cycles. The impedance change in the batteries is directly related to the stability between the electrode and the solid electrolyte. The EIS test was performed on LiFePO4|10%-Hs|Li batteries before and after the cycling (Fig. 6e), it can be seen that the impedance of the battery after cycling exhibits a noticeable small arc but does not increase significantly overall, suggesting that a stable SEI layer may be formed during the cycle. It may be that the SEI layer inhibits the side reactions, so that the battery has better stability. However, the impedance of LiFePO4|0%-Hs|Li batteries changes greatly before and after cycling (Fig. 6f). And the impedance after cycling generates multiple capacitivity arcs, which means that there are multiple complex interfaces generated, reflecting the unstable electrochemistry in the battery.
Figure 6
Figure 6.
Electrochemical properties of the solid-state LFP|10%-Hs|Li batteries and LFP|0%-Hs|Li batteries. The charge/discharge curves of the LFP|10%-Hs|Li batteries (a) and LFP|0%-Hs|Li batteries (b) at 0.1, 0.2, 0.3, 0.5 and 1.0 C, respectively, and the corresponding rate (c) and cycle (d) performances, and (e, f) the impedance comparisons before and after the batteries cycles.
In summary, we demonstrated a scalable fabrication strategy for flexible polyethylene oxide (PEO)-based solid polymer electrolytes through doctor-blade coating of high-concentration PEO-LiTFSI solutions, achieving a unique flower-like spherulite morphology. The oriented crystalline lamellae within these superstructures established efficient Li+ conduction highways, yielding a record-high ionic conductivity of 1.70 × 10⁻⁴ S/cm at 25 ℃ for crystalline-dominant PEO electrolytes. Strategic incorporation of MMTli introduced multifunctional benefits: while slightly reducing conductivity to 1.47 × 10⁻⁴ S/cm, it significantly enhanced electrochemical stability (4.99 V vs. Li+/Li), mechanical robustness, and thermal resistance. The optimized composite electrolyte demonstrated improved interfacial stability, evidenced by stable Li plating/stripping over 800 h in symmetric Li||Li batteries, along with a high Li+ transference number (tLi+) of 0.62. When implemented in LiFePO4||Li full batteries, the system delivered good cycling performance with 82% capacity retention after 200 cycles at 0.2 C and maintains a reversible capacity of 125 mAh/g under ambient conditions. This study not only provides fundamental insights into crystalline-phase ion transport but also establishes a scalable processing paradigm compatible with industrial blade-coating techniques. Considering the persistent limitations in lithium metal anode stability, future studies should strategically incorporate molecular engineering approaches (e.g., ether-oxygen functional group modification) into the crystalline electrolyte framework, thereby synergistically suppressing dendritic lithium propagation under high-current-density operation.
Declaration of competing interest
The authors declare that they have no known competing financial interests or personal relationships that could have appeared to influence the work reported in this paper.
This work was supported by the National Natural Science Foundation of China (No. 42272044) and the High-performance Computing Platform of China University of Geosciences Beijing; the authors also gratefully acknowledge the cooperation of the beamline scientists at the Beijing Synchrotron Radiation Facility beamline (BSRF-1W1A).
Supplementary materials
Supplementary material associated with this article can be found, in the online version, at doi:10.1016/j.cclet.2025.111434.
J. Rivnay, S.C.B. Mannsfeld, M.F. Toney, et al., Chem. Rev. 112 (2012) 5488–5519. doi: 10.1021/cr3001109
Figure 1
Optical microscope images of the growth process of spherulites produced by (a) blade coating 10 wt% PEO-LiTFSI concentrated solution, (b) casting 10 wt% PEO-LiTFSI concentrated solution, and (c) casting 4 wt% PEO-LiTFSI dilute solution. (d) Schematic diagram of formation mechanism of flower-like spherulite.
Figure 2
Morphology and physicochemical properties of three different SPE membranes. (a) The optical image, (b) SEM image and (c) polarizing optical microscopy image of 0%-Hs sample, and the same test for (d-f) sample 0%-H and (g-i) sample 0%-L. (j) The DSC curves of rise and (k) drop temperature function of temperature, and (l) the ionic conductivities of the three SPE samples.
Figure 3
The research and analysis of Li+ conduction mechanism in 0%-Hs. (a) The 2D images and (b) corresponding 3D views of 0%-Hs in negative ion mode by TOF-SIMS testing. (c, d) The same tests for sample 0%-L. The TOF-SIMS depth profiles for (e) 0%-Hs and (f) 0%-L, and (g) the 7Li NMR spectrum of the sample of 0%-Hs and 0%-L. (h) The POM image of flower-like spherulite and the diagram of Li-ion conduction paths.
Figure 4
(a-f) The polarizing optical microscopy images of samples doped with 1 wt%−15 wt% of MMTli. (g) The function curves of ionic conductivity and temperature of these CSPEs. (h) Chronoamperometry of the Li/10%-Hs/Li symmetric cell with an applied voltage of 10 mV, and the inset is the impedance spectra of the symmetric cells before and after polarization. (i) LSV scans and (j) stress-strain curves for 0%-Hs and 10%-Hs. (k) The combustion testing comparation with commercial separator.
Figure 5
(a) Voltage profiles of long-term lithium plating/stripping cycles with a 2-h period in Li|0%-Hs|Li and Li|10%-Hs|Li symmetric batteries at the varies current density at room temperature. (b) AC impedance spectra of the lithium symmetric battery before and after cycles, and (c, d) surface morphologies of the corresponding lithium foils after cycles.
Figure 6
Electrochemical properties of the solid-state LFP|10%-Hs|Li batteries and LFP|0%-Hs|Li batteries. The charge/discharge curves of the LFP|10%-Hs|Li batteries (a) and LFP|0%-Hs|Li batteries (b) at 0.1, 0.2, 0.3, 0.5 and 1.0 C, respectively, and the corresponding rate (c) and cycle (d) performances, and (e, f) the impedance comparisons before and after the batteries cycles.

 DownLoad:

 下载:
下载:


