Data-driven insights into nonradical activation mechanisms for biochar inverse design: A synergistic approach using DFT and machine learning with meta-analysis
Citation:
Honglin Chen, Rupeng Wang, Zixiang He, Shih-Hsin Ho. Data-driven insights into nonradical activation mechanisms for biochar inverse design: A synergistic approach using DFT and machine learning with meta-analysis[J]. Chinese Chemical Letters,
2026, 37(2): 111372.
doi:
10.1016/j.cclet.2025.111372
Data-driven insights into nonradical activation mechanisms for biochar inverse design: A synergistic approach using DFT and machine learning with meta-analysis
English
Data-driven insights into nonradical activation mechanisms for biochar inverse design: A synergistic approach using DFT and machine learning with meta-analysis
Received Date:
26 January 2025 Accepted Date:
26 May 2025 Revised Date:
23 March 2025 Available Online:
15 February 2026
Abstract:
Machine learning (ML) is recognized as a potent tool for the inverse design of environmental functional material, particularly for complex entities like biochar-based catalysts (BCs). Thus, the tailored BCs can have a distinct ability to trigger the nonradical pathway in advance oxidation processes (AOPs), promising a stable, rapid and selective degradation of persistent contaminants. However, due to the inherent "black box" nature and limitations of input features, results and conclusions derived from ML may not always be intuitively understood or comprehensively validated. To tackle this challenge, we linked the front-point interpretable analysis approaches with back-point density functional theory (DFT) calculations to form a chained learning strategy for deeper sight into the intrinsic activation mechanism of BCs in AOPs. At the front point, we conducted an easy-to-interpret meta-analysis to validate two strategies for enhancing nonradical pathways by increasing oxygen content and specific surface area (SSA), and prepared oxidized biochar (OBC500) and SSA-increased biochar (SBC900) by controlling pyrolysis conditions and modification methods. Subsequently, experimental results showed that OBC500 and SBC900 had distinct dominant degradation pathways for 1O2 generation and electron transfer, respectively. Finally, at the end point, DFT calculations revealed their active sites and degradation mechanisms. This chained learning strategy elucidates fundamental principles for BC inverse design and showcases the exceptional capacity to integrate computational techniques to accelerate catalyst inverse design.
Among the extensively researched advanced oxidation processes (AOPs), persulfate (PS) treatment systems can be easily accelerated by various approaches, especially well-designed catalysts, for rapid degradation of persistent organic contaminants [1, 2]. Additionally, this treatment system can have a very stable performance due to its typical reliance on diverse degradation mechanisms triggered by various active species [3-5]. However, the development is also confined by the nature of diverse active reactive species during the degradation [6-8]. Thus, a comprehension of the correlation between pollutant properties and degradation efficiencies involving diverse active species will facilitate catalyst design, ultimately enhancing degradation effectiveness in PS treatment processes.
In seminal work, carbon-based materials are seen as eco-friendly substitutes for heterogeneous catalytic reactions in AOPs [9, 10], offering advantages like no metal leakage [11], biocompatibility, restorability, and versatility [12, 13]. Notably, biochar (BC)-based materials have a flexible structure suitable for targeted degradation and other special environmental catalysis [14-16]. For example, BC can be specifically tailored to enhance the nonradical (NR) contribution in PS activation [17, 18]. This NR degradation process, facilitated by tailored BC, ensures effective and consistent degradation of persistent organic pollutants, owing to its unique natures such as (1) owning wide adaptability and anti-interference capabilities to diverse environments [15, 19]; (2) preventing radical self-quenching through propagation reactions [20]; and (3) utilizing the maximum oxidizing capacity of oxidants [21, 22]. However, the easy-to-design nature also means challenge in the practice of rational design of BC catalysts, such as identifying the key factors among extensive preparation parameters and biomass precursors [23-25]. Furthermore, the absence of a clear correlation complicates understanding the active sites responsible for PS activation, hindering BC catalyst design and limiting their use in AOPs.
In this regard, traditional trial-and-error methods in experimental research and quantitative structure-activity relationship (QSAR) models may encounter challenges in addressing such complex interactions [26, 27]. Thus, it is necessary to apply new techniques to guide the optimization of reaction conditions and achieve targeted BC customization for enhancing the degradation of various contaminants [28, 29]. To address this issue, machine learning (ML) has garnered significant attention as a sturdy and adaptable method for handling environmental modeling problems with complex internal correlations [30, 31]. Right now, several BC-based materials with targeted environmental functions have been reported to be designed with the help of ML algorithms [32-34]. For example, Yin et al. [35] discovered key parameters for BC in synergistic mitigation of cadmium and methane in paddy soil and provided guidance and standards for fabricating ideal biochar in practice. However, while model interpretation methods have been utilized to elucidate ML model outcomes, the lack of atomic-level physiochemical information in input features may obscure the underlying reaction mechanisms, limiting our understanding of the chemical space and impeding inverse design for BC-based materials in environmental remediation.
To address this gap, we implemented a chained learning strategy at the atomic level, integrating front-point explainable meta-analysis with back-point density functional theory (DFT) validation. Firstly, front-point analysis unearthed patterns in extended 459 BCE-AOPs dataset records, aiding in nonradical-enhanced BC (NRBC) inverse design insights (Text S1 in Supporting information). Subsequently, DFT-based end-point analysis was conducted to obtain the underlying correlations guiding ML-driven catalyst design and peroxymonosulfate (PMS) treatment performance. Two types of NRBC were inversely designed in two strategies derived from meta-analysis (Text S2 in Supporting information). A degradation experiment without interference by 15 min adsorption was carried out to evaluate the catalytic capacity of NRBCs in activating PMS to degrade sulfathiazole (STZ) (Text S3 in Supporting information). Subsequent investigations were conducted to elucidate the different activation mechanisms between the main NR pathways of NRBCs/PMS systems (Text S4 in Supporting information). Finally, we can obtain two distinct NRBC designs for rapid and selective PMS treatment, along with underlying mechanisms for further development. Altogether, this work not only offers a strategy for selecting and predicting contaminant treatment in heterogeneous catalysis of AOPs, but also reveals the remarkable capability of using computer technology in tandem for accelerating catalyst inverse design.
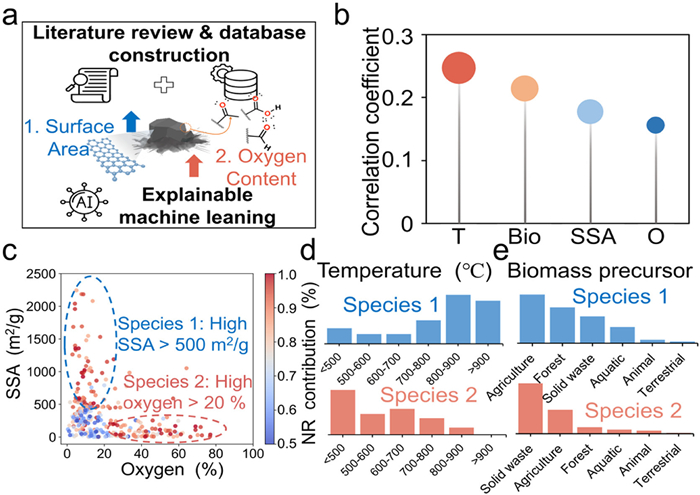
ML identified two targeted modifications of BC that can promote NR pathways in AOPs based on Wang's research [36]: enhancement of the specific surface area (SSA) and oxygen content (O%) of BC (Fig. 1a). To enhance the interpretability of ML model results, at the front point, we employed an explainable meta-analysis with a more accessible and straightforward approach to reinforce and substantiate the ML findings. To identify the features that are most relevant to NR contribution efficiency (as calculated by Eq. 1), we firstly calculated the Spearman correlation coefficients between different BC features and the NR contribution efficiency using the extended BC-AOPs dataset (The data were derived from the literature listed in Table S1 in Supporting information).
NRcontributionefficiency=RMe0HRControl
(1)
where RControl denotes the control removal efficiency (1-Ct/C0) when the BC-AOP system remains unaffected by the quencher upon reaching removal stability, and RMeOH represents the removal efficiency when free radical quenching occurs with MeOH.
Figure 1
Figure 1.
(a) Two strategies for targeted modification of NRBCs derived from ML: enhancing specific surface area (SSA) and oxygen content. (b) Bar chart of Spearman correlation coefficient for the four features most correlated with NR contribution efficiency. (c) Scatter plot of SSA and oxygen content for samples with NR contribution efficiency exceeding 50%. The blue circle indicates that SSA of samples with a high NR contribution efficiency is greater than 500 m2/g (Species 1), while the red circle indicates that oxygen content is greater than 20% (Species 2). (d) Temperature distribution histograms of Species 1 and Species 2. (e) Biomass precursor distribution histograms of Species 1 and Species 2.
As depicted in Fig. 1b, the four most highly correlated features in order are T (pyrolysis temperature), Bio (biomass), SSA, and O%, which were similar to the feature importance results obtained by using the trained XGBoost model [36]. Following the concept of inverse design, we subsequently extracted BC samples exhibiting a NR contribution efficiency exceeding 50% from the extended BC-AOPs dataset, and selectively investigated the characteristics of SSA and O% for these samples (Fig. 1c). The results demonstrated the presence of two distinct species with high NR contribution efficiency. Species 1 demonstrated high SSA (blue circle, SSA > 500 m2/g), while species 2 exhibited high O% (red circle, O% > 20%). This phenomenon could be attributed to the disparity in principles underlying the promotion of NR pathways by these two features. BC with larger SSA can potentially facilitate electron transfer between the pollutants and PMS by offering more spaces and channel for their adsorption and transportation [37]. Differently, BC with higher oxygen content is likely to process higher number of oxygen functional groups, which act as the primary active sites for generating 1O2 [38]. Considering the strong correlation between T and both SSA and oxygen content (Fig. S1 in Supporting information), it is possible to control them by regulating the T during the BC production process. Investigating the T of these two species of BC samples, it was found that the BC samples with high SSA predominantly underwent pyrolysis above 800 ℃, while the BC samples with high oxygen content mainly underwent pyrolysis below 500 ℃ (Fig. 1d). Due to incomplete pyrolysis of biomass at low T may retain more oxygen-containing functional groups, while as T increases the organic components within the biomass are converted to gasses which escape and form more pores [39]. The analysis of biomass precursor types indicated a significant presence of BC derived from agricultural waste in species 1, whereas species 2 predominantly consisted of BC derived from solid waste (Fig. 1e). Thus, we inversely designed two types of NRBC in two strategies: (1) Increasing oxygen content to enhance the contribution of oxygen-containing functional groups at lower T (OBC500); (2) improving SSA at higher T (SBC900).
As depicted in Fig. 2a, both OBC500 and SBC900 demonstrated efficient PMS activation for STZ degradation, resulting in 94.2% and 99.6% removal within 105 mins. Notably, the adsorption capacity of SBC900 increased from 12.8% to 28.6% compared with BC900. This enhancement is associated with the formation of porous structures resulting from the liberation of substantial quantities of gases during the reaction between K2CO3 and carbon at high T, potentially creating favorable conditions for electron transfer [40, 41]. As shown in Fig. S2a (Supporting information), pH exhibited a minor impact on the degradation performance in the OBC500 system. For SBC900, its adsorption capacity varied across distinct pH conditions (Fig. S2b in Supporting information). In Figs. S3 and S4 (Supporting information), NO2+ and SO₄2− exhibited negligible impact on NRBCs' performance, whereas the degradation rate was observed to increase when the concentration of Cl⁻ and HCO2+ was 500 mg/L. This phenomenon may be ascribed to the generation of additional reactive oxygen species (ROS) within the system, such as HCO3•− and HOCl [42].
Figure 2
Figure 2.
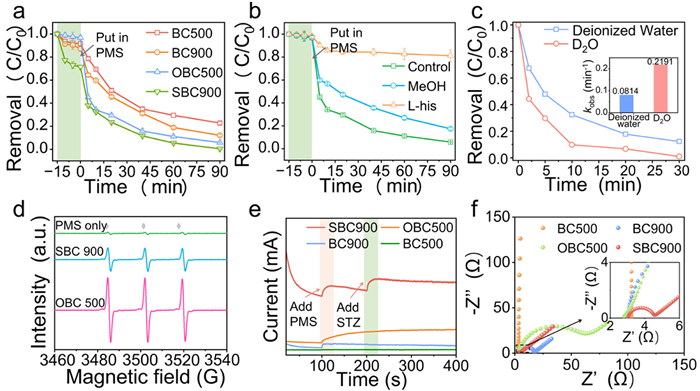
(a) The performance of BC samples. (b) Effects of different scavengers on the performances in OBC500 system for STZ removal ([STZ]0 = 20 mg/L, [catalyst]0 = 20 mg/L, [PMS]0 = 0.80 g/L, initial pH 6.3, [MeOH]0 = 2.6 mol/L, [L-His]0 = 26 mmol/L). (c) Effect of D2O on STZ removal efficiency ([STZ]0 = 20 mg/L, [catalyst]0 = 0.10 g/L, [PMS]0 = 1.6 g/L). (d) ESR spectrum for the detection of TEMP-1O2 in NRBC/PMS system. (e) The i−t curves illustrate the current response when the PMS and STZ are added in NRBC/PMS system. (f) Nyquist plots of electrochemical impedance spectroscopy (EIS) spectra.
Quenching agents were used to distinguish the contribution of NR pathway in NRBC/PMS systems (Fig. 2b and Fig. S5 in Supporting information). Specifically, MeOH was recognized as a potent scavenger capable of quenching both SO4•⁻ and •OH [43], while l-His was employed as a scavenger to investigate the influence of 1O2 [44, 45]. The STZ removal only decreased by 11.5% (OBC500) and 8.9% (SBC900) with MeOH addition, indicating the inferior contribution of radical pathways (SO4•⁻ and •OH) for STZ removal. The NR contribution efficiencies of OBC500 and SBC900 were calculated to be 87.8% and 91.1%, respectively, by Eq. 1, demonstrating the technical feasibility of our inverse design strategies for NRBC. Significantly, in Fig. 2b, the removal of STZ decreased notably by 75.3% with the presence of l-His, indicating that the 1O2 dominated pathway occurred in OBC500/PMS system. To reconfirm this result, we employed D2O instead of deionized water because the longevity of 1O2 was notably prolonged (4.2 μs for H2O and 55 μs for D2O). As depicted in Fig. 2c, the reaction rate constant of STZ in D2O significantly increased by about 169% in comparison to that in deionized water. Differently, in the SBC900/PMS system, the degradation percentage of STZ was reduced by only 25.0% with the presence of l-His (Fig. S5), indicating that the distinct NR activation in SBC900/PMS system.
The reactive species in OBC500 and SBC900 were examined by electron paramagnetic resonance (EPR) spin trapping. To verify the 1O2 contribution, the TEMP was utilized to trap 1O2, producing TEMP-1O2. In Fig. 2d, the signal dramatically increased in the OBC500/PMS system, implying 1O2 was the major contributor, compared to the SBC900/PMS system. Subsequently, the i−t curve was employed to monitor current variations (Fig. 2e), enabling a more comprehensive investigation into the electron transfer pathway's contribution in NRBC/PMS. The findings revealed that in OBC500/PMS system, the currents exhibited only slight changes upon the addition of PMS alone. However, a substantial increase in currents was observed upon the introduction of both PMS and STZ in SBC900/PMS system. Given that neither free radicals nor 1O2 were the primary ROS in the SBC900/PMS system, the i−t curve findings suggested a substantial involvement of the electron transfer process in STZ degradation. To validate this assumption, electrochemical impedance spectroscopy (EIS) was employed to probe the electron conductivity of NRBCs (Fig. 2f). For SBC900, the considerable reduction in the diameter of the semicircle, as compared with OBC500, represented a significantly lower impedance, which is highly advantageous for facilitating efficient charge transfer in AOPs. As shown in Fig. S6 (Supporting information), the linear sweep voltammetry (LSV) plot additionally provided evidence of the electron transfer pathway in the SBC900/PMS system. PMS was adsorbed on the SBC900 surface, forming a metastable surface complex through a redox reaction. Then, SBC900 functioned as an electron mediator to promote the transfer of electrons from the adsorbed pollutants to the activated PMS. In summary, in the OBC500/PMS system, the STZ degradation primarily relied on 1O2, with minor input from other ROS and adsorption. Conversely, the removal of STZ in SBC900/PMS system was predominantly attributed to the electron transfer processes and enhanced adsorption, as the electron transfer process requires the co-adsorption of pollutants and PMS onto the catalyst.
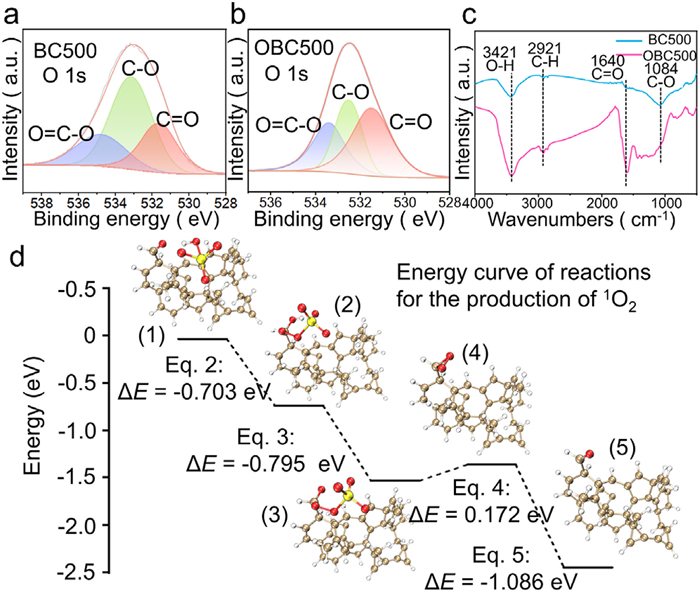
To ascertain the reasons for the differences in main ROS between OBC500/PMS and SBC900/PMS system, a comprehensive investigation was carried out to explore the distinctive characteristics of NRBCs by contrasting them with unmodified BC (BC500 and BC900). The O/C ratio of OBC500 with targeted enhanced oxygen content, increased from 28.54% to 62.70%, implying more oxygen functional groups than BC500 (Fig. S7 in Supporting information). This indicates that the presence of more oxygen-containing groups could be the rational that shifted the reaction pathway from a radical to a non-radical (1O2) mechanism, as evidenced by Fig. S8 (Supporting information). The O 1s spectrum was utilized to specifically investigate the species of oxygen functional groups, with the three peaks at 533.7, 532.6 and 531.7 eV corresponding to O-C=O, C-O and C=O, respectively (Figs. 3a and b) [46]. Compared to BC500, the percentage of C=O in OBC500 increased from 24.24% to 43.10%. In addition, compared the Fourier transform infrared (FTIR) spectrum (Fig. 3c), the peak intensity of OBC500 at 1640 cm-1 increased significantly, further implying a higher C=O content of OBC500. Therefore, the C=O in OBC500 was considered to be a potential active site that can facilitate the generation of 1O2 through PMS decomposition.
Figure 3
Figure 3.
The O 1s spectrum of (a) BC500 and (b) OBC500. (c) The FTIR spectrum of BC500 and OBC500. (d) Specific steps of PMS decomposition, accompanied by the corresponding energy curves. The color representation indicates the presence of hydrogen, carbon, oxygen and sulfur atoms, respectively, as white, tan, red and yellow.
At the end point, DFT calculations were further carried out to electronically unveil the activation ability of C=O in OBC500 for accelerating 1O2 production (Text S5 in Supporting information). Therefore, we established two molecular models (i.e., amorphous carbon clusters (AC) and AC-C=O). The C=O rich OBC500 was denoted as AC-C=O. The optimized configurations are shown in Fig. S9 (Supporting information). Firstly, the electrostatic potential (ESP) in Fig. S10 (Supporting information) was calculated to inspect the electronic distribution of AC and AC-C=O. In contrast to AC, the negative charge of AC-C=O was centralized on C=O, suggesting a potential active site for PMS to adsorb and generate 1O2 to degrade the organics. It is widely reported that the production of 1O2 promoted by C=O was going through a series of reactions shown in Eqs. 2-5 [47, 48]. Therefore, DFT models were constructed to validate the thermodynamic rationality (Fig. 3d). The initial stage of the process involved the adsorption of the PMS molecule onto the C=O group. Subsequently, the reaction in Eq. 2 took place, releasing an exothermic energy of 0.703 eV, which encouraged the creation of intermediate (1), in which the H atom of PMS molecule was token by the long pair of C=O group. The intermediate (2), as a Lewis acid site, was unstable and readily reacted with OH- in the aqueous medium, yielding intermediate (3), which released 0.795 eV energy (Eq. 3). In intermediate (3), the O-O bond of the *SO5− moiety underwent intramolecular cleavage, resulting in the production of dioxirane intermediate (4) and a free SO42− ion (Eq. 4), which had an endothermic energy of 0.172 eV. Within an exothermic process of 1.086 eV, the intermediate (4) might swiftly react with free SO52− ion in water to form 1O2 and then reduce to the original C=O group (Eq. 5). Furthermore, the slight 0.172 eV endothermic of Eq. 4 was also thermodynamically viable and could be considered as the rate-determining step in the generation of 1O2. The overall exothermic energy of 2.412 eV implied that 1O2 might be readily produced through the interaction between PMS and the BC containing C=O group.
(2)
(3)
(4)
(5)
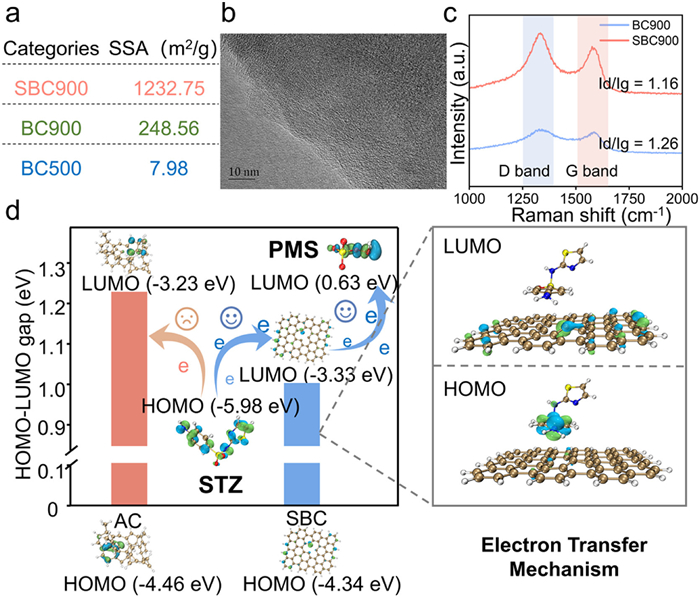
To figure out the other mechanism of SSA enhancement in promoting NR pathway, we conducted a detailed investigation of SBC900. The Brunauer-Emmett-Teller (BET) and transmission electron microscopy (TEM) were conducted to study the SSA and graphitization of BC samples. According to the BET results (Fig. 4a), the SSA of BC900 (248.56 m2/g) was larger than that of the original BC500 (7.98 m2/g). As the T increased, the SSA raised significantly, which is consistent with the conclusion of ML and meta-analysis. Importantly, after the salt fusion treatment (K2CO3), the specific surface area of SBC900 increased to 1232.75 m2/g. Fig. S11 (Supporting information) shows a negative correlation between the SSA and the charge transfer resistance (Rct) calculated from EIS tests, suggesting a significant shift toward an electron transfer-dominated reaction. This is likely due to the combination of high T and molten salt generating a substantial number of pores and an excellent degree of graphitization. Fig. 4b indicated an obvious sheet structure in SBC900, compared to TEM image of original BC900 (Fig. S12 in Supporting information). To evaluate the graphitic and defect levels, Raman spectra was performed. As shown in Fig. 4c, the peaks at 1340 cm-1 and 1580 cm-1 were considered as D band and G band, representing defects and graphitization degree, respectively. Compared to BC900, the intensity of G band and D band of SBC900 both enhanced, indicating that SBC900 had higher graphitic and defect level.
Figure 4
Figure 4.
(a) The SSA of BC500, BC900 and SBC900. (b) Transmission electron microscopy (TEM) image of SBC900. (c) Raman spectra of BC900 and SBC900. (d) Schematic illustration of electron migration in SBC and AC.
To confirm the electron transfer mechanism of SBC900 in PMS activation, we established a highly graphitic but defective SBC model to represent SBC900. The ESP of SBC (Fig. S13 in Supporting information) indicated that the electrons were uniformly distributed on the graphitic carbon region, attributing the conjugated π system, ensuring SBC as an efficient mediator for electron migration. Concurrently, the defect sites exhibited an unsaturated structure on the vacancy to produce a long-pair electron, making it an active site for PMS adsorption. Density of states (DOS) of SBC900 and AC in Fig. S14 (Supporting information). Compared with AC, SBC showed a narrower energy gap, which means that its catalytic ability can be improved with the increase of graphitization degree. Fig. 4d shows the whole electron transfer process during the PMS activation of STZ degradation. The electrons located in the highest occupied molecular orbital (HOMO, −5.98 eV) of STZ molecule can be easily transferred to the lowest unoccupied molecular orbital (LUMO, 0.63 eV) of the graphite-like structure in SBC900. Since SBC900 had a smaller HOMO-LUMO energy gap, it was easier for the electrons to cross the energy gap and migrate to HOMO. Then, driven by the energy difference, the electrons will be further transferred to the metastable PMS* reaction complex adsorbed on SBC900, eventually triggering the PMS decomposition process. Thus, the principal rationale behind the promotion of NR pathway by SBC900 can be attributed to its exceptional graphitized structure, which reduced the HOMO-LUMO energy gap and facilitated the electron transfer on its surface.
In this work, we employed a comprehensive chained learning strategy to validate the feasibility of ML-guided NRBC inverse design, spanning from explainable meta-analysis for BC inverse design at the front-point to DFT calculations for mechanism revealing at the end-point, bridging from macroscopic statistical perspectives to atomic-level mechanistic interpretations. At the front point, by analyzing an extended BC-AOPs dataset, we confirmed two ML-suggested strategies: (1) Increasing oxygen content at lower T (OBC500; (2) improving SSA at higher T (SBC900). Subsequently, the primary degradation pathways of OBC500 and SBC900 were empirically confirmed to entail the generation of 1O2 and electron transfer, respectively. At the end point, DFT calculations at the atomic level highlighted the impact of oxygen functional clusters in OBC500 and the efficient electron transfer in SBC900, shedding light on their respective pathways in AOPs. This chained learning strategy elucidated the fundamental principles of ML and enhanced reliability of ML in specific material design domains.
Declaration of competing interest
The authors declare that they have no known competing financial interests or personal relationships that could have appeared to influence the work reported in this paper.
CRediT authorship contribution statement
Honglin Chen: Writing – original draft, Methodology, Investigation, Formal analysis, Data curation, Conceptualization. Rupeng Wang: Writing – original draft, Resources, Methodology, Conceptualization. Zixiang He: Investigation, Data curation. Shih-Hsin Ho: Writing – review & editing, Supervision, Funding acquisition, Formal analysis, Conceptualization.
Acknowledgment
This work was financially supported by Project of National and Local Joint Engineering Research Center for Biomass Energy Development and Utilization (Harbin Institute of Technology, No. 2021A004).
Supplementary materials
Supplementary material associated with this article can be found, in the online version, at doi:10.1016/j.cclet.2025.111372.
B. Huang, J. Jiang, G. Huang, et al., J. Mater. Chem. A 6 (2018) 8978. doi: 10.1039/C8TA02282H
[48]
H. Meng, C. Nie, W. Li, et al., J. Hazard. Mater. 399 (2020) 123043.
Figure 1
(a) Two strategies for targeted modification of NRBCs derived from ML: enhancing specific surface area (SSA) and oxygen content. (b) Bar chart of Spearman correlation coefficient for the four features most correlated with NR contribution efficiency. (c) Scatter plot of SSA and oxygen content for samples with NR contribution efficiency exceeding 50%. The blue circle indicates that SSA of samples with a high NR contribution efficiency is greater than 500 m2/g (Species 1), while the red circle indicates that oxygen content is greater than 20% (Species 2). (d) Temperature distribution histograms of Species 1 and Species 2. (e) Biomass precursor distribution histograms of Species 1 and Species 2.
Figure 2
(a) The performance of BC samples. (b) Effects of different scavengers on the performances in OBC500 system for STZ removal ([STZ]0 = 20 mg/L, [catalyst]0 = 20 mg/L, [PMS]0 = 0.80 g/L, initial pH 6.3, [MeOH]0 = 2.6 mol/L, [L-His]0 = 26 mmol/L). (c) Effect of D2O on STZ removal efficiency ([STZ]0 = 20 mg/L, [catalyst]0 = 0.10 g/L, [PMS]0 = 1.6 g/L). (d) ESR spectrum for the detection of TEMP-1O2 in NRBC/PMS system. (e) The i−t curves illustrate the current response when the PMS and STZ are added in NRBC/PMS system. (f) Nyquist plots of electrochemical impedance spectroscopy (EIS) spectra.
Figure 3
The O 1s spectrum of (a) BC500 and (b) OBC500. (c) The FTIR spectrum of BC500 and OBC500. (d) Specific steps of PMS decomposition, accompanied by the corresponding energy curves. The color representation indicates the presence of hydrogen, carbon, oxygen and sulfur atoms, respectively, as white, tan, red and yellow.
Figure 4
(a) The SSA of BC500, BC900 and SBC900. (b) Transmission electron microscopy (TEM) image of SBC900. (c) Raman spectra of BC900 and SBC900. (d) Schematic illustration of electron migration in SBC and AC.

 DownLoad:

 下载:
下载:


