ROS-sensitive dihydroartemisinin prodrug amplify chemo-immunotherapy efficacy of doxorubicin by coordinating robust tumor cell immunogenic cell death and PD-L1 blockade
Citation:
Xiaopeng Han, Jiayin Li, Fei Li, Zhongyue Yuan, Hao Li, Lei Yang, Yan-Ming Xia, Chao Teng, Chao Qin, Lifang Yin. ROS-sensitive dihydroartemisinin prodrug amplify chemo-immunotherapy efficacy of doxorubicin by coordinating robust tumor cell immunogenic cell death and PD-L1 blockade[J]. Chinese Chemical Letters,
2026, 37(2): 111335.
doi:
10.1016/j.cclet.2025.111335
ROS-sensitive dihydroartemisinin prodrug amplify chemo-immunotherapy efficacy of doxorubicin by coordinating robust tumor cell immunogenic cell death and PD-L1 blockade
English
ROS-sensitive dihydroartemisinin prodrug amplify chemo-immunotherapy efficacy of doxorubicin by coordinating robust tumor cell immunogenic cell death and PD-L1 blockade
Department of Pharmaceutics, China Pharmaceutical University, Nanjing 210009, China
b.
Department of Industrial and Molecular Pharmaceutics, Purdue University, West Lafayette, IN 47907, United States
c.
Key Laboratory of Drug Quality Control and Pharmacovigilance, China Pharmaceutical University, China; State Key Laboratory of Natural Medicine, China Pharmaceutical University, Nanjing 210009, China
d.
School of Pharmacy, Fujian Medical University, Fuzhou 350122, China
e.
Fujian Key Laboratory of Natural Medicine Pharmacology, School of Pharmacy, Fujian Medical University, Fuzhou 350122, China
lifangyin_@163.com (L. Yin). 1 These authors contributed equally to this work.
Received Date:
18 February 2025 Accepted Date:
15 May 2025 Revised Date:
15 May 2025 Available Online:
15 February 2026
Abstract:
Doxorubicin (DOX) is known to elicit potent antitumor immune responses through the induction of immunogenic cell death (ICD). However, its therapeutic efficacy is undermined by the adaptive upregulation of programmed cell death ligand 1 (PD-L1), which hijacked the antitumor immunity. In this study, we developed a reactive oxygen species (ROS)-responsive dihydroartemisinin (DHA) prodrug to facilitate the delivery of DOX via hydrophobic and electrostatic interactions. Upon internalization by tumor cells, the nanoparticles (NPs) preferentially accumulated in endoplasmic reticulum (ER), exacerbating ER stress and amplifying ICD to enhance tumor immunogenicity. Simultaneously, the oxidative intracellular environment trigged the degradation of NPs, releasing DHA, which downregulated PD-L1 by disrupting signal transducer and activator of transcription 3 (STAT3) phosphorylation and inactivating the nuclear factor kappa-B (NF-κB) pathway. Consequently, the effective PD-L1 blockade and robust ICD response, synergistically inhibited breast cancer progression, significantly enhancing the chemo-immunotherapy efficacy of doxorubicin.
Cancer immunotherapy, represented by T cell transfer therapy, immune checkpoint inhibitors, cancer vaccines and cytokine therapy, utilizes the patient's immune system to target and eliminate tumor cells. It is often used in combination with other therapies in clinic. For example, radiation therapy [1,2], photodynamic therapy [3–6], and some chemotherapeutic agents including doxorubicin, mitoxantrone, paclitaxel, oxaliplatin, and molecular targeted therapies such as crizotinib exhibit potent antitumor immune responses by inducing immunogenic cell death (ICD) [7–11]. Treatment with ICD inducers causes damaged tumor cells released immunostimulatory danger signals such as high mobility group box 1 (HMGB1), calreticulin (CRT), and adenosine triphosphate (ATP). These signals activated dendritic cells (DCs) and promoted the infiltration of cytotoxic T lymphocytes (CTLs) into tumor tissue. However, there are growing evidence that doxorubicin (DOX)-induced immune responses are often compromised by immunosuppression like upregulating programmed death ligand-1 (PD-L1) expression [12–14].
To address this concern, one effective strategy is to reduce PD-L1 expression in cancer cells using microRNA or a small-molecule PD-L1 inhibitor. For example, Cao and colleagues developed nanoparticles (NPs) consisting of poly(D, L-lactide-co-glycolide) (PLGA) NP bearing polyethyleneimine and folate receptor-targeted PEGylated PLGA NP to co-deliver miR-200c and DOX. This co-delivery system not only suppressed PD-L1 expression, but also triggered ICD in MC38 cell lines [15]. Similarly, Liu and colleagues developed a liposome that encapsulated both JQ1 and DOX. This liposome effectively inhibited the growth of B16-F10 tumors in mice by blocking the PD-L1 pathway through the downregulation of CD274 transcription [16]. Sun and colleagues developed a porous oxaliplatin cross-linked polydopamine NP for loading small interfering RNA targeting programmed cell death-ligand 1 (siPD-L1) to construct multifunctional nanoplatform, which improved the bioavailability of siPD-L1 [17]. Another alternative strategy involves targeting specific sites on PD-L1 to prevent its interaction with PD-1. Zhu et al. and Zhou et al. found that PDL1 was reduced by metformin (Glucophage) and tamoxifen through activating adenosine 5′-monophosphate activated protein kinase (AMPK), respectively [18,19]. Zhang et al. employed lipid/PLGA nanocomplexes to deliver DOX and peptide P-12. These nanocomplexes induced both ICD and PD-L1 blockade in CT26 cancer cells [20]. However, simply encapsulating siRNA or PD-L1 inhibitor into these carriers may result in limited drug-loading capacity and an increased risk of premature cargo release [21].
To overcome these challenges, various stimulus-sensitive prodrug self-assembly systems have been developed. These systems utilized stimulators in the tumor microenvironment to trigger spatiotemporal payload release [22–25]. Further, compared to liposomes or nanocomplexes, stimulus-responsive prodrug self-assemblies offered a higher drug loading capacity [26]. For example, we reported reactive oxygen species (ROS)-sensitive prodrug nanoassemblies based on a thioether bond-bridged dihydroartemisinin-paclitaxel prodrug, which achieved a high drug loading of 64.46% and showed efficacy against 4T1 cell lines [27].
Dihydroartemisinin (DHA), an active derivative of artemisinin, exhibits numerous anticancer effects, including inhibiting proliferation, inducing apoptosis, and suppressing tumor metastasis and angiogenesis through Janus kinase-signal transducer and activator of transcription (JAK-STAT) signaling and nuclear factor kappa-B (NF-κB)-dependent pathways [28,29]. These pathways are crucial in regulating PD-L1 expressing in tumor cells [30,31]. Additionally, Duan and colleagues found that DHA exhibited synergy with oxaliplatin in generating ROS, thereby enhancing the ICD effect of oxaliplatin [32]. However, to our knowledge, whether DHA can amplify the ICD effect of DOX remains unknown.
In this study, we developed a novel ROS-responsive DHA prodrug to enhance the efficacy of DOX-based chemo-immunotherapy. This prodrug is designed to robust ICD in tumor cells and block PD-L1 expression. The nanocarrier encapsulated DOX via hydrophobic and electrostatic interactions. Upon entering tumor cells, the NPs selectively accumulated in the endoplasmic reticulum (ER), intensifying ER stress and leading to the release of damage-associated molecular patterns (DAMPs) to induce ICD, thereby enhancing tumor immunogenicity. Simultaneously, the released DHA blocked PD-L1 by disrupting STAT3 phosphorylation and inactivating NF‐κB pathway, resulting in PD-L1 downregulation. Consequently, the combined PD-L1 blockade and robust ICD response synergistically suppressed breast cancer malignant growth, thereby enhancing the chemo-immunotherapy efficacy of DOX.
The oxidation-sensitive prodrug of DHA (DSD) was synthesized by conjugating thioketal (TK) to DHA through an ester bond, confirmed by 1H nuclear magnetic resonance spectroscopy (NMR) spectroscopy. As shown in Fig. S3 (Supporting information), the peaks of 5.54 ppm (R1O—CH—OR2), 5.68 ppm (-CH—OR3) corresponded to DHA [27], while the peak at 2.79 ppm (-S-CH2-) was characteristic of TK [33]. Furthermore, as demonstrated in Fig. S4 (Supporting information), the generation of DSD was also indicated by the peak at m/z 807.34 (m/z, [M+Na]+) and peak at m/z 823.31 (m/z, [M + K]+). Additionally, the structure of non-oxidation-sensitive prodrug DHA (DCD) was synthesized by conjugating sebacoyl dichloride to DHA through an ester bond. The structure of DCD was confirmed by 1H NMR and mass spectrometry (MS) (Figs. S5 and S6 in Supporting information). In summary, these results demonstrated the successful synthesis of the prodrugs.
According to Table S1 (Supporting information), the feeding rate ratio of DOX and DCD/DSD significantly influenced the encapsulation efficiency, drug loading, size and stability of the NPs. As the feed ratio of DOX and DHA (DCD/DSD), increased from 1:0.5 to 1:2 (w/w), the size of the NPs increased from 130 nm to 190 nm. However, after 24 h, the NPs with DCD/DSD at 1:2 (w/w) precipitated. Whereas those NPs with a ratio of DOX and DCD/DSD at 1:0.5 (w/w) remained stable with minimal changes. Consequently, the optimal feed ratio of DOX and DHA (DCD/DSD) was fixed at 1:0.5 (w/w).
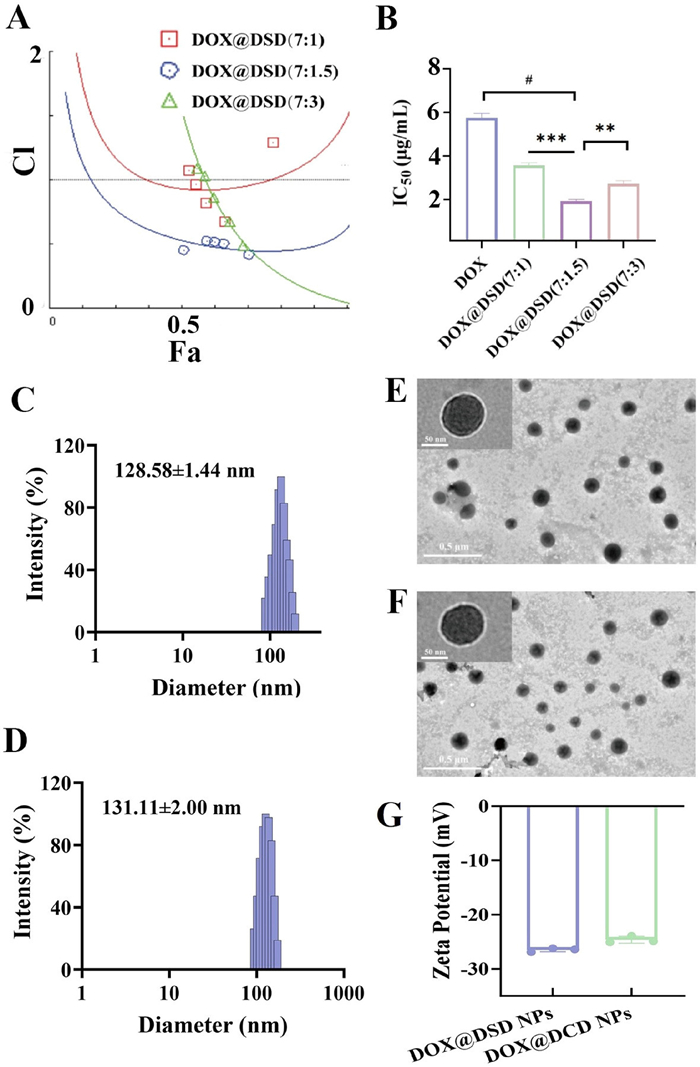
Furthermore, the cytotoxicity of free DOX and DSD molecules was evaluated using the MTT assay on 4T1 cells. It was observed that the combined potency of DOX and DSD gradually increased as the weight ratio of DSD/DOX increased. Moreover, the lowest combination index (CI) observed at DOX/DSD of 7:1.5, equivalent to a 1:0.5 feed ratio (Figs. 1A and B). Fresh prepared NPs tended to precipitate in 10% fetal bovine serum (FBS), thus in this study 1,2-distearoyl-sn–glycero-3-phosphoethanolamine-poly(ethylene glycol)2000 (DSPE-MPEG2000) served as a stabilizer, enhancing tumor specificity and pharmacokinetics [23].
Figure 1
Figure 1.
Characterization of DOX@DSD NPs and DOX@DCD NPs. (A) Fa-CI plot of DOX and DSD at different combined ratios. (B) half maximal inhibitory concentration (IC50) of DOX and DSD with different combined ratio. The size by intensity (C), transmission electron microscope (TEM) images (E) and zeta potential (G) of DOX@DSD NPs. The size by intensity (D), TEM images (F) and zeta potential (G) of DOX@DCD NPs. Scale bar: 500 nm, insert bar: 50 nm. Data are presented as mean ± standard deviation (SD) (n = 3). **P < 0.01, ***P < 0.001, #P < 0.0001.
Table S2 (Supporting information) showed that increasing the feed ratio of DOX to DSPE-MPEG2000 from 1:0.5 to 1:2 resulted in higher encapsulation efficiency and drug loading for DOX, DCD, and DSD, particularly for DCD and DSD. Notably, the average drug loading of DSD reached 19.23% ± 0.44% when the ratio of DOX, DSD and DSPE-MPEG2000 was fixed at 1:0.5:1, similar to the ratio of at 1:0.5:2. Therefore, for this study, the feed ratio of DOX, DSD/DCD, and DSPE-MPEG2000 was set at 1:0.5:1.
As demonstrated in Figs. 1C–F, the particle sizes of the DOX@DCD NPs and DOX@DSD NPs had a diameter around 130 nm by dynamic light scattering analysis, most of NPs kept spherical shape by transmission electron microscopy observed, and negative zeta potential around −25 mV (Fig. 1G). Moreover, DOX@DCD NPs and DOX@DSD NPs maintained stable in phosphate buffered saline (PBS) and DMEM medium containing 5% FBS (Figs. S7 and S8 in Supporting information). In contrast, the sizes of DOX@DCD NPs and DOX@DSD NPs sharply increased in the presence of urea and SDS (Fig. S9 in Supporting information), suggesting that both hydrophobic and electrostatic interaction contributed to their co-assembly [34].
Additionally, after incubating with 10 mmol H2O2, DOX@DSD NPs became fragmented, while DOX@DCD NPs retained their spherical shape, indicating that DOX@DSD NPs degraded in the oxidation environments (Fig. S10 in Supporting information). The release rates of DOX and DHA from DOX@DSD NPs were influenced by the concentration of H2O2. However, H2O2 concentration did not significantly affect the release rate of DHA from DOX@DCD NPs (Figs. S11 and S12 in Supporting information). These findings suggested that DSD and DOX cloud self-assemble into NPs with desirable drug loading, and that oxidation environments in tumor microenvironment triggered spatiotemporal payload release.
The in vitro cytotoxicity of the DHA prodrug and DHA-containing NPs in 4T1 and MCF-7 cell lines was evaluated by MTT assay. As shown in Fig. S13 (Supporting information), both DSD and DCD exhibited concentration-dependent cytotoxicity. Due to the rapid bioactivation of the free active molecules, DSD demonstrated greater effectiveness in killing tumor cells compared to DCD [35,36]. Moreover, prodrug-containing NPs showed superior inhibition of 4T1 cells viability in vitro compared to the free drug treatments, attributable to enhanced cellular uptake. While prodrug-containing NPs exhibited weaker inhibition of NIH3T3 cell viability in vitro compared to free drug treatments, this suggests that prodrug-containing NPs are more biocompatible with normal cells.
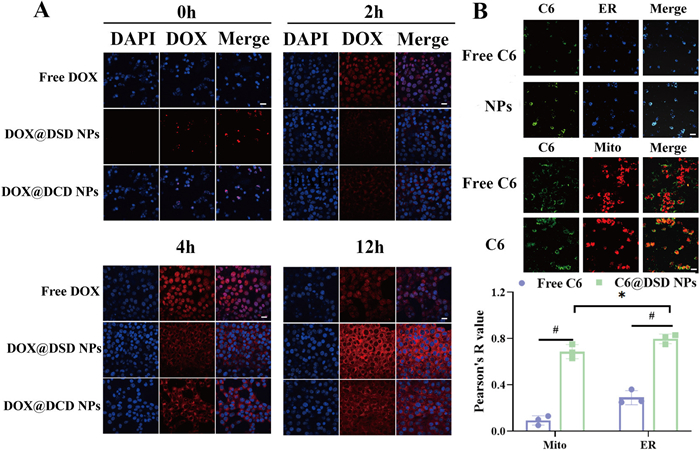
Furthermore, the endocytosis of NPs in 4T1 cell was investigated by confocal laser scanning microscope (CLSM) and flow cytometry. Flow cytometry analysis confirmed that the cellular uptake of the NPs was time-dependent. For example, with DOX@DSD NPs, the mean fluorescent intensity in 4T1 cells increased from 2000 a.u. to 7000 a.u. as the incubation time increased from 2 h to 12 h (Fig. S14 in Supporting information). Moreover, shown in Fig. 2A, after 12 h of incubation, the fluorescence intensity observed in 4T1 cells treated with free DOX was relatively weak. However, cells incubated with DOX@DSD NPs and DOX@DCD NPs exhibited significantly higher intracellular fluorescence intensity, indicating efficient cellular internalization of the NPs.
Figure 2
Figure 2.
Cellular uptake and ER targeting. CLSM (A) measurements of DOX@DSD NPs or DOX@DCD NPs incubated with 4T1 cells for 12 h. DAPI: 4′,6-diamidino-2′-phenylindole. Scale bar: 50 µm. (B) Colocalization fluorescence images of C6@DSD NPs with different organelle-trackers. Scale bar: 50 µm. Data are presented as mean ± SD (n = 3). #P < 0.0001.
Additionally, after 12 h of incubation, DOX@DSD NPs primarily localized around the nucleus in 4T1 cells (Fig. 2A). We further investigated the intracellular trafficking of the NPs using commercial organelle-specific strain probes. Colocalization assay displayed that DOX@DSD NPs strongly overlapped with ER-Tracker blue, as evidenced by a high Pearson's correlation coefficient (PCC: 0.78 ± 0.01; Fig. 2B), while only partially colocalizing with MitoTracker Deep Red. These results indicated that DOX@DSD NPs could target ER and facilitate inducing ICD.
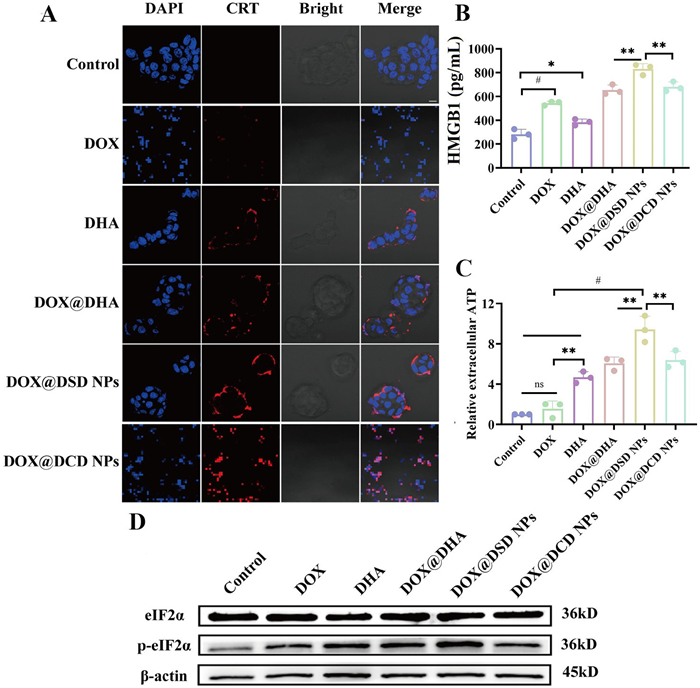
ICD was triggered by the exposure of CRT on the cell surface and the release of activated HMGB-1 and ATP. As displayed in Figs. 3A–C, compared to the control group (PBS), DOX increased CRT translocation and enhanced HMGB1 and ATP release from 4T1 cells, confirming its role as an ICD inducer [37]. Moreover, DHA@DOX exhibited significantly higher ATP release and CRT exposure than free DOX and DHA, indicating that the combination of DOX and DHA induced a synergistic ICD effect. Additionally, compared to the DOX@DCD NPs group, the release of ATP and HMGB1 from 4T1 cells were significantly increased in the DOX@DSD group (Figs. 3B and C).
Figure 3
Figure 3.In vitro ICD assay. (A) Immunofluorescence images of CRT exposure on 4T1 cells. Scale bar: 20 µm. (B, C) The contents of HMGB1 and ATP in the 4T1 cell culture media. (D) Representative WB images of eIF2α and p-eIF2α in 4T1 cells. Data are presented as mean ± SD (n = 3). P < 0.05, **P < 0.01, #P < 0.0001.
ER stress was reported to be involved in ICD induction [38,39]. Therefore, we further investigated the activation of the ER stress-related proteins like eukaryotic initiation factor 2 alpha (eIF2α). The Western blot (WB) analysis released that DHA@DOX, increased the expression of phospho-eIF2α (p-eIF2α), indicating stronger ER stress. Additionally, among the five drug treatment groups, DOX@DSD NPs were the most effective in promoting the phosphorylation of eIF2α (Fig. 3D and Fig. S15 in Supporting information), with a p-eIF2α/eIF2α expression ratio of approximately 0.9. This led to more pronounced ER stress, increased CRT exposure, and elevated secretion of ATP and HMGB-1. These results suggested that DHA enhanced the DOX's ability to induce ICD effect, especially with DOX@DSD NPs, likely due to the efficient internalization of DOX@DSD NPs into tumor cells and rapid release free DHA.
To evaluate whether DOX@DSD NPs could activate and induce the maturation of DC2.4 cells, we incubated DC2.4 cells with tumor-culture conditioned medium from 4T1 cells treated with PBS, DOX, DHA, DHA@DOX, DOX@DSD NPs and DOX@DCD for 24 h. The expression of CD86 and CD80 on DC2.4 cells was measured via flow cytometry. As shown in Fig. S16 (Supporting information), the supernatants of the 4T1 cells treated with DOX@DHA effectively activate DC2.4 cell, upregulating the costimulatory molecules CD80 and CD86 on DCs, DOX@DSD NPs treatment of 4T1 cells significantly increased DC maturation (CD86+CD80+ cells) to 18.10%, compared to 4.6% in the DOX. These results indicated that the co-loaded system could lead to a synergistic ICD effect, attributed to the complementary and additive effects of DHA.
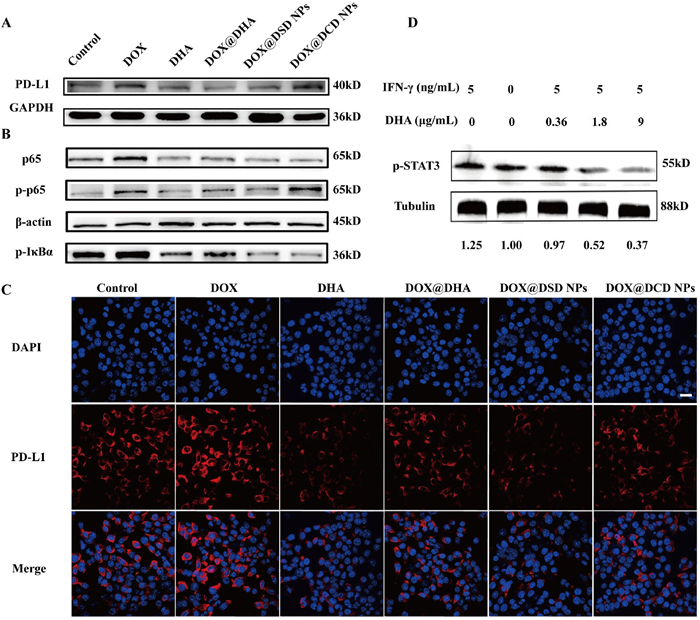
During treatment, DOX can transform dying cancer cells into potent "vaccines" that activate immune system against cancer. However, the immune response elicited by DOX can be compromised by the upregulation of immunosuppression-related factors such as PD-L1 [12–14]. To further investigate this phenomenon, 4T1 cells were treated with a series of formulations of DOX, and PD-L1 protein expression was detected by WB and CLSM. As shown in WB image (Fig. 4A and Fig. S17 in Supporting information), treatment with free DOX resulted in an approximate 0.5-fold increase in PD-L1 expression. In contrast, the combination of free DOX and DHA reduced PD-L1 expression to levels comparable to those in PBS-treated group, indicating that DHA effectively suppressed PD-L1 expression. Furthermore, treatment with DOX@DSD NPs resulted in a significant decrease of approximately 50% in PD-L1 expression compared to the PBS-treated group. CLSM analysis also revealed that DHA remarkably reduced PD-L1 expression on the surface of 4T1 cells, especially for DOX@DSD NPs (Fig. 4C).
Figure 4
Figure 4.
Reversion of immunosuppression from PD-L1 in vitro. (A) Representative WB images of PD-L1 expressions in 4T1 cells. GAPDH, glyceraldehyde-3-phosphate dehydrogenase. (B) Representative WB images of protein related NF-κB pathway in 4T1 cells. (C) Representative immunofluorescence images of PD-L1 exposure on 4T1 cells. Scale bar: 20 µm. (D) Representative WB images of p-STAT3 in 4T1 cells.
Next, we explored the mechanism by which DHA suppressed PD-L1 expression on cancer cell surfaces. On the one hand, various chemotherapy drugs such as gemcitabine, paclitaxel, carboplatin, and irinotecan have been reported to upregulate PD-L1 expression via NF-κB pathway in various types of tumors [39–41]. To assess the impact of DOX on the activation of the NF-κB pathway, 4T1 cells were treated with different formulations for 24 h and analyzed by WB. Treatment with free DOX induced activation of NF-κB, characterized by the increased expression p-p65 and p-NF-κB inhibitor alpha (p-IκBα) (Fig. 4B). In contrast, treatment with DOX/DSD NPs inhibited NF-κB pathway activation, leading to a decrease in the expression of p-p65 and p-IκBα (Fig. S18 in Supporting information), suggesting that DHA played a role in attenuating PD-L1 levels through the NF-κB pathway.
On another hand, activated T cells released interferon-γ (IFN-γ), which not only targeted and eliminated tumor cells, but also increased PD-L1 levels on the tumor membrane [42–44]. The primary pathway involved in IFN-γ-induced PD-L1 expression on the tumor membrane was the JAK/STAT pathway [45]. We examined whether DHA-containing formulations affected STAT3 expression in 4T1 cells. After co-culturing with different formulations and IFN-γ for 24 h, STAT3 levels in 4T1 cells were analyzed by WB. As shown in Fig. 4D and Fig. S19 (Supporting information), increasing the concentrations of DHA resulted in decreased levels of phosphorylated STAT3. At a concentration of DHA increased to 1.8 µg/mL, phosphorylated STAT3 levels fell to half those of the PBS-treated group. In contrast, treatment with 0.36 µg/mL of DHA resulted in phosphorylated STAT3 levels similar to those of the PBS-treated group. Furthermore, as shown in Fig. S20 (Supporting information), treatment with DOX/DSD and DOX/DCD NPs significantly reduced phosphorylated STAT3 levels to 40.2% and 61.1%, respectively. Taken together, these results indicated that PD-L1 expression can be suppressed by DHA containing formulations.
To determine the optimal dose of DOX@DSD NPs for inducing ICD. The response of tumor and immune-associated cells was assessed after intravenous injection of DOX@DSD NPs in 4T1 tumor-bearing mice. All animal procedures were approved by the Animal Ethics Committee of China Pharmaceutical University (No. 2023–06–005). When the tumor volume reached approximately 50–100 mm3, mice were intravenously administered three different doses of DOX@DSD NPs: 1.25 mg/kg (low), 2.5 mg/kg (mid), or 5 mg/kg (high) of DOX, every 3 days for a total of six treatment cycles. As described in Fig. S21 (Supporting information), the administration of DOX@DSD NPs with a DOX dose of 5 mg/kg did not effectively suppress tumor growth compared to the PBS group. However, when administered at a dose of 2.5 mg/kg, DOX@DSD NPs significantly slowed down tumor growth. Four days after the final treatment, mice were euthanized, and tumor sections were analyzed using immunofluorescence staining. Tumors treated with the mid dose of DOX@DSD NPs exhibited a significant increase in CRT and HMGB1 levels in the tumor microenvironment, with CRT levels 2.0-fold higher compared to tumors treated with the other doses (Figs. S22 and S23 in Supporting information), indicating a dose-dependent induction of ICD.
It has been reported that the ICD promotes the recruitment of CD8+ T cells, lymphocytes were further analyzed to assess the activation of the antitumor immune response. As displayed in Figs. S22 and S23, mice treated with DOX@DSD NPs at a dosage of 2.5 mg/kg of DOX exhibited a significantly higher proportion of CD8+ T cells, indicated by strong green signal intensity. In contrast, mice treated with 5 mg/kg of DOX showed almost no green signal in the tumor bed. Moreover, the population of regulatory T cells (Tregs) was reduced in the mice treated with the medium dose of DOX@DSD NPs compared to those in the PBS, low, or high dose groups, as indicated by cells with brown coloration. Therefore, a dose of 2.5 mg/kg of DOX was selected for further in vivo studies with the DOX@DSD NPs formulation.
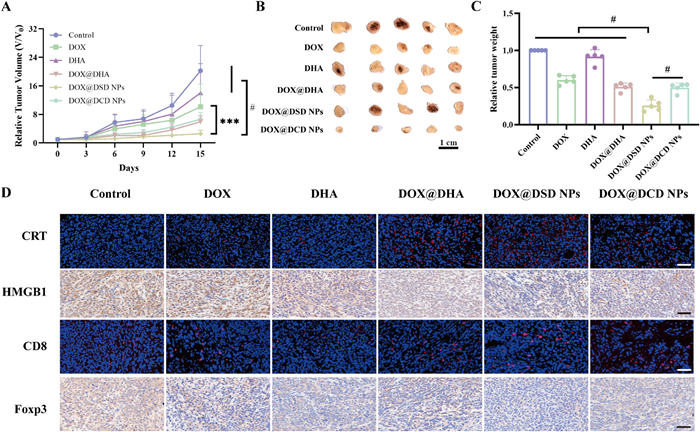
The therapeutic efficacy of different formulations was further evaluated in a 4T1 tumor-bearing mice model. Mice were treated every three days with PBS (control), DOX solution, DHA solution, DOX@DHA, DOX@DSD NPs, and DOX@DSD NPs, each at a dose of 2.5 mg/kg DOX or 0.54 mg/kg DHA, respectively. As depicted in Fig. 5A, the free drugs (DOX solution and DHA solution) showed only a minor delay in tumor growth. In contrast, the combination of DOX and DHA solution moderately inhibited tumor growth. After treatment, tumors were collected and weighed, revealing that DOX@DSD NPs achieved a tumor inhibitory rate of nearly 80% compared to the control group (Figs. 5B and C). Additionally, histological analysis of hematoxylin and eosin (H&E) and terminal dUTP nick end labeling (TUNEL) assay images of tumor sections indicated that DOX@DSD NPs treatment led to increased necrotic areas and a higher number of apoptotic cells compared to the other formulations (Fig. S24 in Supporting information).
Figure 5
Figure 5.
Antitumor study in vivo. (A) Tumor volume record during the treatment. (B, C) The images and weight of tumors in each group after different treatments. (D) Typical fluorescence images of CRT exposure, HMGB1 release, CD8 and Foxp3. Scale bar: 50 µm. Data are presented as mean ± SD (n = 5). ***P < 0.001, #P < 0.0001.
The underlying mechanism of antitumor activity was explored by analyzing immune profiles in the tumor-draining lymph node (TDLN) and tumor microenvironment. As shown in Fig. 5D, all treatment formulations induce ICD by increasing the CRT exposure and promoting the release of HMGB1 compared to the control group. Among the five drug-treatment groups, DOX@DSD NPs exhibited the most potent ICD effect.
Moreover, whether the ICD elicited DCs maturation in the TDLNs was detected using immunofluorescence (Fig. S25 in Supporting information). The overlap of green (CD86), red (CD80), and cyan (CD11c) fluorescence, resulting in bright yellow fluorescence, was most pronounced in the DOX@DSD NPs-treated group, indicating significantly enhanced DC maturation compared to other treatment groups.
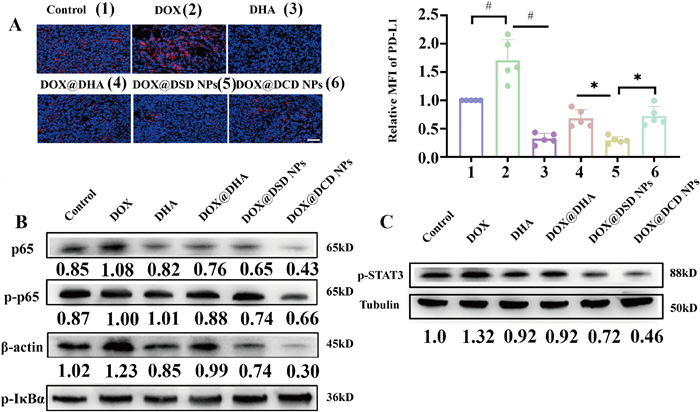
Further analysis of the immune profiles in the tumor microenvironment was conducted due to the crucial role of immune cells in disease progression and outcome. As depicted in the Fig. 5D, DOX@DSD NPs significantly increased CD8+ T cells infiltration in tumors while reducing the presence of Tregs. Formulations containing DOX facilitated the recruitment of CD8+ T cells compared to the control group. However, free DOX upregulated the expression of PD-L1 in tumor masses, potentially counteracting the cytotoxic effect of CD8+ T cells. In contrast, the combination of DOX@DHA reduced PD-L1 expression in the tumor mass (Fig. 6A), resulting from the effective regulation of the JAK/STAT and NF-κB signaling pathways by DHA (Figs. 6B and C, Figs. S26 and S27 in Supporting information), Moreover, treatment with DOX@DSD NPs significantly reduced PDL-1 expression levels to 25.43%, compared to 165.42% observed with DOX treatment (Fig. 6A).
Figure 6
Figure 6.
Reversion of immunosuppression from PD-L1 in vivo. (A) Representative immunofluorescence images of PD-L1 exposure in tumor mass (n = 5). Scale bar: 50 µm. (B) Representative WB images of protein expressions related NF-κB pathway in tumor mass (n = 3). (C) Representative WB images of p-STAT3 tumor mass (n = 3). Data are presented as mean ± SD. P < 0.05, #P < 0.0001.
To determine if DOX@DSD NPs induced systemic immune responses, serum levels of circulating cytokines such as IFN-γ, TNF-α, and IL-10 were measured using enzyme linked immunosorbent assay kit (Fig. S28 in Supporting information). Mice treated with DOX@DSD NPs exhibited higher levels of IFN-γ and TNF-α compared to other groups, while IL-10 decreased. These results demonstrated that DOX@DSD NPs efficiently promoted DC maturation and stimulated the activation and infiltration of CTLs in tumor tissues, thereby reversing the immunosuppressive state of the tumor immune microenvironment (TIME) and inducing potent immune responses for efficient cancer immunotherapy.
To investigate the biodistribution of NPs free DiR and DiR-labeled NPs (DiR@DSD NPs and DiR@DCD NPs) were intravenously injected into 4T1 subcutaneous tumor-bearing mice via the tail vein. In vivo fluorescence imaging showed that, compared to free DiR, the DiR-labeled NPs preferentially accumulated in the tumors (Fig. S29 in Supporting information). Finally, the in vivo safety of DiR@DSD NPs was evaluated. In the hemolysis assay, the hemolysis rates for all NP groups were observed to be below 10%, indicating low hemolytic toxicity (Fig. S30 in Supporting information). In the 4T1 subcutaneous tumor-bearing mouse model, DOX@DSD NPs demonstrated significant anti-tumor efficacy without causing any associated weight loss (Fig. S31 in Supporting information). H&E staining revealed normal morphology of the heart, liver, spleen, lung, and kidney in both the control and DOX@DSD NP treatment groups, with no significant abnormalities observed (Fig. S32 in Supporting information).
In summary, this study presented a novel tumor ROS-responsive DHA prodrug (DSD) that significantly enhanced the anticancer efficacy of DOX by intensifying tumor ICD and blocking PD-L1. DSD and doxorubicin self-assembled into NPs through hydrophobic and electrostatic interactions (DOX@DSD NPs). Upon inside the tumor cells, these NPs intensified ER stress and triggered a potent ICD response. Critically DOX@DSD NPs also effectively downregulated PD-L1 expression, enhancing anti-tumor immunity by inhibiting the PD-L1/PD-1 axis. With the synergy of robust ICD response and PD-L1 blockade, DOX@DSD NPs effectively suppressed the malignant growth of breast cancer. This innovative strategy demonstrates a promising approach to boost the chemo-immunotherapy efficacy of DOX through synergistic mechanisms of ICD induction and PD-L1 blockade.
Declaration of competing interest
The authors declare that they have no known competing financial interests or personal relationships that could have appeared to influence the work reported in this paper.
The National Natural Science Foundation of China (Nos. 82473864, 82400095), the Natural Science Foundation of Jiangsu Province (No. BK20231009), the National Center of Technology Innovation for Biopharmaceuticals (No. NCTIB2022HS01015), and "Double First-Class" Initiative Program in China Pharmaceutical University and the National Innovation and Entrepreneurship Training Program for Undergraduate (Nos. 202310316007Z, 2023103161133, 2023103161333) are acknowledged for providing financial support for this work.
Supplementary materials
Supplementary material associated with this article can be found, in the online version, at doi:10.1016/j.cclet.2025.111335.
[1]
C. Galassi, V. Klapp, T. Yamazaki, L. Galluzzi, Immunol. Rev. 321 (2024) 20–32. doi: 10.1111/imr.13271
Figure 1
Characterization of DOX@DSD NPs and DOX@DCD NPs. (A) Fa-CI plot of DOX and DSD at different combined ratios. (B) half maximal inhibitory concentration (IC50) of DOX and DSD with different combined ratio. The size by intensity (C), transmission electron microscope (TEM) images (E) and zeta potential (G) of DOX@DSD NPs. The size by intensity (D), TEM images (F) and zeta potential (G) of DOX@DCD NPs. Scale bar: 500 nm, insert bar: 50 nm. Data are presented as mean ± standard deviation (SD) (n = 3). **P < 0.01, ***P < 0.001, #P < 0.0001.
Figure 2
Cellular uptake and ER targeting. CLSM (A) measurements of DOX@DSD NPs or DOX@DCD NPs incubated with 4T1 cells for 12 h. DAPI: 4′,6-diamidino-2′-phenylindole. Scale bar: 50 µm. (B) Colocalization fluorescence images of C6@DSD NPs with different organelle-trackers. Scale bar: 50 µm. Data are presented as mean ± SD (n = 3). #P < 0.0001.
Figure 3In vitro ICD assay. (A) Immunofluorescence images of CRT exposure on 4T1 cells. Scale bar: 20 µm. (B, C) The contents of HMGB1 and ATP in the 4T1 cell culture media. (D) Representative WB images of eIF2α and p-eIF2α in 4T1 cells. Data are presented as mean ± SD (n = 3). P < 0.05, **P < 0.01, #P < 0.0001.
Figure 4
Reversion of immunosuppression from PD-L1 in vitro. (A) Representative WB images of PD-L1 expressions in 4T1 cells. GAPDH, glyceraldehyde-3-phosphate dehydrogenase. (B) Representative WB images of protein related NF-κB pathway in 4T1 cells. (C) Representative immunofluorescence images of PD-L1 exposure on 4T1 cells. Scale bar: 20 µm. (D) Representative WB images of p-STAT3 in 4T1 cells.
Figure 5
Antitumor study in vivo. (A) Tumor volume record during the treatment. (B, C) The images and weight of tumors in each group after different treatments. (D) Typical fluorescence images of CRT exposure, HMGB1 release, CD8 and Foxp3. Scale bar: 50 µm. Data are presented as mean ± SD (n = 5). ***P < 0.001, #P < 0.0001.
Figure 6
Reversion of immunosuppression from PD-L1 in vivo. (A) Representative immunofluorescence images of PD-L1 exposure in tumor mass (n = 5). Scale bar: 50 µm. (B) Representative WB images of protein expressions related NF-κB pathway in tumor mass (n = 3). (C) Representative WB images of p-STAT3 tumor mass (n = 3). Data are presented as mean ± SD. P < 0.05, #P < 0.0001.

 DownLoad:

 下载:
下载:


