Figure 1.
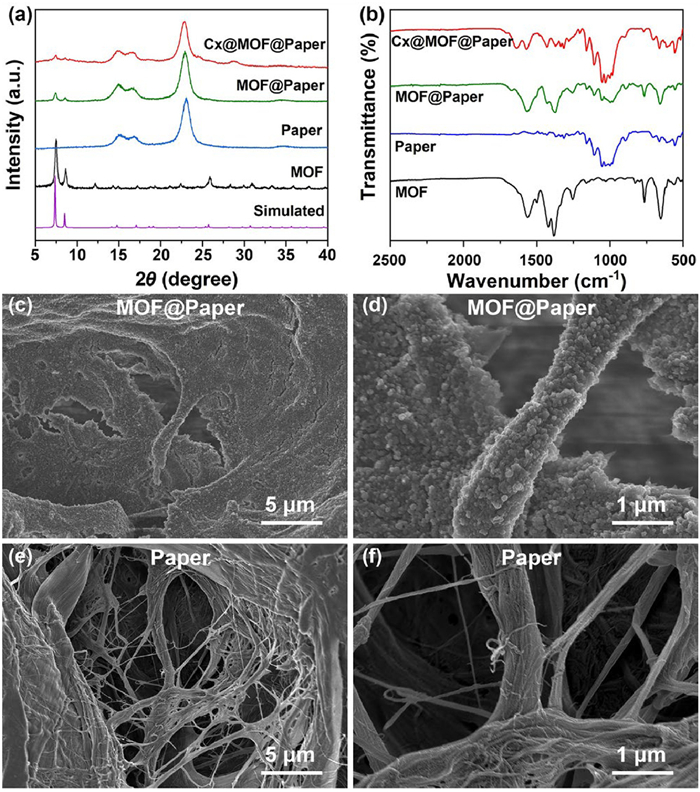
(a) PXRD patterns of Cx@MOF@Paper, MOF@Paper, Paper, MOF powder and simulated MOF. (b) ATR-FTIR spectra of Cx@MOF@Paper, MOF@Paper, Paper and MOF. SEM images of (c, d) MOF@Paper and (e, f) Paper.
Aptamer&MOF-functionalized multichannel paper chip for point-of-care testing of small extracellular vesicle membrane protein profile
Shaoqiang Wen , Lang Zhang , Zhan Huang , Meng Chen , Yuzhi Xu , Xing Huang , Zhou Zhang , Xiaoyong Zou , Zong Dai , Si-Yang Liu

Small extracellular vesicle (sEV), a nano-sized membranous vesicle secreted by cells [1], contains diverse molecular constituents of parental cells, including membrane and cytosolic proteins, DNA, RNA and so on [2,3]. The sEV membrane proteins were found to be involved in sEV formation, intercellular interaction, cell metabolism and cancer proliferation [4–7]. More importantly, the protein profiles were shown to be identical between parent cells and the sEV they produced [8]. And the sEV membrane protein can be detected without decomposing sEV comparing to other cytosolic cargos [9]. Consequently, the sEV membrane protein profile (sEVpp) is not only an ideal biomarker for cancer diagnosis, but also can analyze detailed phenotype information and origin of parent tumors [10]. Facilitating the point-of-care testing (POCT) of sEVpp would significantly benefit the precise screening of cancers, especially in resource-limited area [11], yet it poses a formidable challenge because of the lack of feasible POCT profiling methods.
In order to determine the sEVpp in POCT manner, three requirements should be considered: (1) Effective isolation of targeting sEVs [12]. The conventional sEV isolation methods, such as ultracentrifugation, polymer-based precipitation ultrafiltration, immunoaffinity assay, are not devoid of limitations including large instrument, low purity and damage to sEV [13–21]. The combination of appropriate methods regarding to the specific demands is the key for developing suitable sEV isolation techniques [22,23]; (2) Sensitive and facile detection of multiple proteins. Routine protein assays are performed using mass spectrometry, Western blot (WB) and enzyme-linked immunosorbent assay (ELISA) [24,25]. Among these techniques, ELISA was most commonly used in POCT of proteins. However, the relatively high cost of antibodies and restricted storage requirements hinders its use in resource-limited area [26]; (3) Integration of the isolation and detection method. In situ detect the sEVpp continuously after the isolation can reduce the inaccuracy caused by sample transferring and simplify the process. This is conducive to POCT, but requires rational and novel design. In general, a cost-effective and simple device that can integrate the sEV isolation and multiplex detection of proteins is highly desired for the POCT of sEVpp.
Attributing to the advanced functional nucleic acid techniques and material science, the nature antibody and enzyme can be replaced with stable and cheap aptamers and G-quadruplex DNAzyme, respectively. In addition, the functional materials, e.g., metal-organic framework (MOF), were widely applied in visual and portable detection in recent researches [27–29]. MOF modified on porous substrate can simultaneously improve the isolation efficiency and purity [30], and the peroxidase-like activity of bimetallic MOF was exploited for the detection of extracellular vesicles [31]. Recently, we constructed an antibody/MOF-modified paper-based device (sEV-IsoPD) driven by peristaltic pump for sEV isolation [32]. This device combined the advantages of filtration and immunocapture. Although the isolation performance is much better than ultracentrifugation with less than one-tenth of the cost, the price of the pump and antibody may still be potentially spared. Moreover, the ELISA-based detection process was tedious and not suitable for multiplex detection of sEVpp.
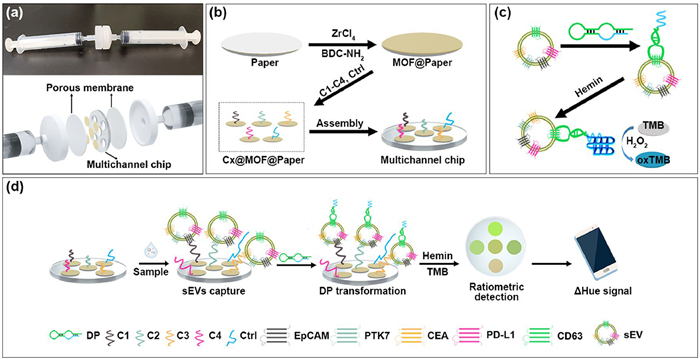
Herein, we constructed a paper-based analytical device (sEVpp-PAD) and developed a functional nucleic acid detection probe (DP) for the POCT of sEVpp. The core component of this device is a multichannel capture aptamer/MOF-modified paper chips (Cx@MOF@paper), which are fabricated by covalently bind capture aptamers onto MOF–modified paper (MOF@Paper) [33]. The aptamers for EpCAM [34], PTK7 [35], CEA [36] and PD-L1 [37], which showed high affinity and specificity according to the literatures (Table S1 in Supporting information), were adapted to capture sEVs expressing corresponding membrane proteins (sequences see Table S2 in Supporting information). The stable and well-established UiO-66-NH2 was adopted to modify the paper because of its sufficient amino groups for the modification of aptamers, the hydrophilicity to reduce the nonspecific protein adsorption, and, more importantly, its intrinsic yellowish color that can be used as the reference for ratiometric detection. These chips were assembled into a multichannel chip, which was placed between two porous polycarbonate (PC) membranes for remove the larger impurities, such as cells and cell fragments. After assembling the device, the sample, washing and detection solutions were consecutively driven through the chip by two syringes for sEV capture and detection. The DP was a hairpin probe composed of CD63 aptamer [38] and G-quadruplex (Table S2), which can transform with the existence of sEV and generate the G-quadruplex-induced colorimetric reaction for detection [39]. Utilizing this sEVpp-PAD, the sEVpp (EpCAM, PTK7, CEA and PD-L1) of sEVs of various hepatocellular carcinoma cell subtypes (HepG2, HuH-7) and liver cell line (LO2) were quantitatively and rapidly determined. Furthermore, the cell subtype of sera samples was determined by the proposed POCT device. Moreover, simple upgradation on the channel number and capture aptamers can easily adapt the device for the diagnosis of other diseases. This simple strategy for sEVpp detection can innovatively promote the point-of-care diagnosis and cell subtyping of cancer based on sEV-related liquid biopsy.
For the highly efficient and specific immunoaffinity capture of sEVs, the key issues are the sufficient aptamer modification and reduced non-specific protein adsorption [32]. UiO-66-NH2, a widely studied amino-functionalized MOF constructed by Zr and 2-aminoterephthalic acid (BDC—NH2), can provide abundant covalent binding sites for aptamers [40], and its hydrophilicity may reduce non-specific protein adsorption [41]. Therefore, the UiO-66-NH2 was first in situ modified onto paper. The filter paper was immersed in ZrCl4 and BDC—NH2 solution consecutively, then reacted at room temperature for 8 h, and it was washed by ethanol and water, obtaining the MOF modified paper (MOF@Paper).
The MOF@Paper showed typical powder X-ray diffraction (PXRD) peaks and attenuated total reflection flourier transformed infrared (ATR-FTIR) spectrum peaks that are corresponding to the unmodified paper (Paper) and UiO-66-NH2 (Figs. 1a and b) [33,42], proving that UiO-66-NH2 nanoparticles were in situ grown on the paper. The scanning electron microscopy (SEM) images showed that the MOF@Paper and Paper exhibited similar morphology of stacked paper fibers, except that MOF@Paper have nanoparticles homogeneously grown of fibers (Figs. 1c–f). Despite being modified with UiO-66-NH2, the MOF@paper should still preserve the filtration function of paper ascribing to the macroporous morphology. This allows liquid samples to be pumped through the modified paper and fully interact with modified aptamers. Besides, energy-dispersive spectroscopy (EDS) mapping of MOF@Paper showed homogeneous and abundant distribution of Zr element on paper surface (Fig. S1 in Supporting information), indicated that the MOF nanoparticles were uniformly grown on paper.
The resistance of non-specific protein adsorption on MOF@Paper was evaluated using bovine serum albumin (BSA) as demonstration. After incubation with BSA and washing, the Paper and MOF@Paper were added with coomassie brilliant blue (CBB), which can generate chromogenic signal for BSA [43]. As shown in Fig. S2a (Supporting information), the Paper showed a significantly color change, while the color of MOF@Paper was almost unchanged. For monotonal and colorless-to-colored responses, it is typical to report the intensities for one or multiple values of RGB (Red, Green, Blue) color model. Conversely, using HSB (Hue, Saturation, Brightness) values is more reliable when the color response is a transition between two distinct colors, and the Hue value is particularly suitable for these bitonal transitions and is anti-interference for lighting variations [44,45]. The average Hue value can indicate the color of the paper, and the difference of Hue (ΔHue) for each paper before and after the BSA treatment is positively correlated to the nonspecific absorption. The ΔHue of Paper before/after treatments is about 10.6 times than that of MOF@Paper (Figs. S2b and c in Supporting information), indicating a significantly reduced nonspecific protein adsorption (90.6%) after MOF modification.
Next, the capture aptamer and control probe (Ctrl) were modified on MOF@paper via 1-(3-dimethylaminopropyl)-3-ethylcarbodiimide hydrochloride/N‑hydroxy succinimide (EDC/NHS) [46]. Without the EDC/NHS, the Ctrl modified MOF@Paper cannot catalyse chromogenic reaction, indicating that the nucleic acids can only be modified onto the MOF@Paper, via EDC/NHJS, and the G-quadruplex can induce the color change on paper (Fig. S3 in Supporting information). The PXRD peaks of Cx@MOF@Paper was similar to MOF@Paper, proving that the MOF structure was not change after modification of aptamers (Fig. 1a). The typical FTIR peaks of Cx@MOF@Paper at 1640 cm−1 was attributed to the carbonyl group in the amide bond after the amidation reaction between the carboxyl group on Cx and EDC/NHS (Fig. 1b), indicating that capture aptamers were successfully modified on MOF@Paper. The morphology and elemental distribution of Cx@MOF@Paper were similar to those of MOF@Paper (Fig. S4 in Supporting information). After then, the Cx@MOF@Paper chips were assembled into the sEVpp-PAD, whose structure was shown in Scheme 1. This device only cost $2, which is much lower than the ultracentrifuge (above $100,000) and isolation kit ($50 per test).
The sEV isolation performance of the sEVpp-PAD was preliminary verified by using sEV obtained from cell culture medium with ultracentrifuge. The detailed characterizations were shown in Figs. S5-S8 (Supporting information), which confirmed that the obtained samples were sEVs. Then, capture feasibility of sEVpp-PAD was evaluated by detecting the capture sEV with a paper-based ELISA (P-ELISA) method as we reported recently [32]. The C1@MOF@Paper, which would specifically capture the sEV with EpCAM expression, was tested as a demonstration. The HepG2 sEV solutions with different concentrations were incubated with C1@MOF@paper, on which the P-ELISA was conducted after washing processes. As shown in Fig. S9 (Supporting information), the blue color belonged to oxidized 3, 3′, 5, 5′-tetramethylbenzidine (oxTMB) increased and the color of C1@MOF@Paper changes from yellow to green with increasing concentration of sEV, while the color of C1@MOF@Paper was not change without sEV (PBS solution). The ΔHue between the PBS and sEV sample increased with increasing concentration of sEV, showing a linearity of ΔHue = 17.0 × lg[sEVs] – 98.8 (R2 = 0.99, [sEV] is the concentration of sEV). The limit of detection (LOD) was evaluated to be 1.09×10⁶ particles/mL (S/N = 3). The result showed that the Cx@MOF@Paper chip can capture sEVs.
Although the P-ELISA method is simple, it is still time-consuming, relatively expensive, and difficult to achieve simultaneous determination of multiple proteins [32]. There is an urgent need to develop novel detection methods that meet the requirements of POCT. Functional nucleic acid technology has developed rapidly in recent years and has become a powerful tool for the detection of sEV membrane proteins. Based on the technology, a detection probe (DP) was designed by connecting a CD63 aptamer and a G-quadruplex sequence with a hairpin design. DP will occur a conformational change by binding to CD63 on the sEV surface, and the G-quadruplex will be exposed to catalyze the reaction between TMB and H2O2. The response of the developed DP towards CD63 and sEV were verified. Firstly, according to the circular dichroism (CD) spectrum, negative peaks at 245 nm and positive peaks at 270 nm, which are characteristic peaks of the G-quadruplex structure [47], were observed after adding sEVs or CD63 to DP (Fig. 2a). Secondly, after adding sEVs or CD63 to DP, Thioflavin T (ThT) was introduced and bright fluorescence with an emission peak at 495 nm can be found, which is the typical fluorescence of ThT after binding with G-quadruplex (Fig. 2b) [48]. Furthermore, absorption peaks at 450 nm, typical peak of oxidized TMB product, were also observed after treating DP with sEVs or CD63 (Fig. 2c). These thorough results indicate that the DP can be transformed when CD63 or sEVs exist.
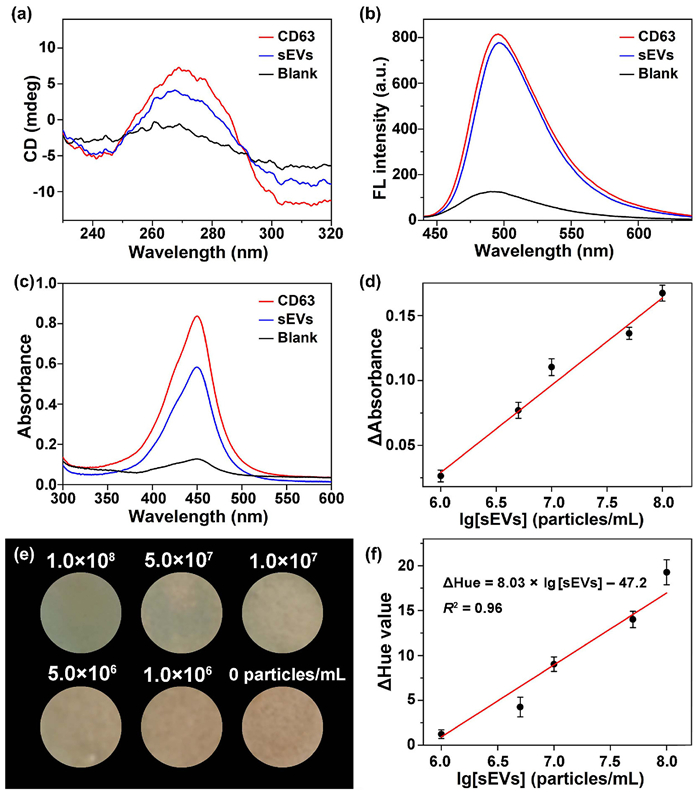
After that, the detection performance of DP was investigated. DP was treated with different concentrations of sEVs in 96-well plate, followed by the addition of Hemin and TMB/H2O2. The concentration of Hemin and the incubation time for colorimetric detection were optimized as 4.0 µmol/L and 30 min, respectively (Fig. S10 in Supporting information). As shown in Fig. 2d, the absorbance increased with the increasing concentration of sEVs, showing a linear regression equation of ΔAbs = 0.0673 × lg[sEVs] – 0.375 (R2 = 0.98), where the ΔAbs is the absorbance of samples minus the absorbance of blank. The DP was further applied for sEV detection on paper chip. The sEV-captured C1@MOF@Paper was treated with DP, and the color change was recorded after the chromogenic reaction. As shown in Fig. 2e, the color of C1@MOF@Paper changes from yellow to green with the increasing concentration of sEV. Hue values of them were calculated by ImageJ software, and the change of Hue (ΔHue) between the blank and sEV sample, defined as ΔHue = Huesample – Hueblank, increased with increasing concentration of sEVs, showing a linear regression equation of ΔHue = 8.03 ×lg[sEVs] – 47.2 (R2 = 0.96, LOD = 2.18 × 10⁶ particles/mL) (Fig. 2f).
Then, the sEVpp detection capability of this device was preliminary verified using sEVs obtained from HepG2, HuH-7 and LO2 cell culture medium. Firstly, the Cx@MOF@Paper were placed in the PC disc in the manner as shown in Fig. 3a, and the multichannel chip was assembled into the sEVpp-PAD. Next, the sEVs obtained from cell culture medium were diluted to different concentrations, and they were introduced into the springe. After capture, washing and DP detection processes, all the content of sEV membrane protein increased linearly with the increasing concentration of the corresponding sEV (Fig. S11 in Supporting information). For the sEVs from HepG2 and HuH-7 cells, color changes at PD-L1, EpCAM, PTK7, and CEA channels became more pronounced with increasing sEV concentrations, whereas normal cells LO2 did not showed significant color changes. The control channel maintained a consistent color regardless of the kind and concentration of sEVs. Moreover, quantitative analysis for all four sEV proteins within each king of sEV revealed a linear relationship between color changes and the logarithm of sEV concentrations (Fig. S11). The LODs for HepG2, HuH-7 and LO2 sEV were between 1.41 × 10⁶ - 8.26 × 10⁶ particles/mL (Table S3 in Supporting information), as calculated by their highest-expressed membrane protein. The detection sensitivity of DP is similar to the P-ELISA or ELISA methods, but the cost of DP method ($0.2 for five channels) is much lower than that of ELISA (~$4 per protein per test) because of the elimination of expensive antibodies. In addition, this method only requires 110 min for sEV isolation and detection, while the ELISA method requires approximately 4 h only for detection (Table S4 in Supporting information).
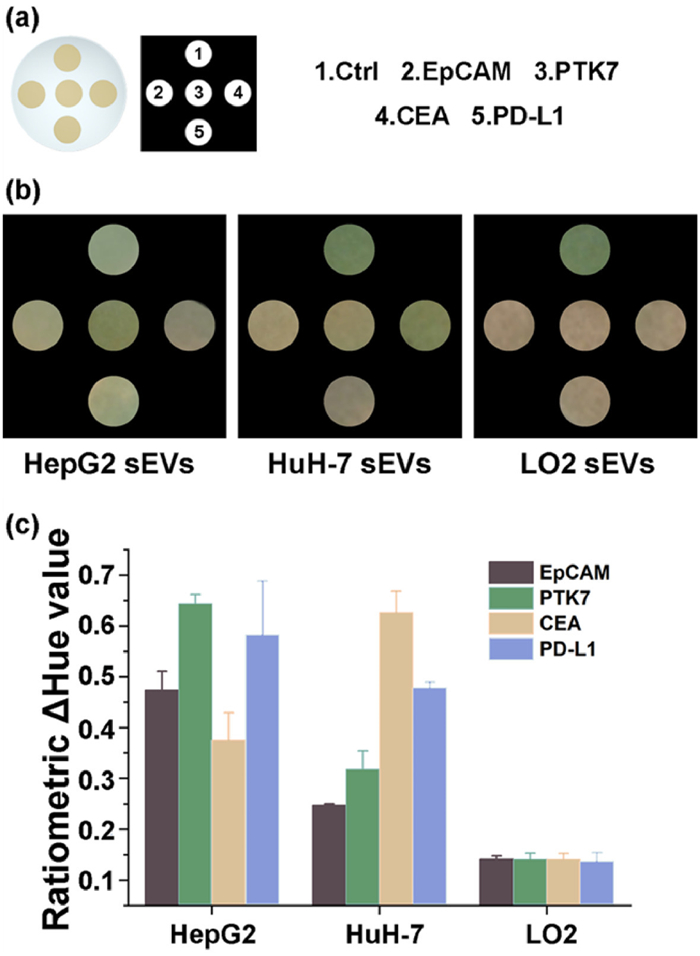
More importantly, the sEV obtained from different cell lines showed distinct membrane protein expression profile. The images of the multichannel chip with the highest sEV concentration were shown in Fig. 3b. The ratiometric ΔHue value (defined as ratiometric ΔHue = ΔHuedetection/ΔHuecontrol, where Huedetection and Huecontrol were the Hue value of detection and control channel, respectively) represented the sEV membrane protein expression level. As shown in Fig. 3c, the sEV membrane protein expression profiles for each cell lines were as follow, HepG2: PTK7 > PD-L1 > EpCAM > CEA; HuH-7: CEA > PD-L1 > PTK7 > EpCAM; LO2: 4 types of protein are lowly expressed. The results of highly expressed protein in HepG2 and HuH-7 are consistent with the recent reports [49,50]. In addition, the expression of sEV membrane protein of various cell lines follow the same order as measured by WB assay and our device (Fig. S8 in Supporting information). These results are consistent with those determined by our device, indicating that our device can accurately detect the sEV membrane protein profile with much simpler procedures.
After demonstrating the feasibility of sEV isolation and sEVpp detection of the sEVpp-PAD, the clinical applicability of this device was further verified. The sera samples obtained from people were directly introduced into the device using syringes, followed by the capture, washing and chromogenic reaction process as mentioned above. This study was approved by the Ethics Committee of the Seventh Affiliated Hospital, Sun Yat-sen University (KY-2024-221-01). Written informed consent was obtained from all patients. A total of 5 sera samples were detected, including samples from 2 healthy individuals (#1 and #2) and 3 hepatocellular carcinoma patients (#3, #4, and #5). The sEVs in these sera samples were captured and detected by similar processes in the above section. The photos of the multichannel chips are shown in Fig. 4a, and the ΔHue values are calculated and shown in Fig. 4b. It shows that the all the four sEV membrane proteins of the healthy individuals (#1 and #2) are with relatively low expression level, which is consistent with that of sEV obtained from LO2 cell culture medium, indicating a highly possible LO2 cell subtype for sample #1 and #2. For sample #4, its sEV membrane protein profile was CEA > PD-L1 > PDK7 > EpCAM, which is consistent with that of sEV obtained from HuH-7 cell culture medium, indicating that sample #4 was highly possible to be HuH-7 cell subtype. For sample #3, its sEV membrane protein expression was PTK7 ≫ EpCAM ≈ CEA > PD-L1, while that for sample #5 was EpCAM ≈ CEA > PTK7 > PD-L1. This profile was not similar to those cell subtypes we have measure, so sample #3 and #5 may belong to other cell subtypes rather than HepG2 or HuH-7. In the future works, we will obtain more samples and conduct the exosome subtyping by our device and standard method, and the in depth comparison and investigation will better verify the applicability of the proposed device. In general, this sEVpp-PAD holds great promise for the non-invasive diagnosis and subtype classification of cancer.

In conclusion, rapid isolation and detection of sEV-related biomarkers with inexpensive device is the greatest obstacle for sEV-based liquid biopsy for cancer. Regarding the advantages and disadvantages of current sEV isolation techniques and membrane protein detection methods, we developed a paper-based sEV capture and sEVpp detection device, i.e., the sEVpp-PAD. In terms of capture, the paper chip modified with UiO-66-NH2 nanoparticles/capture aptamers combines the advantages of filtration and immunoaffinity capture, effectively isolating sEVs from cell culture media and serum. For detection, a detective nucleic acid probe DP was developed, which can sensitively and facilely detect the content of captured sEV. The color changes (ΔHue) are then analyzed using a smartphone-based colorimetric method to quantitatively detect the sEVpp (EpCAM, PTK7, CEA and PD-L1) from different cell subtypes (HepG2, HuH-7 and LO2). More importantly, the subtyping of sera samples was facilitated by this multichannel sEV detection device with only $2 device, $0.2 detection reagents and 1.8 h procedure, which is much lower than the conventional methods. Moreover, as a modifiable platform, the sEVpp-PAD can be easily adapted for the diagnosis of other diseases by simply altering the modified aptamers. In general, this platform exhibited promising prospects in cancer screening and diagnosis, especially in the POCT for resource-limited regions.
The authors declare that they have no known competing financial interests or personal relationships that could have appeared to influence the work reported in this paper.
Shaoqiang Wen: Writing – original draft, Validation, Methodology, Investigation, Formal analysis, Data curation. Lang Zhang: Visualization, Investigation. Zhan Huang: Methodology, Investigation. Meng Chen: Visualization. Yuzhi Xu: Formal analysis, Data curation. Xing Huang: Methodology. Zhou Zhang: Investigation. Xiaoyong Zou: Writing – review & editing, Resources, Funding acquisition, Formal analysis. Zong Dai: Writing – review & editing, Supervision, Resources, Project administration, Methodology, Funding acquisition, Conceptualization. Si-Yang Liu: Writing – review & editing, Supervision, Project administration, Methodology, Funding acquisition, Formal analysis, Conceptualization.
This work was supported by the National Key Research and Development Program of China (No. 2022YFE0201800), the National Natural Science Foundation of China (Nos. 22274169 and 22474161), Guangdong Basic and Applied Basic Research Foundation (No. 2024A1515030160), the Science and Technology Program of Guangzhou City (No. 2023B03J1380), Shenzhen Science and Technology Innovation Commission (No. GJHZ20210705142200001) the Scientific Technology Project of Guangzhou City (No. 202103000003), the Guangdong Science and Technology Plan Project (No. 2020B1212060077), and the Open Research Fund of State Key Laboratory of Analytical Chemistry for Life Science, School of Chemistry and Chemical Engineering, Nanjing University.
Supplementary material associated with this article can be found, in the online version, at doi:
A. Tetsuhiko, C.T. Gabriel, L. Serena, et al., Extracell. Vesicles Circ. Nucl. Acids 4 (2023) 461–485. doi: 10.20517/evcna.2023.37
G. Raposo, W. Stoorvogel, J. Cell. Biol. 200 (2013) 373–383. doi: 10.1083/jcb.201211138
G. Raposo, P.D. Stahl, Nucl. Acids 4 (2023) 240–254.
S.S. Sahu, M.T. Gevari, Á. Nagy, et al., Biosens. Bioelectron. 227 (2023) 115142. doi: 10.1016/j.bios.2023.115142
M. Mathieu, L. Martin-Jaular, G. Lavieu, C. Théry, Nat. Cell Biol. 21 (2019) 9–17. doi: 10.1038/s41556-018-0250-9
R. Kalluri, V.S. LeBleu, Science 367 (2020) eaau6977. doi: 10.1126/science.aau6977
J. Tan, Y. Wen, M. Li, Coord. Chem. Rev. 446 (2021) 214111. doi: 10.1016/j.ccr.2021.214111
Y. Jiang, M. Shi, Y. Liu, et al., Angew. Chem. Int. Ed. 56 (2017) 11916–11920. doi: 10.1002/anie.201703807
X. Wang, J. Xia, L. Yang, J. Dai, L. He, Cancer Gene Ther. 30 (2023) 1051–1065. doi: 10.1038/s41417-023-00617-y
Y. Yoshioka, Y. Konishi, N. Kosaka, et al., J. Extracell. Vesicles 2 (2013) 20424. doi: 10.3402/jev.v2i0.20424
J.M. Lewis, A.D. Vyas, Y. Qiu, et al., ACS Nano 12 (2018) 3311–3320. doi: 10.1021/acsnano.7b08199
E. Willms, C. Cabanas, I. Mager, M. Wood, P. Vader, Front. Immunol. 9 (2018) 738. doi: 10.3389/fimmu.2018.00738
Q. Zhang, D.K. Jeppesen, J.N. Higginbotham, J.L. Franklin, R.J. Coffey, Nat. Protoc. 18 (2023) 1462–1487. doi: 10.1038/s41596-023-00811-0
D. Yang, W. Zhang, H. Zhang, et al., Theranostics 10 (2020) 3684–3707. doi: 10.7150/thno.41580
L. Liang, M. Kong, S. Zhou, et al., Sci. Rep. 7 (2017) 46224. doi: 10.1038/srep46224
S. Sahoo, M. Adamiak, P. Mathiyalagan, et al., Circulation 143 (2021) 1426–1449. doi: 10.1161/circulationaha.120.049254
K. Boriachek, M.N. Islam, A. Möller, et al., Small 14 (2018) 1702153. doi: 10.1002/smll.201702153
K. Liang, F. Liu, J. Fan, et al., Nat. Biomed. Eng. 1 (2017) 21. doi: 10.1038/s41551-016-0021
K. Jiang, Y. Wu, J. Chen, et al., Chin. Chem. Lett. 32 (2021) 1827–1830. doi: 10.1016/j.cclet.2020.11.031
Y. Zhao, X. Fang, M. Bai, et al., Chin. Chem. Lett. 33 (2022) 2101–2104. doi: 10.1016/j.cclet.2021.08.047
L. Yang, H. Guo, T. Hou, B. An, F. Li, Chin. Chem. Lett. 34 (2023) 107607. doi: 10.1016/j.cclet.2022.06.030
W. Hu, Y. Lai, C. Vu, et al., Talanta 265 (2023) 124851. doi: 10.1016/j.talanta.2023.124851
X. Yang, Z. Zhang, Y. Wu, et al., Adv. Mater. 36 (2024) 2304935. doi: 10.1002/adma.202304935
J. Lee, H. Kim, Y. Heo, et al., Analyst 145 (2020) 157–164. doi: 10.1039/c9an01140d
J. Chen, J. Chen, Y. Cheng, et al., Stem Cell Res. Ther. 11 (2020) 97. doi: 10.3319/tao.2020.03.19.01
C. Liu, J. Cheng, Y. Liu, et al., Biomed. Anal. 1 (2024) 54–63. doi: 10.5539/ells.v14n3p54
H. Xu, P. Cheng, Aggregate 5 (2024) e518. doi: 10.1002/agt2.518
X. Li, J. Zhao, L. Luo, et al., Chin. Chem. Lett. 35 (2024) 109407. doi: 10.1016/j.cclet.2023.109407
G. Yang, X. Jiang, H. Xu, B. Zhao, Small 17 (2021) 2005327. doi: 10.1002/smll.202005327
J. Huang, J. Pan, Y. Song, et al., TrAC Trends Anal. Chem. 173 (2024) 117619. doi: 10.1016/j.trac.2024.117619
Q. Jiang, Y. Xiao, A.N. Hong, et al., ACS Appl. Mater. Interfaces 14 (2022) 41800–41808. doi: 10.1021/acsami.2c12115
L. Zhang, W. Yin, Y. Tong, et al., Anal. Chem. 94 (2022) 10991–10999. doi: 10.1021/acs.analchem.2c01378
Z. Li, W. Zhang, M. Tao, et al., Chem. Eng. J. 435 (2022) 134804. doi: 10.1016/j.cej.2022.134804
Y. Song, Z. Zhu, Y. An, et al., Anal. Chem. 85 (2013) 4141–4149. doi: 10.1021/ac400366b
D. Shangguan, Y. Li, Z. Tang, et al., Proc. Natl. Acad. Sci. U. S. A. 103 (2006) 11838–11843. doi: 10.1073/pnas.0602615103
G.H. Tabar, C. Smith, , World Appl. Sci. J. 8 (2010) 16–21.
L. Zheng, H. Wang, P. Zuo, et al., Anal. Chem. 94 (2022) 7703–7712. doi: 10.1021/acs.analchem.2c01187
B. Qiao, Q. Guo, J. Jiang, et al., Analyst 144 (2019) 3668–3675. doi: 10.1039/c9an00181f
Y. Cao, W. Li, P. Ding, R. Pei, Chem. Commun. 56 (2020) 8667–8670. doi: 10.1039/d0cc03082a
N. Wang, M. Xie, M. Wang, Z. Li, X. Su, Talanta 220 (2020) 121352. doi: 10.1016/j.talanta.2020.121352
E. Ostuni, R.G. Chapman, R.E. Holmlin, S. Takayama, G.M. Whitesides, Langmuir 17 (2001) 5605–5620. doi: 10.1021/la010384m
A. Schaate, P. Roy, A. Godt, et al., Chem. Eur. J. 17 (2011) 6643–6651. doi: 10.1002/chem.201003211
H.J. Chial, A.G. Splittgerber, Anal. Biochem. 213 (1993) 362–369. doi: 10.1006/abio.1993.1433
K. Cantrell, M.M. Erenas, I. de Orbe-Payá, L.F. Capitán-Vallvey, Anal. Chem. 82 (2010) 531–542. doi: 10.1021/ac901753c
M.S. Woolf, L.M. Dignan, A.T. Scott, J.P. Landers, Nat. Protoc. 16 (2021) 218–238. doi: 10.1038/s41596-020-00413-0
F. Sun, K. Wu, H. Hung, et al., Anal. Chem. 89 (2017) 10999–11004. doi: 10.1021/acs.analchem.7b02876
S. Lin, W. Gao, Z. Tian, et al., Chem. Sci. 6 (2015) 4284–4290. doi: 10.1039/C5SC01320H
X. Luo, B. Xue, G. Feng, et al., J. Am. Chem. Soc. 141 (2019) 5182–5191. doi: 10.1021/jacs.8b10265
T.L.M. Wong, T. Wong, L. Zhou, et al., Cell. Mol. Gastroenterol. Hepatol. 15 (2023) 13–37. doi: 10.1016/j.jcmgh.2022.09.015
G. Xu, C. Ni, H. Liang, et al., Gastroenterol. Rep. 8 (2020) 390–398. doi: 10.1093/gastro/goaa049

Figure 1 (a) PXRD patterns of Cx@MOF@Paper, MOF@Paper, Paper, MOF powder and simulated MOF. (b) ATR-FTIR spectra of Cx@MOF@Paper, MOF@Paper, Paper and MOF. SEM images of (c, d) MOF@Paper and (e, f) Paper.

Scheme 1 Schematic illustration of sEVpp-PAD and DP. (a) Image of this device, including two syringes, a detachable filter, two porous membranes and a multichannel chip. (b) Fabrication of Cx@MOF@Paper. (c) The transformation of DP and colorimetric detection of sEV membrane protein. (d) sEV capture and visual detection processes based on sEVpp-PAD and DP.

Figure 2 (a) CD spectrum, (b) fluorescence spectrum and (c) UV–vis absorption spectrum of control and the reaction of DP with CD63 and sEVs. (d) Plot of ΔAbs. vs. lg[sEVs]. (e) Pictures of DP reacts with various concentrations of sEVs on C1@MOF@Paper. (f) Plot of ΔHue vs. lg[sEVs].

Figure 3 (a) Schematic diagram of assembly of multichannel chip. (b) Colorimetric results of different types of sEVs combined with DP on multichannel chips. (c) Ratiometric ΔHue value obtained from (b).

 扫一扫看文章

扫一扫关注我们
 DownLoad:
 下载:
下载:
