Molecular Science and Biomedicine Laboratory (MBL), State Key Laboratory of Chemo and Biosensing, College of Chemistry and Chemical Engineering, Aptamer Engineering Center of Hunan Province, Hunan Provincial Key Laboratory of Biomacromolecular Chemical Biology, Hunan University, Changsha 410082, China
b.
Key Laboratory of Endemic and Ethnic Diseases, Ministry of Education, Key Laboratory of Medical Molecular Biology of Guizhou Province, Guizhou Medical University, Guiyang 550025, China
c.
College of Environmental Science & Engineering, Hunan University, Changsha 410082, China
d.
Postgraduate Office, National University of Laos, Panorama 01000, Laos
* Corresponding author at: College of Environmental Science & Engineering
Hunan University
Changsha 410082
China. ** Corresponding author at: Key Laboratory of Endemic and Ethnic Diseases
Ministry of Education
Key Laboratory of Medical Molecular Biology of Guizhou Province
Received Date:
20 March 2025 Accepted Date:
14 May 2025 Revised Date:
30 April 2025 Available Online:
15 February 2026
Abstract:
Simultaneous identification and quantitative detection of phenylenediamine (PDA) isomers, including o-phenylenediamine (OPD), m-phenylenediamine (MPD), and p-phenylenediamine (PPD), are essential for environmental risk assessment and human health protection. However, current visual detection methods can only distinguish individual PDA isomers and failed to identify binary or ternary mixtures. Herein, a highly active and ultrastable peroxidase (POD)–like CoPt graphitic nanozyme was used for naked-eye identification and colorimetric/fluorescent (FL) dual-mode quantitative detection of PDA isomers. The CoPt@G nanozyme effectively catalyzed the oxidation of OPD, MPD, PPD, OPD + PPD, OPD + MPD, MPD + PPD and OPD + MPD + PPD into yellow, colorless, lilac, yellow, yellow, wine red and reddish-brown products, respectively, in the presence of H2O2. Thus, the MPD, PPD, MPD + PPD and OPD + MPD + PPD were easily identified based on the distinct color of their oxidation products, and the OPD, OPD + PPD, OPD + MPD could be further identified by the additional addition of MPD or PPD. Subsequently, CoPt@G/H2O2-, a 3,3′,5,5′-tetramethylbenzidine (TMB)/CoPt@G/H2O2-, and MPD/CoPt@G/H2O2-enabled colorimetric/FL dual-mode platforms for the quantitative detection of OPD, MPD and PPD were proposed. The experimental results illustrated that the constructed sensing platforms exhibit satisfactory sensitivity, comparable to that reported in previous studies. Finally, the evaluation of PDAs in water samples was realized, yielding satisfactory recoveries. This work expanded the application prospects of nanozymes in assessing environmental risks and protection of human security.
Phenylenediamines (PDAs) are vital chemical precursors and intermediates in the production of plastics, pharmaceuticals, industrial dyes and photosensitive materials [1–4]. Once PDAs are released into environmental water system, they not only contribute to water pollution but also leads to undesirable bioaccumulation [5,6]. Particularly, when humans consume water contaminated with PDAs, it poses a further health risk by activating antigen–specific T cells, binding with DNA and proteins, potentially leading to carcinogenic effects [7,8]. As is well known, o-phenylenediamine (OPD), m-phenylenediamine (MPD), and p-phenylenediamine (PPD) are three isomers of PDAs, each exhibiting varying degrees of carcinogenicity due to the different positions of the amino substituents [9,10]. Hence, simultaneous identification and quantitative detection of these compounds are essential for the evaluation of environmental health risk, and human safety protection.
To date, chromatography [11], chromatography–mass spectrometry [12] and capillary electrophoresis [13] have been employed to identify PDA isomers, but these methods require complex sample pretreatments and incur high operational costs. Recently, optical methods, particularly fluorescent (FL) and colorimetric techniques, have garnered significant interest in distinguishing PDA isomers due to their simplicity, high sensitivity and ease of visual identification [14–16]. For example, Xia et al. [14]. reported that the OPD quenched the intrinsic FL signal of a peroxidase (POD)–like metal–organic framework (MOF)–based nanozyme at 445 nm, while simultaneously generating a new FL peak at 574 nm. In contrast, PPD also quenched the MOF nanozyme′s FL signal but did not induce the formation of a new FL peak, whereas MPD had no significant effect. This allowed for the successful discrimination of PDA isomers. In addition, FL quantitative detection of OPD and PPD were realized. Peng et al. [15] found that OPD, MPD and PPD could be oxidized to their respective oxidation products (oxOPD, oxMPD, and oxPPD) by POD–like Bi–MOFs nanozyme, which exhibited yellow, colorless, and brown colors, respectively. This enabled the naked–eye identification of PDA isomers. Lin et al. [16] reported that the N and Cu co–doped carbon dots with intrinsic peroxidase (POD)–like activity could catalyze the oxidation of OPD, MPD and PPD to form yellow oxOPD, colorless oxMPD, and brown oxPPD, respectively. Also, colorimetric quantification of OPD and PPD in spiked natural water was further successfully achieved. The aforementioned studies indicate nanozymes are an ideal nanoplatform for the naked–eye discrimination and quantitative detection of PDAs. This is probably attributed to the outstanding merits of nanozymes, such as good catalytic activity, low preparation cost and flexible performance tunability [17–19]. However, current visual detection methods can only distinguish individual PDA isomers and failed to identify binary or ternary mixtures. In addition, these studies have reported the quantitative detection of OPD and PPD, but not that of MPD.
In this study, a highly active POD–like nanozyme, consisting of graphene–encapsulated CoPt nanocrystals (CoPt@G) synthesized via chemical vapor deposition (CVD) method, was used for naked-eye identification and colorimetric/FL dual-mode detection of PDA isomers. The proposed POD–like CoPt@G nanozyme exhibited superior stability due to the protection of the graphitic shell, underscoring its promising potential for the future identification and quantitative detection of PDAs. Experimental results indicated that the CoPt@G nanozyme effectively catalyzed the oxidation of OPD, MPD, PPD, OPD + PPD, OPD + MPD, MPD + PPD and OPD + MPD + PPD into yellow, colorless, lilac, yellow, yellow, wine red and reddish-brown products, respectively, thus the MPD, PPD, MPD + PPD and OPD + MPD + PPD were easily identified. Due to the oxidized products of OPD + MPD + PPD showed distinct color compared to other samples, the OPD, OPD + PPD, OPD + MPD were further identified by the additional addition of MPD or PPD. Subsequently, FL/colorimetric dual–mode platforms for the quantitative of OPD, MPD and PPD were proposed: (1) CoPt@G/H2O2–enabled OPD assay was realized leveraging the unique absorbance and FL emission characteristics of oxOPD. (2) 3,3′,5,5′–Tetramethylbenzidine (TMB)/CoPt@G/H2O2–enabled MPD detection was proposed exploiting the inhibitory effect of MPD on the oxidation of TMB probe. (3) MPD/CoPt@G/H2O2–enabled PPD detection was achieved based on the hyperchromic effect of oxMPD on oxPPD and FL quench effect of PPD on oxMPD. Finally, the determination of PDAs in real water samples was executed, yielding satisfactory recovery rates. This work is expected to provide a new insight for future assessing environmental health risks and human security.
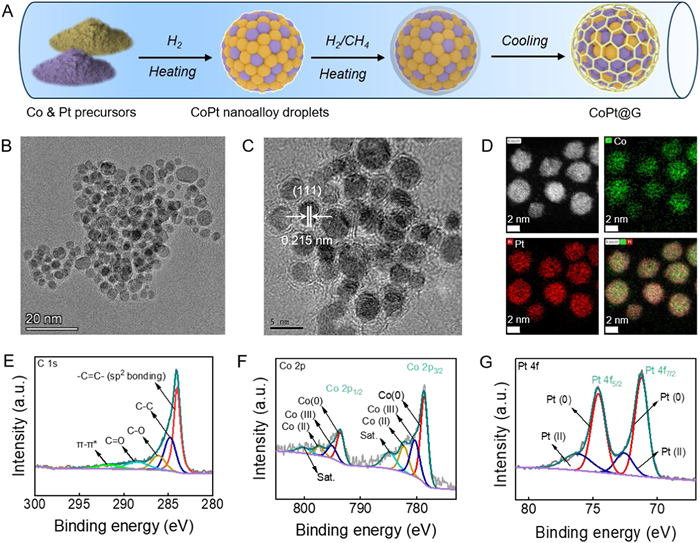
To realize the naked-eye identification and colorimetric/FL dual-mode detection of PDA isomers, a robust peroxidase (POD)–like nanozyme of graphene encapsuled CoPt nanocrystal (CoPt@G) was designed in this work. As shown in Fig. 1A, the CoPt@G nanozyme was prepared by one–pot chemical vapor deposition (CVD) method [20–22], with the CoPt alloy, obtained from Co and Pt salt precursors at high temperature, serving as the catalyst for graphene growth. The transmission electron microscope (TEM) image characterization indicated the nanosphere–like CoPt@G had an average particle size of ~4.25 nm (Fig. 1B and Fig. S1 in Supporting information). The high–resolution TEM (HR–TEM) image illustrated the CoPt@G exhibited a structure consisting of a CoPt core encapsulated by few–layer graphene, and the CoPt(111) crystal plane with a lattice spacing of 0.215 nm was observed (Fig. 1C). Evenly distributed Co and Pt elements in the HR–TEM/EDX mapping image proved the formation of CoPt alloy core (Fig. 1D), which further proved the successful preparation of CoPt@G nanozyme. The existence of Co domain endowed CoPt@G with superior magnetic property, thus it is expected to achieve reuse through magnetic separation (Fig. S2 in Supporting information). The CoPt@G solution showed black color, and a weak absorbance peak at ~262 nm in the UV–vis absorption spectrum originated from external graphitic shell was observed (Fig. S3 in Supporting information). It showed a hydrated particle size of ~71 nm, and a zeta potential of –16 mV (Fig. S4 in Supporting information). Raman spectroscopy measurements indicated the CoPt@G had three characteristics disorder (D), graphitic (G) and 2D bands of the graphitic shell (Fig. S5 in Supporting information). The prominent D band probably suggested the distortion and defects in the graphitic shell, while the relatively broad and weak 2D band indicated that the graphitic shell has a multilayered structure [23]. Fine X–ray photoelectron spectroscopy (XPS) measurements of C, Co and Pt elements were further executed to study the structural characteristics of CoPt@G. As the C 1s spectra shown in Fig. 1E, we observed five peaks located at 284, 284.8, 286.12, 288.51 and 297.71 eV, which were assigned to –C=C– (sp2 bonding), C–C, C–O, C=O vibrations, and π–π* stacking interactions. The results indicated the formation of graphene, along with the presence of defects in the graphitic shell [24,25]. The peaks at 778.63 and 793.53 eV belonged to the Co 2p3/2 and Co 2p1/2 states of elemental Co, the peaks at 780.31 and 795.05 eV were attributed to the Co 2p3/2 and Co 2p1/2 states of Co(Ⅲ), while the peaks at 782.24 and 797.31 eV correspond to the Co 2p3/2 and Co 2p1/2 states of Co(Ⅱ) [21,26]. The peak area ratio of elemental Co, Co(Ⅲ) and Co(Ⅱ) was ~5.4:2.7:1 (Fig. 1F). The peaks at 71.22 and 74.57 eV belonged to the Pt 4f7/2 and Pt 4f5/2 states of elemental Pt, while the peaks at 72.57 and 76.20 eV were assigned to the Pt 4f7/2 and Pt 4f5/2 states of Pt(Ⅱ) [22,27]. The peak area ratio of elemental Pt and Pt(Ⅱ) was ~3:1 (Fig. 1G).
Figure 1
Figure 1.
Synthesis and characterization of CoPt@G nanozyme. (A) Illustration for the synthesis of CoPt@G by CVD method. (B) TEM, (C) HR–TEM and (D) HR–TEM/EDX mapping images of CoPt@G. (E) C 1s, (F) Co 2p and (G) Pt 4f states of XPS spectrum of CoPt@G.
CoPt@G nanozyme could catalyze colorless 3,3′,5,5′–tetramethylbenzidine (TMB) into blue oxidized TMB (oxTMB), which showed a characteristic absorbance peak at 652 nm. Upon introducing H2O2 into the TMB/CoPt@G system, the solution turned deep–blue, further indicating the CoPt@G had superior peroxidase (POD)–like activity (Fig. 2A). Also, the POD–like CoPt@G nanozyme could catalyze the colorless 2, 2′–azino–bis(3–ethylbenzothiazoline–6–sulfonic acid) diammonium salt (ABTS) and 3, 3′–diaminobenzidine (DAB) into green oxABTS and brown oxDAB products (Fig. S6 in Supporting information). Like other nanozymes, the POD–like activity of CoPt@G nanozyme was affected by pH, temperature, catalyst concentration and H2O2 content (Fig. S7 in Supporting information). Optimal POD–like activity was achieved at pH 3 and 40 ℃, and the activity enhanced with the increment of catalyst and H2O2 concentration. Notably, to prevent excessive oxidation of TMB and facilitate experimental operation, Tris–HCl buffer (20 mmol/L, pH 3), room temperature (~30 ℃), appropriate concentration of both catalyst and H2O2 (variation according to the experimental needs) were used in this study. To certificate the catalytic activity center of the CoPt@G nanozyme, two additional nanoparticles, FeCo@G [28] and Co@G [29], with particle size similar to that of CoPt@G, were prepared by CVD method. We found both of them showed no POD–like activity, meaning Pt domain acted as the catalyst instead of Co or the graphitic shell (Fig. S8 in Supporting information). Next, we further explored the stability and recyclable performance of the CoPt@G nanozyme. Negligible variation of POD–like activity was recorded after the CoPt@G nanozyme rinsed in Tris–HCl buffer with different pH for 2 h (Fig. S9 in Supporting information), treated with different temperatures for 24 h (Fig. S10), as well as stored in ambient condition for 4 weeks (Fig. 2B) and river samples for 5 days (Fig. S11 in Supporting information), indicating its satisfactory corrosion resistance and stability. In addition, the POD–like activity of CoPt@G nanozyme after 6 cycles of use was > 90% of the initial one (Fig. 2C), which illustrated its good reusable ability. In short, these above superior properties endowed POD–like CoPt@G nanozyme with huge application potential in follow–up study on PDA isomers detection.
Figure 2
Figure 2.
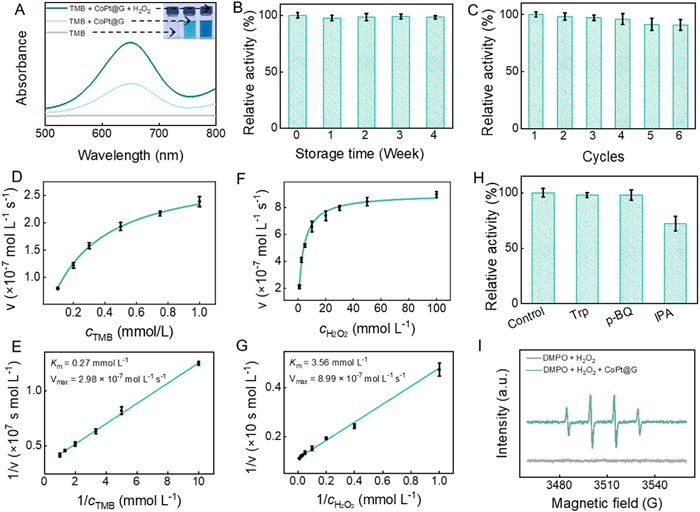
Catalytic kinetic and mechanism studies of POD–like CoPt@G nanozyme. (A) UV–vis absorption spectroscopy of TMB catalyzed by CoPt@G without and with H2O2. Relative POD–like activity of CoPt@G nanozyme (B) after various storage time and (C) in six usage cycles. n = 3, error bars, standard deviation (SD). Steady–state kinetic activity and the corresponding Lineweaver–Burk plots of CoPt@G nanozyme toward (D, E) TMB and (F, G) H2O2. (H) Relative POD–like activity of CoPt@G nanozyme added with Try, p–BQ and IPA. n = 3, error bars, standard deviation (SD). (I) EPR spectra of •OH produced by CoPt@G nanozyme catalyze H2O2 composition using DMPO as the capturing reagent.
Steady–kinetic analyses were carried out to quantify the POD–like CoPt@G nanozyme toward the oxidation of TMB/H2O2 system was further executed. The Michaelis–Menten curves and corresponding Lineweaver–Burk plots for TMB were listed in Figs. 2D and E, while those for H2O2 were listed in Figs. 2F and G, respectively. The calculated maximum reaction rate (Vmax) and Michaelis–Menten constant (Km) values were listed in Figs. 2E and G, respectively. This indicated that the CoPt@G nanozyme exhibited catalytic activity comparable to that of other nanozymes (Table S1 in Supporting information). Of note, the lower Km value of the CoPt@G nanozyme for TMB, compared to that of natural horseradish peroxidase (HRP) [30], indicated a higher affinity of CoPt@G nanozyme for TMB than HRP. Based on that, the CoPt@G nanozyme had broad prospects for TMB–based sensing applications. We further explored the catalytic mechanism of POD–like CoPt@G nanozyme toward TMB oxidation. Firstly, tryptophan (Trp), p–benzoquinone (p–BQ), rhodamine B (RhB) and isopropanol (IPA) were used as the scavenger to certificate the generation of radical species from H2O2 decomposition catalyzed by the CoPt@G nanozyme. Trp and p–BQ demonstrated no significant influence on the POD–like activity of the CoPt@G nanozyme, whereas the activity was significantly inhibited when treated with IPA (Fig. 2H). In addition, the oxidation of RhB occurred in the presence of both the CoPt@G nanozyme and H2O2 (Fig. S12 in Supporting information). These results preliminarily suggest that •OH was the main free radical during H2O2 decomposition catalyzed by the CoPt@G nanozyme. Electromagnetic resonance paramagnetic (ESR) method was further confirmed the generation of •OH from H2O2 decomposition catalyzed by the CoPt@G nanozyme using 5, 5–dimethyl–1–pyrroline N–oxide (DMPO, Adamas) as the capturing agent (Fig. 2I). Hence, we concluded that the POD–like CoPt@G nanozyme could catalyze H2O2 decomposition to form •OH radical, which further oxidized the colorless TMB to form blue–colored oxTMB (Fig. S13 in Supporting information).
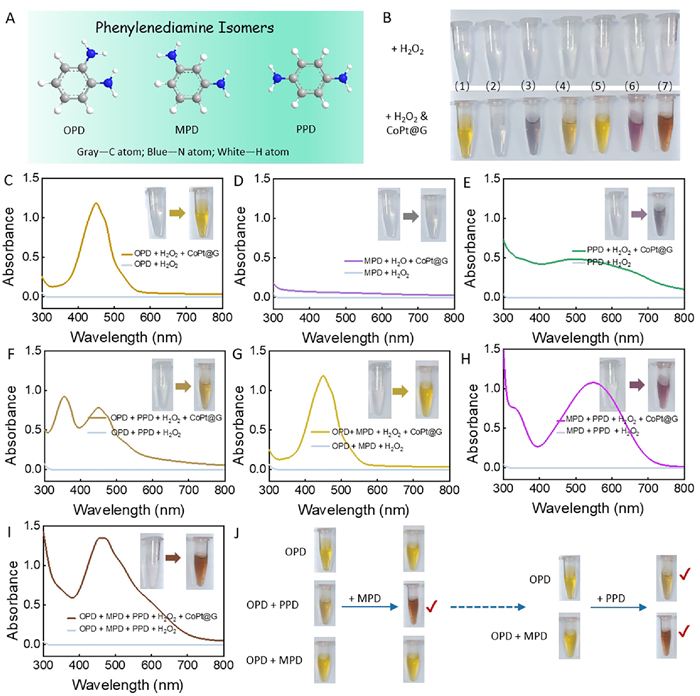
PDAs present in discharged industrial wastewater exhibit mutagenic and carcinogenic effects on human beings. Due to the varying positions of the amino substituents, the three isomers, OPD, MPD and PPD (Fig. 3A), demonstrate differing degrees of carcinogenicity. Therefore, it is of significant importance to develop effective methods for their simultaneous identification and quantitative detection. Over here, we observed that the proposed CoPt@G nanozyme catalyzed the oxidation of colorless (1) OPD, (2) MPD, (3) PPD, (4) OPD + PPD, (5) OPD + MPD, (6) MPD + PPD and (7) OPD + MPD + PPD into yellow, colorless, lilac, yellow, yellow, wine red and reddish-brown products, respectively, in the presence of H2O2 (Fig. 3B). Their corresponding UV–vis absorption spectra before and after oxidation were showed in Figs. 3C-I. Obviously, the (2) MPD, (3) PPD, (6) MPD + PPD and (7) OPD + MPD + PPD were easily identified by naked eye based on the distinct color variations of their oxidized products. However, the oxidized products of (1) OPD, (4) OPD + PPD, (5) OPD + MPD had similar color, making it difficult to distinguish them visually. Due to the oxidized products of (7) OPD + MPD + PPD showed distinct color compared to other samples, thus the (1) OPD, (4) OPD + PPD, (5) OPD + MPD could be identified by the additional addition of MPD or PPD, as illustrated in Fig. 3J. In summary, individual PDA isomers and binary or ternary mixtures were readily identified by the naked eye with the help of CoPt@G nanozyme.
Figure 3
Figure 3.
Naked–eye identification of PDA isomers by CoPt@G nanozyme. (A) Molecular formula of OPD, MPD and PPD. (B) pictures of (1) OPD, (2) MPD, (3) PPD, (4) OPD + PPD, (5) OPD + MPD, (6) MPD + PPD and (7) OPD + MPD + PPD before and after added with CoPt@G&H2O2. (C-I) The UV–vis absorption spectra of the samples in Fig. 3B. (J) Method for the naked-eye identification of (1) OPD, (4) OPD + PPD and (5) OPD + MPD.
Both colorimetric and FL methods allow for visual detection, but when the detection system contains substances that cause color or fluorescence signal interference, single-mode detection alone is insufficient to ensure accuracy. Herein, the colorimetric/FL dual-mode quantification method for OPD, MPD and PPD were proposed, respectively.
The results in Fig. 3B showed the CoPt@G nanozyme could catalyze colorless OPD into yellow oxOPD in the presence of H2O2. We further found the oxOPD emitted yellow FL signal with a characteristic peak at 574 nm (Fig. 4A). Based on the unique UV–vis absorption and FL signature peaks of oxOPD, a CoPt@G/H2O2–enabled colorimetric/FL dual–mode quantitative OPD detection platform is developed (Fig. 4B).
Figure 4
Figure 4.
Principle for dual–mode quantitative detection of PDA isomers by POD–like CoPt@G nanozyme. (A) FL spectra of OPD without or with CoPt@G&H2O2 (excitation wavelength of 407 nm). Inset: the corresponding pictures. (B-D) Principle for CoPt@G/H2O2–, TMB/CoPt@G/H2O2–, and MPD/CoPt@G/H2O2–enabled FL/colorimetric dual–mode quantitative detection of OPD, MPD and PPD.
It is reported that PDAs have superior reducibility due to the presence of amino groups [14–16], thus a series of nanozyme–based colorimetric platform have been proposed using TMB as the probe. In addition, recent studies have shown that TMB exhibits favorable FL characteristic. The reactive oxygen species (ROSs) generated from the decomposition of H2O2 by nanozymes can quench its FL signal. However, reductive substances can inhibit the quenching effect of ROSs and restore the FL signal of TMB [31,32]. Based on this mechanism, nanozyme–enabled TMB–based FL sensing platforms have been proposed. These preliminarily studies indicated the TMB could be an ideal bifunctional probe for colorimetric/FL detection applications. Experimental results showed that MPD could inhibit the oxidation of TMB, leading to a decrease in the absorbance of oxTMB (Fig. S14A in Supporting information) and a recovery of the TMB FL signal (Fig. S14B in Supporting information). Hence, a TMB/CoPt@G/H2O2–enabled colorimetric/FL dual–mode quantitative MPD detection platform is further proposed (Fig. 4C).
The results in Fig. 3 indicated that the oxMPD and oxPPD showed colorless and lilac, while their mixture showed wine red, indicating the hyperchromic effect of oxMPD on oxPPD. In addition, we found oxMPD showed acceptable FL emission property, while the addition of PPD could quench its FL signal (Fig. S15 in Supporting information). Thus, MPD/CoPt@G/H2O2–enabled colorimetric/FL dual-mode quantitative PPD detection platform is further developed (Fig. 4D).
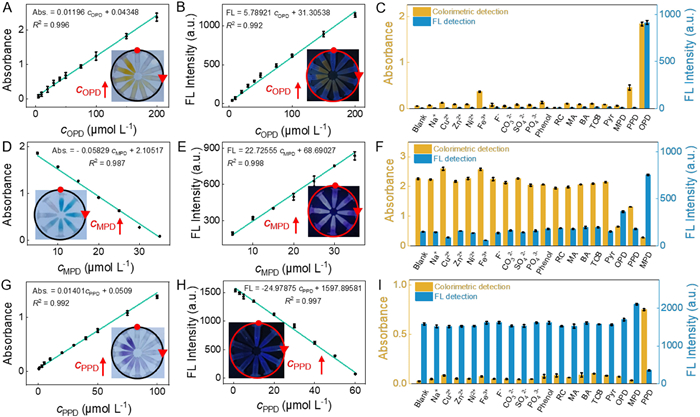
Based on the principle for quantitative detection of PDA isomers in Fig. 4, CoPt@G/H2O2–enabled colorimetric/FL dual–mode quantification detection of OPD was firstly studied. As shown in Fig. S16A (Supporting information), the absorbance of the reaction system increased with the increasing OPD concentration. The corresponding fitting curve in Fig. 5A indicated a good linear relationship between OPD concentration (ranging of 5–200 µmol/L) and absorbance at 450 nm. The limit of detection (LOD) for the OPD colorimetric sensor was determined to be 1.36 µmol/L (S/N = 3). Similarly, the FL intensity of the reaction system showed an increasing trend with the increment of OPD concentration (Fig. S16B in Supporting information), and a good linear relationship between OPD concentration (ranging of 5–200 µmol/L) and FL intensity at 574 nm was observed (Fig. 5B). The calculated LOD for the OPD FL sensor was 0.79 µmol/L (S/N = 3). The selectivity of both the colorimetric and FL OPD sensors were explored using ions (Na+, Cu2+, Zn2+, Ni2+, Fe3+, F–, CO32–, SO42– and PO43–) and organic pollutants (phenol, resorcinol (RC), benzaldehyde (BA), melamine (MA), 2, 4, 2′, 4′–tetrachlorobiphenyl (TCB) and pyrene (Pyr)) as the possible interferences. As the results shown in Fig. 5C, the substances mentioned above had no significant effect on the performance of the colorimetric and FL sensors, despite the concentrations of metal ions (3 mmol/L) and organic pollutants (300 µmol/L) being much higher than that of OPD (150 µmol/L), indicating the superior selectivity of the fabricated sensors.
Figure 5
Figure 5.
Colorimetric/FL dual–mode detection of OPD, MPD and PPD by CoPt@G nanozyme. Fitting curve between (A) absorbance at 450 nm/(B) FL intensity (excitation wavelength of 407 nm) at 574 nm and OPD concentration. (C) Absorbance at 450 nm/FL intensity at 574 nm of CoPt@G/H2O2 system in the presence of various interference substances. (D) Fitting curve between absorbance at 652 nm and MPD concentration. (E) Fitting curve between FL intensity (excitation wavelength of 280 nm) at maximum emission wavelength and MPD concentration. (F) Absorbance at 652 nm/FL intensity at maximum emission wavelength of TMB/CoPt@G/H2O2 system in the presence of various interference substances. (G) Fitting curve between absorbance at 550 nm and OPD concentration. (H) Fitting curve between FL intensity (excitation wavelength of 280 nm) at 354 nm and OPD concentration. (I) Absorbance at 550 nm/FL intensity at 354 nm of MPD/CoPt@G/H2O2 system in the presence of various interference substances. Insets: the corresponding pictures of the reaction systems. n = 3, error bars, SD.
Next, TMB/CoPt@G/H2O2–enabled colorimetric/FL dual–mode quantification detection of MPD was further studied. A decrease in the absorbance of the reaction system was observed with increasing MPD concentration (Fig. S17A in Supporting information), and a good linear relationship was established between MPD concentration (ranging of 5–35 µmol/L) and absorbance at 652 nm (Fig. 5D). The LOD for the MPD colorimetric sensor was calculated as 4.10 µmol/L (S/N = 3). On the contrary, the FL intensity of the reaction system enhanced with the increment of MPD concentration (Fig. S17B in Supporting information). We observed a good linear fitting curve between MPD concentration (ranging of 5–35 µmol/L) and FL intensity at maximum emission wavelength (Fig. 5E), and LOD of the corresponding FL sensor was 1.47 µmol/L (S/N = 3). Notably, the FL peak of the system underwent a blue shift with increasing MPD concentration, which was consistent with previous work [32]. Also, different ions (3 mmol/L) and organic pollutants (300 µmol/L) were selected to inspect the specificity of the proposed MPD (30 µmol/L) colorimetric/FL sensor. The results in Fig. 5F indicated those substances had little effect on the proposed colorimetric and FL sensors, indicating their superior anti–interference performance.
In addition, MPD/CoPt@G/H2O2–enabled colorimetric/FL dual–mode quantification detection of PPD was also explored. Absorbance of the reaction system increased with the increment of PPD concentration (Fig. S18A in Supporting information), and a good linear fitting curve between PPD concentration (ranging of 0.5–100 µmol/L) and absorbance at 550 nm was obtained (Fig. 5G). However, the FL intensity of the reaction system decreased with the increment of PPD concentration (Fig. S18B in Supporting information), and a good LOD relationship between PPD concentration (ranging of 1–60 µmol/L) and FL intensity at 354 nm was established (Fig. 5H). The LODs of PPD colorimetric and FL methods were 0.09 and 0.14 µmol/L, respectively. Also, different ions (3 mmol/L) and organic pollutants (300 µmol/L) had no significant effect on the constructed PPD (50 µmol/L) colorimetric and FL sensors (Fig. 5I), indicating the good specificity of the proposed sensing strategies.
PDAs released into the environmental water system can lead to varying degrees of bioaccumulation, which may result in diseases and even cancer in humans [1–4]. The results in Fig. 5 proved that the proposed CoPt@G nanozyme–based PDAs sensors exhibited satisfactory sensitivity and selectivity. Therefore, PDAs assays in real water samples, obtained from the Xiangjiang River near Hunan University, were further conducted using the traditional standard addition method. The sample preparation and detection procedures were exhibited in Fig. 6A, and the detailed description was listed in Section 1.11 (Supporting information). As shown in Figs. 6B and C, the recovery rates for the detection of OPD, MPD and PPD ranged from 94.23% and 112.1% using the proposed colorimetric and FL sensing platform, with the corresponding relative standard deviation between 1.47% and 5.11%. Notably, the results above were basically consistent with those of HPLC (Fig. 6D and Fig. S19 in Supporting information). Hence, the colorimetric and FL sensors proposed in this work had potential application prospects in the field of organic pollutants assay in real water samples.
Figure 6
Figure 6.
Determination of OPD/MPD/PPD in real water samples. (A) Procedure of the collection, filtration, preparation and determination processes for OPD/MPD/PPD assay in real water samples. Recovery rates of the OPD and MPD by the by the proposed (B) colorimetric, (C) FL and (D) HPLC methods.
In conclusion, a robust POD–like CoPt@G nanozyme, synthesized by CVD method, was used for naked–eye identification and colorimetric/FL dual–mode detection of PDA isomers. The CoPt@G nanozyme exhibited highly catalytic activity good durability in various harsh conditions due to the protective graphitic shell. Firstly, based on the observation that CoPt@G nanozyme effectively catalyzed the oxidation of colorless OPD, MPD, PPD, OPD + PPD, OPD + MPD, MPD + PPD and OPD + MPD + PPD into yellow, colorless, lilac, yellow, yellow, wine red and reddish-brown products, respectively, in the presence of H2O2, thus the MPD, PPD, MPD + PPD and OPD + MPD + PPD were easily identified based on the distinct color of their oxidation products. Also, the OPD, OPD + PPD, OPD + MPD could be identified by the additional addition of MPD or PPD in the catalytic oxidation system. Hence, the individual PDA isomers as well as their binary or ternary mixtures were identified by the naked eye. Subsequently, a CoPt@G/H2O2–enabled colorimetric/FL dual–mode quantitative OPD assay platform was proposed based on the unique absorbance and FL emission characteristics of oxOPD; a TMB/CoPt@G/H2O2–based dual–mode colorimetric/FL platform for quantitative MPD detection was proposed on the basis of the inhibition effect of MPD on TMB oxidation, and a MPD/CoPt@G/H2O2–enabled dual–mode quantitative OPD assay platform was also fabricated based on the hyperchromic effect of oxMPD on oxPPD and FL quench effect of PPD on oxMPD. The experimental results indicated the for the colorimetric/FL OPD, MPD and PPD sensors were 1.36, 0.79, 3.93, 1.47, 0.09 and 0.14 µmol/L, respectively, which were comparable to that reported in previous works (Table S2 in Supporting information). Eventually, the determination of PDAs in real water yielded satisfactory recovery rates, and the results were highly consistent with the HPLC measurement results. This work not only enabled naked–eye identification and quantitative detection of PDAs, but also broadened the applications of nanozymes in assessing environmental risks and human safety.
Declaration of competing interest
The authors declare that they have no known competing financial interests or personal relationships that could have appeared to influence the work reported in this paper.
This work was supported by the National Key Research and Development Program of China (No. 2022YFC2403500), the National Natural Science Foundation of China (No. 22225401), the Science and Technology Innovation Program of Hunan Province (No. 2020RC4017) and the Guizhou Provincial Science and Technology Projects (No. ZK[2023]293). Thanks to Analysis and Test Center of Hunan University for the Raman spectra, XPS and HR-TEM measurements. The authors would also like to acknowledge C. Chen from Shiyanjia Lab (www.shiyanjia.com) for the ICP/OES measurements.
Supplementary materials
Supplementary material associated with this article can be found, in the online version, at doi:10.1016/j.cclet.2025.111323.
Figure 1
Synthesis and characterization of CoPt@G nanozyme. (A) Illustration for the synthesis of CoPt@G by CVD method. (B) TEM, (C) HR–TEM and (D) HR–TEM/EDX mapping images of CoPt@G. (E) C 1s, (F) Co 2p and (G) Pt 4f states of XPS spectrum of CoPt@G.
Figure 2
Catalytic kinetic and mechanism studies of POD–like CoPt@G nanozyme. (A) UV–vis absorption spectroscopy of TMB catalyzed by CoPt@G without and with H2O2. Relative POD–like activity of CoPt@G nanozyme (B) after various storage time and (C) in six usage cycles. n = 3, error bars, standard deviation (SD). Steady–state kinetic activity and the corresponding Lineweaver–Burk plots of CoPt@G nanozyme toward (D, E) TMB and (F, G) H2O2. (H) Relative POD–like activity of CoPt@G nanozyme added with Try, p–BQ and IPA. n = 3, error bars, standard deviation (SD). (I) EPR spectra of •OH produced by CoPt@G nanozyme catalyze H2O2 composition using DMPO as the capturing reagent.
Figure 3
Naked–eye identification of PDA isomers by CoPt@G nanozyme. (A) Molecular formula of OPD, MPD and PPD. (B) pictures of (1) OPD, (2) MPD, (3) PPD, (4) OPD + PPD, (5) OPD + MPD, (6) MPD + PPD and (7) OPD + MPD + PPD before and after added with CoPt@G&H2O2. (C-I) The UV–vis absorption spectra of the samples in Fig. 3B. (J) Method for the naked-eye identification of (1) OPD, (4) OPD + PPD and (5) OPD + MPD.
Figure 4
Principle for dual–mode quantitative detection of PDA isomers by POD–like CoPt@G nanozyme. (A) FL spectra of OPD without or with CoPt@G&H2O2 (excitation wavelength of 407 nm). Inset: the corresponding pictures. (B-D) Principle for CoPt@G/H2O2–, TMB/CoPt@G/H2O2–, and MPD/CoPt@G/H2O2–enabled FL/colorimetric dual–mode quantitative detection of OPD, MPD and PPD.
Figure 5
Colorimetric/FL dual–mode detection of OPD, MPD and PPD by CoPt@G nanozyme. Fitting curve between (A) absorbance at 450 nm/(B) FL intensity (excitation wavelength of 407 nm) at 574 nm and OPD concentration. (C) Absorbance at 450 nm/FL intensity at 574 nm of CoPt@G/H2O2 system in the presence of various interference substances. (D) Fitting curve between absorbance at 652 nm and MPD concentration. (E) Fitting curve between FL intensity (excitation wavelength of 280 nm) at maximum emission wavelength and MPD concentration. (F) Absorbance at 652 nm/FL intensity at maximum emission wavelength of TMB/CoPt@G/H2O2 system in the presence of various interference substances. (G) Fitting curve between absorbance at 550 nm and OPD concentration. (H) Fitting curve between FL intensity (excitation wavelength of 280 nm) at 354 nm and OPD concentration. (I) Absorbance at 550 nm/FL intensity at 354 nm of MPD/CoPt@G/H2O2 system in the presence of various interference substances. Insets: the corresponding pictures of the reaction systems. n = 3, error bars, SD.
Figure 6
Determination of OPD/MPD/PPD in real water samples. (A) Procedure of the collection, filtration, preparation and determination processes for OPD/MPD/PPD assay in real water samples. Recovery rates of the OPD and MPD by the by the proposed (B) colorimetric, (C) FL and (D) HPLC methods.

 DownLoad:


 下载:
下载:


