Figure 1.
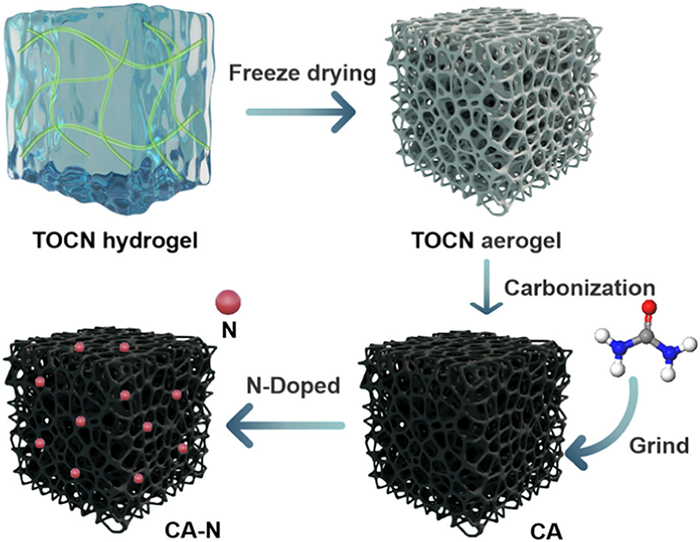
The synthesis process of preparing nitrogen-rich doped carbon aerogel using cellulose as the carbon source.
Enhancing the electroactivity of supercapacitors through nitrogen doping on cellulose-derived carbon materials
Siling Chen , Yang Hu , Sijia Zhang , Xuesong Liu , Zhuqun Shi , Chuanxi Xiong , Weiwei Wu , Ruizhi Ning , Quanling Yang

Nowadays, with the utilization of fossil fuels, environmental issues and energy crises have become increasingly severe. Consequently, higher requirements have been placed on the development of renewable energy sources as well as the storage and utilization of energy [1–3]. Various methods for energy storage have been proposed; for example, batteries can store large amounts of energy, but they have several drawbacks such as short lifespan and rapid capacity decay [4]. Supercapacitors, on the other hand, are electronic devices that can store and release large amounts of energy in a short period of time. Due to their advantages of fast charging and discharging rates, high energy density, good cycle stability, and environmental friendliness, supercapacitors are gradually gaining attention [5–7]. Therefore, further research and development of supercapacitors to improve their specific capacitance and cycle stability are of great significance [8,9].
Supercapacitors can be classified into three main categories based on their charge storage mechanisms: Electric double-layer capacitors (EDLCs), pseudocapacitors (PCs), and hybrid supercapacitors (HSCs) [2]. Among these, EDLCs are renowned for their excellent cycle stability, which stems from their ability to store energy through physical processes occurring between the electrolyte and the electrodes [10]. Carbon materials, including carbon nanotubes, activated carbon, and graphene, are widely used as electrode materials in EDLCs due to their unique properties [11,12]. In particular, activated carbon is a popular choice for EDLC electrodes owing to its large surface area and excellent electrical properties. This material is typically produced through either physical or chemical processes. The physical process involves thermal treatment of activated carbon precursors at high temperatures (700–1200 ℃), while the chemical process involves reacting carbon materials with activating agents such as urea or potassium hydroxide at lower temperatures [13]. The activation process leads to the formation of a porous structure, which can be categorized into micropores, mesopores, and macropores. These pores play a crucial role in determining the electrochemical performance of the electrode material [14].
Traditional carbon materials used in supercapacitors often originate from fossil fuels, which can contribute to energy crises and environmental pollution. As a result, there is a growing interest in utilizing biomass as a sustainable alternative energy source [15–18]. Biomass-derived materials are biodegradable and environmentally friendly, and they have been successfully applied in various electronic devices [19–22]. A noteworthy example is the work by Li et al., who synthesized nitrogen-doped activated carbon materials using agricultural waste corncob as the precursor and ammonia gas as the nitrogen source [23]. The resulting supercapacitor exhibited a specific capacitance of 185 F/g at a current density of 0.4 A/g and retained 76.3% of its capacity after 8000 cycles at a current density of 1.6 A/g. This study demonstrates the potential of using biomass-derived carbon materials to fabricate high-performance, sustainable supercapacitors.
Cellulose, the most abundant natural polymer, can be utilized as an activated carbon material for supercapacitor electrodes [24–26]. Elemental doping in carbon-based supercapacitor materials can significantly enhance the capacitance-related properties of the materials, with nitrogen doping being the most widely applied [27–29]. Nitrogen atoms, compared to other atoms, have similar valence electrons and atomic radii to carbon atoms, making doping more readily achievable [30]. The introduction of nitrogen atoms into the carbon network disrupts the sp2 carbon planes, leading to an increase in disordered carbon, which in turn enhances the electrochemical activity and accessibility of the electrode surface. The incorporation of different nitrogen functional groups, such as graphitic nitrogen, pyrrolic nitrogen, and pyridinic nitrogen, not only contributes to increased specific capacitance but also improves the electrical conductivity of the carbon aerogels. Graphitic nitrogen enhances conductivity, while pyrrolic and pyridinic nitrogen provide additional active sites for charge storage, thereby increasing the total capacitance [31,32]. For example, Chen et al. synthesized nitrogen-doped porous carbon using regenerated cellulose, which exhibited a relatively high specific capacitance of 193 F/g at 0.5 A/g and excellent cycling performance [12].
Herein, we prepared a kind of N-doped carbon aerogel CA-N through a simple method using nanocellulose as electrode material for supercapacitor. The carbon aerogels (CAs) were synthesized using TEMPO-oxidized nanocellulose (TOCN) as the raw material. The TOCN was then mixed with urea and heat-treated at high temperatures to obtain various nitrogen-doped carbon aerogels. To determine the nitrogen-doped carbon aerogel with the best electrochemical performance, electrochemical tests were conducted using a three-electrode system. The results indicated that a maximum nitrogen content of 6.55% was achieved, which imparted a significant pseudocapacitive effect to the material. Additionally, it exhibited low resistance and a relatively high specific capacitance of 283.3 F/g. Furthermore, the nitrogen-doped carbon aerogel (CA-N4) exhibited excellent cycling stability, maintaining 98.5% of its specific capacitance after 5000 cycles.
Firstly, under the catalysis of TEMPO, the cellulose raw material is oxidized by sodium hypochlorite to convert some of the hydroxyl groups on the fiber surface into sodium carboxylate, and further nanosized cellulose fibers are obtained through high-pressure homogenization. Further, the TOCN dispersion was cross-linked in an acidic environment for 24 h to obtain TOCN hydrogels. After washing with pure water to remove any residual chemicals, the TOCN hydrogels were immersed in tertiary butanol to replace the water within the gels with tertiary butanol (in order to prevent disruption of the fiber network caused by the crystallization and expansion of water during the freezing process of the hydrogels). The TOCN gels were then fully frozen in a refrigerator before being subjected to freeze-drying to obtain cellulose aerogels.
As shown in Fig. 1, the aerogels obtained above were placed in a tubular furnace under an argon atmosphere. They were heated from room temperature to 750 ℃ (with a heating and cooling rate of 5 ℃/min) and maintained at this temperature for 2 h. The resulting carbon materials were referred to as carbon aerogels (CAs). For N-doping, the CAs were ground using an agate mortar, and urea was added in varying mass ratios (CA/urea = 1:10, 1:20, 1:30, 1:40, 1:50). The mixture was then ground until evenly dispersed and placed in a tubular furnace. It was heated to 750 ℃ (with the same heating and cooling rate of 5 ℃/min) and maintained for 2 h to obtain nitrogen-doped carbon aerogels. The resulting aerogels were named CA-N1, CA-N2, CA-N3, CA-N4, and CA-N5, corresponding to the respective urea mass ratios.
Figs. 2a–c display the microstructure of CA, CA-N4, and CA-N5, respectively. It is evident that the carbon nanofibers are interconnected to form a 3D network structure, demonstrating that the 3D structure is well-preserved through the freeze-drying method. The carbon aerogels are composed of nanofibers with a high aspect ratio, with lengths of approximately 1–2 µm and diameters of about 5 nm. After heat treatment with urea, the 3D network structure of the carbon aerogels remains intact, and the structure becomes denser as the N content increases. In CA-N5, some flake-like structures can be observed, which may be attributed to the increased amount of urea providing additional carbon and nitrogen elements to compensate for any element loss during the treatment process [12]. Based on the electronic scanning diagram of the CA-N4 sample (Fig. 2d), Figs. 2e-g exhibit the element distribution of CA-N4. The presence of C, N, and O elements is clearly visible, and the distribution of nitrogen elements is relatively uniform, indicating that nitrogen can be successfully doped into the carbon aerogel through heat treatment of CA with urea.
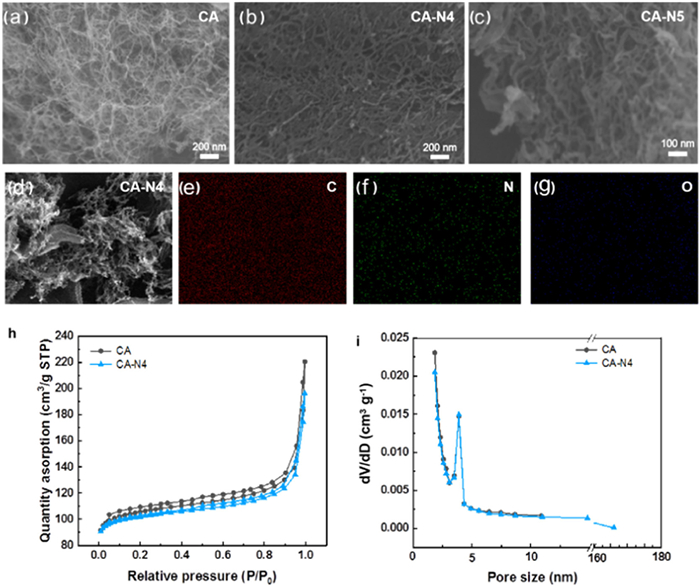
To investigate the alterations in the pore structure of carbon aerogels following nitrogen doping, we conducted nitrogen adsorption and desorption tests on both pristine carbon aerogels and their nitrogen-doped counterparts. Fig. 2h illustrates that both samples exhibit characteristics of mesoporous materials. The pure carbon aerogel boasted a specific surface area of 334.6 m2/g and a pore volume of 0.30 cm3/g, while the nitrogen-doped variant, designated as Ca-N4, exhibited a slightly reduced specific surface area of 320.6 m2/g and a pore volume of 0.28 cm3/g. These findings underscore the inherently rich pore structure and high specific surface area of carbon aerogels.
As depicted in the pore size distribution graph in Fig. 2i, the pores in the carbon aerogel are predominantly concentrated within the 2–5 nm range. Furthermore, the presence of micropores and macropores complements the mesoporous structure, offering numerous pathways for electrolyte ion diffusion and absorption. Specifically, the macropores facilitate the retention of electrolyte ions and shorten the ion transport distance, thereby ensuring rapid electrolyte diffusion. Micropores, on the other hand, contribute to the high specific surface area and provide active sites that enhance charge storage. Due to the secondary high-temperature sintering process, the specific surface area and porosity of the nitrogen-doped carbon aerogel samples experienced a slight decrease. However, considering the performance enhancement achieved through nitrogen doping, this level of sacrifice is deemed acceptable.
To further investigate the impact of nitrogen doping on the characteristics of carbon aerogels, the samples were analyzed using X-ray diffraction (XRD) and Raman spectroscopy, as presented in Fig. 3. The XRD patterns (Fig. 3a) reveal broad peaks at approximately 23.4° and 45.3°, which correspond to the (002) and (100) graphite planes, respectively. This indicates a low degree of graphitization within the carbon materials [33]. Fig. 3b displays the Raman spectra of the carbon aerogel (CA) and nitrogen-doped carbon aerogel (CA-N) samples. The D-band at 1335 cm-1 represents lattice defects and disorder in the carbon atoms, while the G-band at around 1590 cm-1 indicates the symmetry and crystallinity of the carbon atoms. The ratio of the intensities of the D-band to the G-band (ID/IG) reveals the degree of disorder in the material. The ID/IG values for CA, CA-N3, and CA-N4 are 2.27, 2.53, and 3.01, respectively. This increase in disorder is attributed to the nitrogen doping process, which may disrupt the sp2 carbon plane, leading to an increase in disordered carbon.

To analyze the element composition and content, X-ray photoelectron spectroscopy (XPS) measurements were conducted. As shown in Figs. 3c and d, the XPS spectrum of the CA-N4 sample exhibits an additional N 1s peak alongside the C and O peaks at 282.78 eV and 530.28 eV, respectively. This confirms the successful incorporation of nitrogen into the carbon aerogel through heat treatment. The N 1s peak of CA-N4 can be deconvoluted into three components at 399.68, 398.48, and 396.58 eV, corresponding to graphitic N, pyrrolic N, and pyridinic N, respectively [33,34]. Pyrrolic N and pyridinic N are known to contribute to higher specific capacitance, while graphitic N enhances the electrical conductivity of the materials. This multi-level nitrogen structure is advantageous for improving the electrochemical performance of the materials. For the CA-N4 sample, a nitrogen content of 6.55% was detected, indicating successful nitrogen doping.
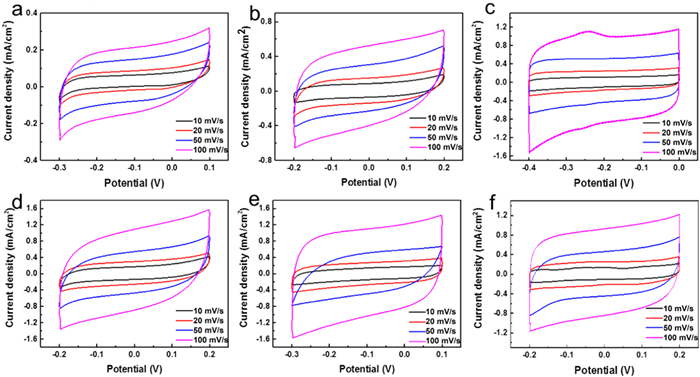
To study the electrochemical properties of the materials, a three-electrode test system with 6 mol/L KOH as the electrolyte was employed to test CA (pure carbon) and CA-N. Fig. 4 presents the CV curves of each sample recorded at various scanning rates. Fig. 4a shows that the CV curve of pure carbon CA exhibits a rectangular shape, which is characteristic of ideal capacitive behavior. Figs. 4b-f display the CV curves of CA-N, which also maintain a rectangular shape, indicating that it exhibits typical double-layer capacitance. The energy storage mechanism of these capacitors is based on physical energy storage, involving electron transport within the electrode and ion transport at the interface between the electrolyte and the electrode. At scanning rates ranging from 10 mV/s to 100 mV/s, the CV curves of all samples retain good symmetry and a rectangular shape, demonstrating that CA-N possesses good electrical conductivity. Generally, the area under the CV curve is indicative of the specific capacitance of the material. As shown in Figs. 4b–f, the area of the CV curve increases with the amount of urea used during heat treatment, suggesting that the specific capacitance of the electrode material also increases accordingly.
For an ideal double-layer supercapacitor, the constant current charge-discharge curve exhibits a symmetrical triangular shape, and the material's potential is linearly related to time during the charge-discharge process. The specific capacitance can be calculated using the following formula (Eq. 1):
|
|
(1) |
where C represents the specific capacitance of the electrode material, I is the applied current, Δt is the discharge time, ΔV is the potential difference within the voltage window, and m is the mass of the active material on the electrode surface.
Fig. 5 displays the charge-discharge curves of CA (pure carbon) and CA-N at various current densities. The constant current charge-discharge curves of both the pristine carbon aerogel and the nitrogen-doped carbon aerogel (CA-N) maintain a linear and symmetrical triangular shape, indicating that CA-N behaves as an ideal double-layer supercapacitor. Using the aforementioned formula (Eq. 1), the specific capacitances of CA, CA-N1, CA-N2, CA-N3, CA-N4, and CA-N5 at a current density of 0.5 A/g were calculated to be 47.3, 97.5, 187.5, 251.8, 283.3, and 140.6 F/g, respectively.
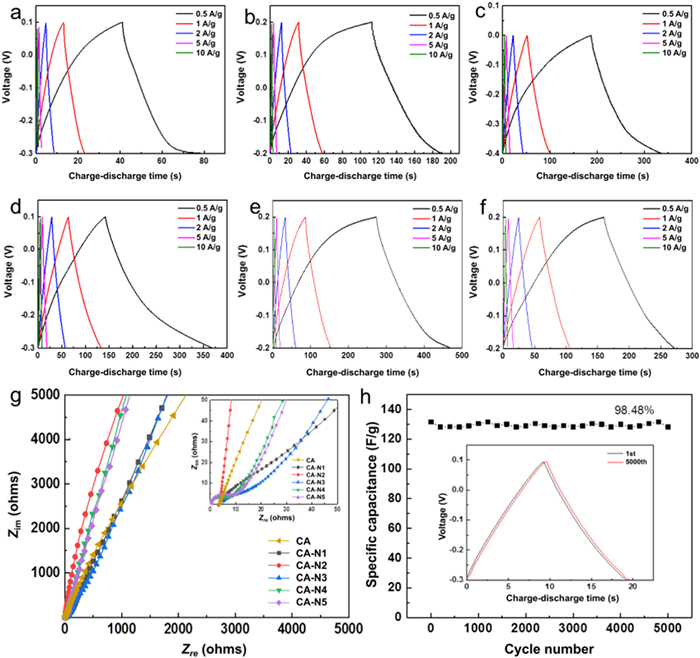
Electrochemical impedance spectroscopy (EIS) is indeed a crucial technique for analyzing the impedance characteristics of electrodes and their surfaces. The Nyquist impedance plot typically consists of two regions: the high-frequency region and the low-frequency region. In the high-frequency region, the intercept on the real axis (Z') represents the series resistance (Rs), which includes the resistance of the electrolyte, the contact resistance at the electrode-electrolyte interface, and the internal resistance of the electrode material. For CA and CA-N1 to CA-N5, the Rs values are 3.77, 3.79, 3.29, 3.11, 0.497, and 0.3 Ω, respectively, all of which are below 5 Ω. The semicircle observed in this region corresponds to the charge transfer resistance (Rct) at the electrode-electrolyte interface. A smaller semicircle diameter indicates a lower Rct, suggesting better charge transfer kinetics. In the low-frequency region, the impedance plot typically displays a Warburg-type curve, which is related to the diffusion of electrolyte ions within the electrode. The projection length of this curve on the X-axis (real axis) reflects the ion diffusion resistance. A steeper slope (i.e., higher slope) in this region indicates more efficient ion transport within the electrolyte.
As shown in Fig. 5g, the ion diffusion resistance of CA-N samples after nitrogen doping is smaller compared to the pristine CA sample. This observation suggests that nitrogen doping helps to improve the conductivity of carbon aerogels, reduce the internal resistance, and enhance the ion transport efficiency. These improvements contribute to the enhanced electrochemical performance of the nitrogen-doped carbon aerogels. In summary, the EIS results confirm that nitrogen doping of carbon aerogels leads to reduced internal resistance, improved conductivity, and more efficient ion transport, all of which are beneficial for enhancing the electrochemical performance of supercapacitors.
In summary, nitrogen-doped carbon aerogels were successfully synthesized through a blending and heat treatment process, utilizing urea as the nitrogen source. The resulting CA-N maintains the same three-dimensional network structure as the pristine carbon aerogel (CA), boasting a specific surface area of 320.6 m2/g and a pore volume of 0.28 cm3/g. The pore size distribution is primarily concentrated within the 2–5 nm range, classifying it as a mesoporous material. This structure, combined with the presence of micropores and macropores, provides ample channels for efficient charge transfer. The introduction of nitrogen doping adds a degree of pseudocapacitive effect to the carbon network, enabling it to achieve higher specific capacitance performance while maintaining high cycling stability. This provides a feasible solution for the application of carbon-based supercapacitors. Specifically, the CA-N4 sample exhibits a high specific capacitance of 283.3 F/g at a current density of 0.5 A/g. Impressively, even after 5000 charge-discharge cycles, the capacity retention rate remains at an outstanding 98.48%. These results underscore the excellent cycling stability of the nitrogen-doped carbon material. Given its environmentally friendly nature and superior electrochemical properties, the N-doped carbon aerogel holds great promise for applications in the field of energy storage.
The authors declare that they have no known competing financial interests or personal relationships that could have appeared to influence the work reported in this paper.
Siling Chen: Writing – original draft, Investigation. Yang Hu: Writing – original draft, Formal analysis, Data curation. Sijia Zhang: Validation, Resources, Investigation. Xuesong Liu: Validation, Software, Data curation. Zhuqun Shi: Project administration, Methodology. Chuanxi Xiong: Resources, Project administration, Conceptualization. Weiwei Wu: Writing – review & editing, Resources. Ruizhi Ning: Writing – review & editing, Supervision, Methodology, Funding acquisition. Quanling Yang: Writing – review & editing, Supervision, Funding acquisition, Conceptualization.
This work was supported by Shenzhen Science and Technology Program (No. JCYJ20240813103608012), State Key Laboratory of New Textile Materials and Advanced Processing Technologies (No. FZ2024019), and National Natural Science Foundation of China (No. 22104117).
K.S. Poonam, A. Arora, S.K. Tripathi, J. Energy Storage 21 (2019) 801–825. doi: 10.1016/j.est.2019.01.010
J. Zhao, Y. Gao, A.F. Burke, J. Power Sources 363 (2017) 327–340. doi: 10.1016/j.jpowsour.2017.07.066
T. Wang, H.C. Chen, F. Yu, X.S. Zhao, H. Wang, Energy Storage Mater. 16 (2019) 545–573. doi: 10.1016/j.ensm.2018.09.007
P. Sharma, V. Kumar, J. Electron. Mater. 49 (2020) 3520–3532. doi: 10.1007/s11664-020-07992-4
J. Libich, J. Máca, J. Vondrák, O. ˇCech, M. Sedlaˇríková, J. Energy Storage 17 (2018) 224–227. doi: 10.1016/j.est.2018.03.012
G.A. Snook, P. Kao, A.S. Best, J. Power Sources 196 (2011) 1–12.
Z.S. Iro, C. Subramani, S.S. Dash, Int. J. Electrochem. Sci. 11 (2016) 10628–10643. doi: 10.20964/2016.12.50
M. Chen, Y. Yang, D. Chen, H. Wang, Chin. Chem. Lett. 29 (2018) 564–570. doi: 10.1016/j.cclet.2017.12.019
L. Zhang, Y. Liu, Y. You, A. Vinu, L. Mai, Interdiscip. Mater. 2 (2022) 91–110.
A. González, E. Goikolea, J.A. Barrena, R. Mysyk, Renew. Sustain. Energy Rev. 58 (2016) 1189–1206. doi: 10.1016/j.rser.2015.12.249
L. Cao, H. Li, X. Liu, et al., J. Colloid Interface Sci. 599 (2021) 443–452. doi: 10.1016/j.jcis.2021.04.105
Z. Chen, X. Peng, X. Zhang, et al., Carbohydr. Polym. 170 (2017) 107–116. doi: 10.3390/molecules22010107
M. Yu, Y. Han, J. Li, L. Wang, Int. J. Biol. Macromol. 115 (2018) 185–193. doi: 10.1016/j.ijbiomac.2018.04.012
W. Raza, F. Ali, N. Raza, et al., Nano Energy 52 (2018) 441–473. doi: 10.1016/j.nanoen.2018.08.013
G. Ma, Q. Yang, K. Sun, et al., Bioresour. Technol. 197 (2015) 137–142. doi: 10.1016/j.biortech.2015.07.100
C. Xuan, Z. Peng, Wang J, et al., Chin. Chem. Lett. 28 (2017) 2227–2230. doi: 10.1016/j.cclet.2017.09.009
M. Guo, K. Ni, Y. Zhu, Interdiscip. Mater. 3 (2024) 189–202. doi: 10.1002/idm2.12146
Z. Guo, X. Han, C. Zhang, et al., Chin. Chem. Lett. 35 (2024) 109007. doi: 10.1016/j.cclet.2023.109007
L. Zhang, L. Xu, Y. Zhang, et al., RSC Adv. 8 (2018) 3869–3877. doi: 10.1039/c7ra11475c
J. Jose, V. Thomas, V. Vinod, R. Abraham, S. Abraham, J. Sci. : Adv. Mater. Devices 4 (2019) 333–340. doi: 10.1016/j.jsamd.2019.06.003
T. Wu, Y. Song, Z. Shi, et al., Nano Energy 80 (2021) 105541. doi: 10.1016/j.nanoen.2020.105541
R. Chen, X. Li, Q. Huang, et al., Chem. Eng. J. 412 (2021) 128755. doi: 10.1016/j.cej.2021.128755
B. Li, F. Dai, Q. Xiao, et al., Energy Environ. Sci. 9 (2016) 102–106. doi: 10.1039/C5EE03149D
C. Chen, L. Hu, Acc. Chem. Res. 51 (2018) 3154–3165. doi: 10.1021/acs.accounts.8b00391
G. Zu, J. Shen, L. Zou, et al., Carbon 99 (2016) 203–211. doi: 10.1016/j.carbon.2015.11.079
C. Li, K. Jia, Q. Liang, Y. Li, S. He, Interdiscip. Mater. 3 (2024) 270–296. doi: 10.1002/idm2.12154
G. Lota, B. Grzyb, H. Machnikowska, J. Machnikowski, E. Frackowiak, Chem. Phys. Lett. 404 (2005) 53–58. doi: 10.1016/j.cplett.2005.01.074
S.L. Candelaria, B.B. Garcia, D. Liu, G. Cao, J. Mater. Chem. 22 (2012) 9884–9889. doi: 10.1039/c2jm30923h
C. Kim, C. Zhu, Y. Aoki, H. Habazaki, Electrochim. Acta 314 (2019) 173–187. doi: 10.1016/j.electacta.2019.05.074
F. Wang, L. Chen, H. Li, et al., Chin. Chem. Lett. 31 (2020) 1986–1990. doi: 10.1016/j.cclet.2020.02.020
H. Wang, T. Maiyalagan, X. Wang, ACS Catal. 2 (2012) 781–794. doi: 10.1021/cs200652y
C. Zhu, J. Yang, J. Zhang, et al., Interdiscip. Mater. 3 (2024) 74–86. doi: 10.1002/idm2.12141
Z. Zhang, L. Li, Y. Qing, et al., J. Phys. Chem. C 122 (2018) 23852–23860. doi: 10.1021/acs.jpcc.8b06550
Y.H. Lee, K.H. Chang, C.C. Hu, J. Power Sources 227 (2013) 300–308. doi: 10.1016/j.jpowsour.2012.11.026

Figure 1 The synthesis process of preparing nitrogen-rich doped carbon aerogel using cellulose as the carbon source.

Figure 2 SEM image of (a) CA, (b) CA-N4, (c) CA-N5. An additional SEM image of (d) CA-N4 along with its corresponding element mapping images for (e) carbon (C), (f) nitrogen (N), and (g) oxygen (O). (h) N2 adsorption/desorption isotherms and (i) Barrett-Joyner-Halenda (BJH) pore size distributions for CA and CA-N4.

Figure 3 (a) XRD patterns, (b) Raman spectra, (c) XPS spectra and (d) N 1s spectra of the CA and CA-N.

Figure 4 Cyclic voltammetry (CV) cures of (a) CA, (b) CA-N1, (c) CA-N2, (d) CA-N3, (e) CA-N4, (f) CA-N5.

 扫一扫看文章

扫一扫关注我们
 DownLoad:
 下载:
下载:
