Figure 1.
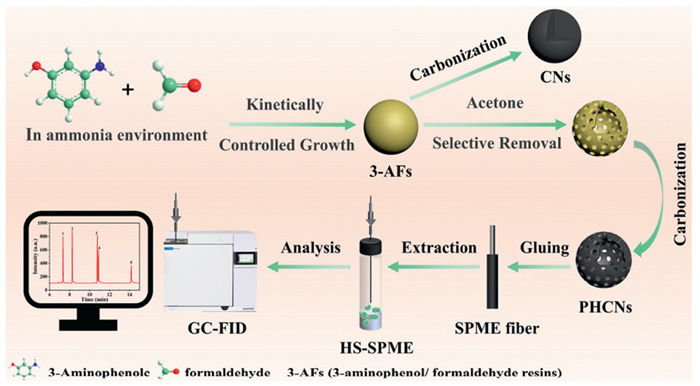
Schematic procedure for synthesis of PHCNs and utilization as HS-SPME fiber coating for enrichment of PAHs.
Synthesis of mesopore-rich hollow carbon nanospheres as headspace solid-phase microextraction coating to extract PAHs from water and honey
Jiawen Zhu , Yingge Hao , Zhen Song , Huina Zhou , Youmei Wang , Ling Yan , Minghua Lu

As a type of persistent organic pollutants, polycyclic aromatic hydrocarbons (PAHs) have received sustained concern because of their widespread presence and high toxicity [1–3]. PAHs can be released into the environment through both natural processes and human activities, such as volcanic activity, natural fires, coal burning and vehicle emissions [4,5]. PAHs can also be migrated over long distances through various environmental media. In addition, their high chemical stability and difficult to degrade properties make them ubiquitous in the environment. They are easily absorbed and accumulated through the food chain due to their low water solubility, hydrophobicity and lipophilicity, which have adverse effects on ecological environment and human beings. Monitoring the content of PAHs is the most essential part to minimize their entry into environment and reduce food chain contamination [6,7]. However, the direct determination of PAHs commonly faces tremendous challenges due to low concentrations (usually at ng/L to μg/L levels) and interferences from complex samples [8]. Therefore, the combination of sample pretreatment technique is usually required prior to instrumental analysis.
In traditional sample preparation, soxhlet, ultrasonic extraction, and liquid-liquid extraction are commonly used methods [9]. However, these techniques typically require large volumes of organic solvents. Owing to easy operation, high efficiency, and environmentally friendly, the sorbent-based extraction technique, such as dispersive solid-phase extraction [10,11], magnetic solid-phase extraction [12,13], and solid-phase microextraction (SPME) [14–16] attracted considerable attention. To improve extraction efficiency and expand the scope of applications, various new materials such as metal-organic frameworks [17] and covalent organic frameworks [18,19] were utilized as sorbents. Among all sorbent-based extraction methods, SPME which integrates sampling, separation, enrichment and injection into a single step, was considered as a simple, green and automatic sample pretreatment technique [20–22]. Nowadays, this technology combined with a variety of modern analytical equipment and detection instrument is widely used in environmental monitoring, food analysis, bioanalysis and cell studies [23–25]. According to difference in extraction ways, SPME can be divided into direct immersion SPME and headspace SPME (HS-SPME). The HS-SPME exposes the extraction fibers above the sample solution, which not only can protect fiber coating from contamination, but also be able to eliminate non-volatile interference in sample solution, which making the extraction process cleaner and more efficient [26]. The coating material is the core of SPME, which has an enormous impact on the sensitivity and selectivity of the analytical method, as well as accuracy and reliability of the analytical results [27]. However, commercialized coating materials are very limited and cannot meet the extraction needs to all target substances. Therefore, developing new SPME coating materials has become a key step in development of this technique.
In recent years, carbon-based materials including carbon nanotubes, graphene, and nitrogen-doped carbon have aroused numerous interests in the field of material and chemistry due to their great application potential in various fields, such as energy storage/conversion [28], catalyst [29], biomedicine [30], and adsorption [31]. Notably, hollow carbon nanostructures (HCNs) have gradually become the focus benefiting from its unique structure and excellent stability [32,33], making it a promising candidate as SPME coating [34,35]. Unfortunately, the fabrications of HCNs mainly relied on template-based methods, which involve cumbersome operating procedures such as templates synthesis, carbon precursors coating, and templates removal and inevitable problems including time-consuming and low yield. In addition, the structural regulation of HCNs is challenged owing to the limited availability of suitable templates [36,37]. Therefore, the facile and tunable synthetic approaches free from template limitation are highly desired for preparation of HCNs.
Herein, 3-aminophenol/formaldehyde resins (3-AFs) with good thermal stability and high carbonization yield was used as precursors to form carbon nanospheres with uniform shape. The internal components of carbon nanospheres exhibit inhomogeneity. The porous hollow carbon nanospheres (PHCNs) were obtained by selectively removing the interior part of inhomogeneous nanospheres with acetone and carbonization. This template-free synthetic strategy only relies on resin molecules to form inner compositional inhomogeneity without introducing tedious operations like coating and etching. Compared with solid carbon nanospheres (CNs) obtained by directly carbonizing 3-AF resin molecules, PHCNs possess larger interfaces and defects, higher specific surface area, and more abundant nanopores. For the first time, PHCNs was used as the fiber coating material of SPME. The PHCNs coated fiber of HS-SPME was employed to non-contact extract and preconcentrate trace PAHs in water and honey samples prior to GC-FID analysis.
The steps for preparation of PHCNs and procedures to extract PAHs with PHCNs as fiber coating of HS-SPME were displayed in Fig. 1 and described in detail in Supporting information. In the wide-angle X-ray diffraction (XRD) pattern (Fig. 2a), it can be seen that PHCNs exhibit two prominent broad peaks at 23.5° and 43.7°, which usually to be assigned to the (002) and (100) diffraction modes and characterized by an amorphous carbonaceous structure. This structure can be further verified by Raman spectrum (Fig. 2b). Two obvious characteristic peaks present at the positions of 1350 cm−1 and 1580 cm−1, corresponding to disordered sp3 hybridized carbon (D band) and graphitic sp2 hybridized carbon (G band) [38]. The intensity ratio of D band and G band (ID/IG) can estimate the degree of graphitization of materials [39]. The ID/IG value of PHCNs and CNs were calculated as 1.28 and 1.20, respectively. PHCNs have a higher ID/IG ratio, which indicating the existence of more plentiful defects and disordered carbon in their structure, these results are beneficial for the extraction and adsorption in sample pretreatment.
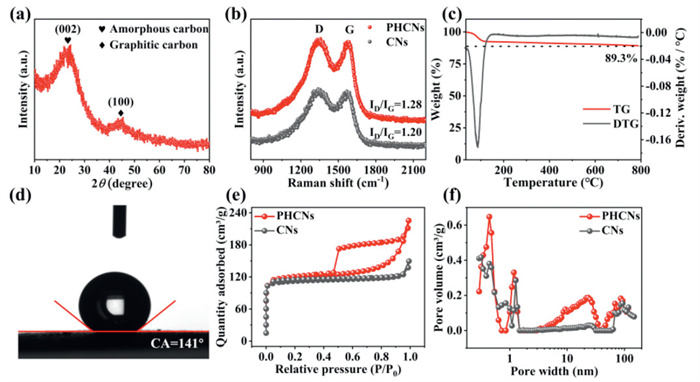
Due to high temperature is usually required for desorption of target analytes from fiber coating in SPME, the thermal stability of fiber coating material was investigated and the result was illustrated in Fig. 2c. The thermogravimetric analysis (TGA) curve of PHCNs showed that only 10.7% weight loss with elevating temperature from 25 ℃ to 800 ℃. The result demonstrates the PHCNs as fiber coating material possess excellent thermal stability. At the same time, the thermal stability of 3-AFs was studied. As shown in Fig. S3 (Supporting information), the thermogravimetric curve of 3-AFs mainly includes two stages of weightlessness, corresponding to volatilization of solvent and removal of hydrogen and oxygen atoms, respectively. The carbon yield at 800 ℃ is approximately 44.5%. To achieve the hydrophilic property of coating material, the contact angle of PHCNs was studied (Fig. 2d). The experimental result demonstrates the contact angle was approximately 141°, which indicating that the surface of PHCNs had hydrophobic property.
The N2 adsorption-desorption isotherms were conducted to gain insights into the structural porosity properties of PHCNs and CNs. As shown in Fig. 2e, it can be achieved that CNs was close to the Langmuir isotherm of type I, suggesting that it had microporous structure. PHCNs exhibited a type Ⅳ isotherm and a considerable of H4 type hysteresis loop with a capillary condensation step (0.45 < P/P0 < 1.0), indicating the mesoporous structural features of this material. Additionally, it should be noted that the sharp upward trend at a low relative pressure (P/P0 < 0.1) also implying the presence of micropores in this material, which is in accordance with the literature reported [40–42]. The specific surface areas based on the Brunauer-Emmet-Teller (BET) method were calculated as 457 m2/g and 448 m2/g for PHCNs and CNs, respectively. Table S1 (Supporting information) lists the detailed pore data parameters of PHCNs (3.05 nm, 0.35 cm³/g) and CNs (2.06 nm, 0.23 cm³/g). Compared with CNs, both the average pore size and pore volume of PHCNs were increased, which might be ascribed to the emergence of mesoporous structure. Fig. 2f illustrates the corresponding pore size distributions curves, further showed that PHCNs contained more open pore structures, which enabled to provide more potential interaction sites, better accommodate target analytes and enhance the adsorption capacity.
The chemical elements and surface electronic states of the PHCNs was further studied by X-ray photoelectron spectroscopy (XPS). According to the XPS full spectrum (Fig. S1 in Supporting information) of the PHCNs, three characteristic peaks of C 1s, N 1s and O 1s were detected, indicating that the material was composed of C, N and O elements. Fig. S2d (Supporting information) can be observed that three peaks with binding energies at around 284.67, 285.67 and 289.0 eV were represented the C-C/C = C and C-N group and C = O, respectively. It the high-resolution N 1s XPS spectrum (Fig. S2e in Supporting information), three fitting curves located at 398.22, 400.88 and 404.73 eV were attributed to pyridinic N, pyrrolic N, and graphitic N, respectively [43]. It can be seen from the O 1s energy spectrum (Fig. S2f in Supporting information) that three peaks appeared at 530.51, 532.03 and 533.47 eV were corresponded to O-H, C = O and C-O [44]. Based on the above results, this material is partially graphitized carbon with various forms of nitrogen doping. Large amounts of C = C and C-N contribute to forming π-π interactions, which facilitates binding of analytes and sorbent.
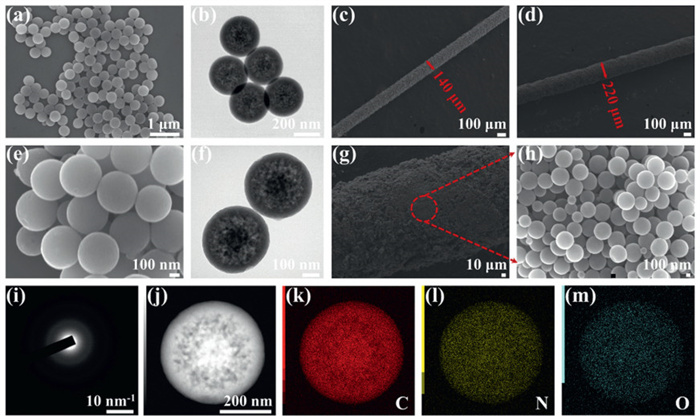
The surface morphology of the PHCNs and PHCNs-coated fiber were observed by the scanning electron microscopy (SEM). As shown in Figs. 3a and e, PHCNs showed the morphologies with uniform spherical shape and a diameter of about 400 nm. The transmission electron microscopy (TEM) results further revealed the internal structure of materials (Fig. 3,Fig. 3), the nanospheres have obvious cavities, indicated that the successful formation of porous hollow structure. The TEM images of CNs are shown in Fig. S4 (Supporting information), and the size of CNs is similar to that of PHCNs but pore structure cannot be observed. Compared with the bare fiber (stainless-steel wire corroded by aqua regia, Fig. 3c) and PHCNs-coated fiber (Fig. 3d), the thickness of fiber coating was approximately 40 µm after physical bonding process. It can be seen from Fig. 3g, the original bare fiber substrate was immobilized with a uniform and dense PHCNs coating. The enlarged SEM photo is presented in Fig. 3h. Furthermore, no clear diffraction points were found in selected area electron diffraction (SADE, Fig. 3i), which indicated that carbon was amorphous. The elements analysis was investigated and the results could reflect that elements of C, N and O were evenly dispersed in the PHCNs (Figs. 3j–m).
In order to obtain the best extraction performance, six experimental parameters including extraction temperature, agitation speed, salt concentration, extraction time, desorption time, and desorption temperature were optimized for the HS-SPME process. Three parallel experiments were performed for each parameter, and the average values were used for evaluation. The effect of various parameters on the efficiency is further explained. The detailed discussion and results are presented in Supporting information (Fig. S5 and Section S10 in Supporting information). Follow-up experiments were performed under optimal extraction parameters. The performance of the established HS-SPME method based on PHCNs coated fiber for PAHs was evaluated. The results are listed in Table 1. The method presents favorable linearity for the five PAHs in the range of 0.01–30 ng/mL with correlation coefficient (R2) ranged from 0.9921 to 0.9994. The limits of detection (LODs, S/N = 3) and limits of quantification (LOQs, S/N = 10) were calculated as 0.003–0.006 ng/mL and 0.01–0.02 ng/mL, respectively. The enrichment factors (EFs) are considered as an important index to evaluate the extraction performance of SPME fiber, provided a very intuitive comparison of the properties of fiber-coated materials. Specific calculation method of EFs is listed in Section S7 (Supporting information). The EFs of PHCNs for PAHs ranged from 5420 to 9211, which were significantly higher than those of the other fiber coating materials (Table 2). The reproducibility and repeatability of the method was also determined, the intraday RSDs (n = 3) with analysis three times ranged from 1.80% to 4.25%, the interday RSDs (n = 3) for three consecutive days ranged from 2.62% to 9.39% and the fiber-to-fiber RSDs (n = 3) were between 3.75% and 8.69%. These results demonstrate that the method is precise and sensitive enough.
 DownLoad:
CSV
DownLoad:
CSV
| Analytes | Linear range (ng/mL) | R2 | LODs (ng/mL) | LOQs (ng/mL) | EFs | RSD (%) | ||
| Intraday (n = 3) | Interday (n = 3) | Fiber to fiber (n = 3) | ||||||
| ACE | 0.01–30 | 0.9921 | 0.003 | 0.01 | 6818 | 1.80 | 3.53 | 8.10 |
| FLU | 0.01–30 | 0.9994 | 0.003 | 0.01 | 8895 | 3.43 | 3.10 | 3.75 |
| PHE | 0.02–30 | 0.9979 | 0.006 | 0.02 | 9211 | 3.02 | 2.62 | 6.78 |
| ANT | 0.02–30 | 0.9974 | 0.006 | 0.02 | 6598 | 2.02 | 6.51 | 5.74 |
| PYR | 0.02–30 | 0.9987 | 0.006 | 0.02 | 5420 | 4.25 | 9.39 | 8.69 |
DownLoad:
CSV
| Fiber coatings | Real samples | Linear ranges (ng/mL) | LODs (ng/mL) | Extraction time (min) | Thermal stability (℃) | Lifespan (times) | EFs | Analytical methods | Recovery (%) | Ref. | ||||||||||||||||||||||||||||||||||||||||||||||||||||||||||||||||||
| PAN/CPa | Water | 1–200 | 0.10–0.32 | 40 | 357 | 20 | N.P. | DI-SPME-GC-FID | 86.0–105.0 | [45] | ||||||||||||||||||||||||||||||||||||||||||||||||||||||||||||||||||
| PIL-benzyl | River water and sea water | 0.02–20 | 0.01–0.04 | 60 | N.P. | N.P. | N.P. | HS-SPME-GC-FID | 67.2–130.0 | [46] | ||||||||||||||||||||||||||||||||||||||||||||||||||||||||||||||||||
| TAPB-TMC-COF | Water | 2–2000 | 0.29–0.94 | 32 | N.P. | N.P. | 819–2420 | HS-SPME-GC-FID | 75.0–105.0 | [47] | ||||||||||||||||||||||||||||||||||||||||||||||||||||||||||||||||||
| PG/OTMSb | Lake water | 0.1–100 | 0.03–0.05 | 50 | 800 | N.P. | 941–5171 | HS-SPME-GC-FID | 63.88–116.51 | [48] | ||||||||||||||||||||||||||||||||||||||||||||||||||||||||||||||||||
| PPy-DSc | Water | 0.5–100 | 0.05–0.16 | 50 | 300 | 50 | N.P. | HS-SPME-GC-FID | 83.0–108.0 | [49] | ||||||||||||||||||||||||||||||||||||||||||||||||||||||||||||||||||
| APTES-SBA-15 | River water and sea water | 0.05–100 | 0.04–0.24 | 30 | 340 | 50 | N.P. | HS-SPME-GC-FID | 101.0–110.0 | [50] | ||||||||||||||||||||||||||||||||||||||||||||||||||||||||||||||||||
| PHCNs | Water and honey | 0.01–30 | 0.003–0.006 | 25 | 800 | 60 | 5420–9211 | HS-SPME-GC-FID | 80.93–118.0 | This work | ||||||||||||||||||||||||||||||||||||||||||||||||||||||||||||||||||
| N.P.: Not proved. | ||||||||||||||||||||||||||||||||||||||||||||||||||||||||||||||||||||||||||||
| a Polyacrylonitrile/clinoptilolite. | ||||||||||||||||||||||||||||||||||||||||||||||||||||||||||||||||||||||||||||
| b Phosphogypsum/octadecyltrimethoxysilane. | ||||||||||||||||||||||||||||||||||||||||||||||||||||||||||||||||||||||||||||
| c Dodecylsulfate-doped polypyrrole. | ||||||||||||||||||||||||||||||||||||||||||||||||||||||||||||||||||||||||||||
The lifespan of PHCNs-coated fiber was investigated by evaluating the extraction performance of fiber after it was subjected to different extraction/desorption cycles. Fig. S6 (Supporting information) illustrate that, for the same fiber, no obvious decrease in the extraction performance for the PAHs were found within 60 replicate extractions, manifesting that the fiber has a good durability. The thermal stability of PHCNs is crucial for the reusability of SPME fiber and the precision and accuracy of SPME analysis. In Fig. 2c, the PHCNs coating shows satisfactory thermal stability, meaning that it can meet the thermal desorption of the PAHs from the coating in GC-FID detection. Furthermore, the chemical stability of PHCNs coating was tested by saturating coating into different organic solvents for 24 h, including acetone, methanol, ethyl acetate and acetonitrile and immersing into water for different time (24, 48 h). In addition, the stability of PHCNs after soaking in acidic and alkaline solutions for 24 h was also investigated, the results are presented in Fig. S7 (Supporting information), no significant changes were observed in the structure of PHCNs. Therefore, it can be proved that the PHCNs has good reusability, thermal stability and chemical resistance, which shows that PHCNs have the vastly potential to become fiber coating candidate materials and are suitable to be used in solid phase microextraction.
To further assess the practicality of the analytical method, the PHCNs based HS-SPME was investigated for the determination of PAHs from campus lake water and lime tree honey. To facilitate comparison, direct injection analysis, post-extraction analysis, spiked post-extraction analysis were performed on two real samples. The chromatograms of PAHs extracted from campus lake water and lime tree honey are shown in Figs. 4a and b. It can be seen that the target PAHs were not detected by direct analysis (curve Ⅰ). The post-extraction analysis chromatogram was obtained by the pretreatment of real samples with PHCNs as the fiber coating (curve Ⅱ). Among the five target analytes, ACE was found to be at 0.15 ng/mL in campus lake water. The concentration of ACE and ANT in lime tree honey were 0.10 ng/mL and 0.07 ng/mL, respectively. Moreover, the established enrichment method was used to analyze the actual samples spiked by PAHs mixed standard solution with three concentrations (0.2, 4, 20 ng/mL). The concrete extraction recoveries of analytes are shown in Table S2 (Supporting information) and Fig. 4c. The recoveries ranged from 81.20% to 106.1% were achieved for analysis in campus lake water, and the RSDs were 3.36%–9.55%. In lime tree honey, the recoveries were between 80.93% and 118.0% with relative standard deviation in the range of 2.12%–10.58%. Meanwhile, the matrix effects (ME) of the adsorption process in two actual samples were evaluated, as shown in Section S13 and Table S5 (Supporting information). The results showed there were mild suppression or negligible effect matrix effects in campus water and lime tree honey. These results verify that the established analytical method is suitable for the enrichment and detection of PAHs in complex matrices.
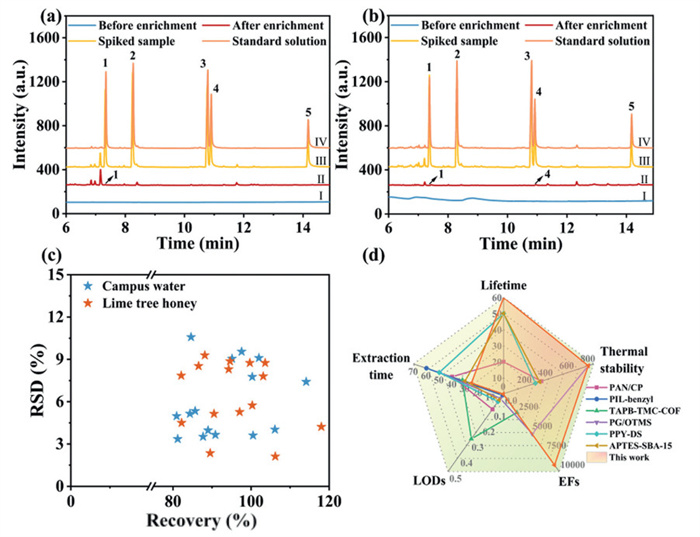
It is compared with other reported coating materials and methods [45–50] to further assess the superiority of PHCNs as SPME fiber coating for extraction and preconcentration of PAHs. The detailed results are shown in Table 2. It can be seen that, the LODs values are lower than those obtained methods, when utilizing the PHCNs coating, which ranged from 0.003 ng/mL to 0.006 ng/mL. Moreover, this method reached extraction equilibrium in a short time (25 min), providing great convenience for practical operation. Besides, the fiber coating material PHCNs demonstrated excellent thermal stability (> 800 ℃) compared with other previously reported coating materials, which greatly meet the needs of the experiment. It is worth noting that the enrichment factors of this method were calculated as 5420–9211, showing outstanding enrichment capacity for PAHs. Compared with other reported coating materials, this PHCNs coating material demonstrates many advantages, such as easy preparation, low costing, and excellent extract performance. This method also exhibited the reasonable recoveries rate ranged from 80.93% to 118.0%. All above results are more intuitively shown in Fig. 4d, indicate that PHCNs synthesized in this work is a feasible, promising and practical fiber coating material for extraction and preconcentration of trace PAHs in real samples.
Based on the above experiments, the possible extraction mechanism of the PHCNs coated fiber for PAHs was investigated and discussed. PHCNs has rich mesoporous structure, which could offer more potential interaction sites and spatial match effects for the extraction of target analytes. According to the molecular size of target PAHs (Fig. S8 in Supporting information), the formed mesopores can better accommodate the target PAHs [51]. PHCNs also has a unique built-in cavity that greatly facilitates mass transfer and promotes extraction performance [52]. Meanwhile, during the high-temperature carbonization process, a large number of oxygen atoms in 3-AFs are removed, resulting in many vacancy defects, so PHCNs has a high ID/IG ratio. The presence of plentiful defects and disordered carbon are beneficial for the extraction and adsorption in sample pretreatment [53]. Moreover, CH/π interactions, which are weak hydrogen bonds caused between hydrogen atoms of alkyl or aryl group (H donor) and π-face of aromatic ring (H acceptor), also promotes adsorption [54,55]. In addition, the PHCNs is rich in benzene rings and C = N bonds, making it highly hydrophobic. Hydrophobic is expected to have an impact on the enrichment effect. The influence of hydrophobic interaction between PAHs and PHCNs on EFs during extraction was discussed. The n-octane/water partition coefficient of the target analytes, usually expressed as logKo/w, were used as the hydrophobicity indicator. The detailed parameters were listed in Table S3 (Supporting information). It can be seen from Fig. S9 (Supporting information) that except for PHE and PYR, which showed a deviation from the overall trend due to the relatively high boiling point [56,57], the enrichment factors of the other three PAHs were positively correlated with logKo/w as a whole, but the correlation coefficient was only 0.6627. The results show that the extraction process is accompanied with hydrophobic interaction to some extent, but it is not the main factor. Importantly, the PHCNs obtained from the carbonization of polymer 3-AFs still retains the benzene ring skeleton, the π-π stacking interaction between the carbon ring structure and the target molecules also plays a critical role in the enrichment of PAHs [58]. The interaction mechanisms between PHCNs and PAHs are further elucidated and fitted using XPS. As shown in Fig. S2 (Supporting information), the binding energy of C–C/C = C shifted from 284.67 eV to 284.64 eV, suggesting potential π–π interactions during the PAHs adsorption process [59]. The charge distribution on the surface of the PHCNs in different pH solutions was characterized by testing zeta potential. According to Fig. S10 (Supporting information), the potential of zero charge point (pHPZC) of the material is determined as pH 7.99. To verify the adsorption selectivity of the PHCNs fiber coating, the adsorption performances of other analytes including polychlorinated biphenyls (PCBs) and phthalate esters (PAEs) has been investigated. Experimental results are shown in Table S4 (Supporting information) and corresponding explanation are listed in Section S11 (Supporting information). Research shows that, PHCNs does exhibit the non-specific adsorption, but it also gives us a new way of thinking to hopefully enrich other compounds with similar structures to PAHs.
In this work, the mesopore-rich hollow carbon nanospheres were synthesized by template-free and surfactant-free method. This synthetic route only relies on inner compositional inhomogeneity of resin nanoparticles without introducing tedious operations, which making it very simple and efficient for the production of hollow structure. The prepared PHCNs was applied as SPME fiber coating and demonstrated excellent extraction and enrichment performance to PAHs. The developed HS-SPME with PHCNs as fiber coating coupled with GC-FID was successfully applied to efficiently enrich and sensitively detect PAHs in water and honey samples. The high enrichment ability exhibited by this PHCNs can be mainly attributed to unique cavity structure and mesoporous filling effect, π-π stacking interaction and the existence of CH/π interactions. The PHCNs provided a new fiber coating material of SPME to extract and enrich compounds which have similar chemical structure to PAHs in complex samples.
The authors declare that they have no known competing financial interests or personal relationships that could have appeared to influence the work reported in this paper.
Jiawen Zhu: Writing – original draft, Investigation, Formal analysis, Data curation, Conceptualization. Yingge Hao: Software, Investigation, Funding acquisition. Zhen Song: Validation, Resources, Data curation. Huina Zhou: Visualization, Validation, Software, Resources. Youmei Wang: Visualization, Methodology, Investigation, Funding acquisition. Ling Yan: Writing – review & editing. Minghua Lu: Writing – review & editing, Supervision, Project administration, Funding acquisition.
This work was supported by National Natural Science Foundation of China (No. 22376053). The project has also been supported by the Natural Science Foundation of Henan Province, China (No. 242300421034), and Henan Key Scientific Research Programs to Universities and Colleges (No. 22ZX003).
Supplementary material associated with this article can be found, in the online version, at doi:
S. Tarigholizadeh, S. Sushkova, V.D. Rajput, et al., J. Agric. Food Chem. 72 (2023) 46–64.
S. Huo, X. Deng, Nan Yang, et al., Chem. Eng. J. 481 (2024) 148562. doi: 10.1016/j.cej.2024.148562
Y. Liu, S. Zhou, Y. Kuang, et al., Talanta 271 (2024) 125655. doi: 10.1016/j.talanta.2024.125655
L. Singh, J.G. Varshney, T. Agarwal, et al., Food Chem. 199 (2016) 768–781. doi: 10.1016/j.foodchem.2015.12.074
D. Baskaran, H.S. Byun, Chem. Eng. J. 498 (2024) 155334. doi: 10.1016/j.cej.2024.155334
Z. Meng, K.A. Mirica, Chem. Soc. Rev. 50 (2021) 13498. doi: 10.1039/d1cs00600b
H. Wang, X. Huang, Z. Kuang, et al., J. Hazard. Mater. 453 (2023) 131372. doi: 10.1016/j.jhazmat.2023.131372
P. Li, Y. Han, D. Hana, et al., Green Chem. 26 (2024) 3211–3220. doi: 10.1039/d3gc04764d
E. Torabi, A. Abdar, N. Lotfian, et al., Coord. Chem. Rev. 506 (2024) 215680. doi: 10.1016/j.ccr.2024.215680
M. Li, X. Ren, Y. Gao, et al., Chin. Chem. Lett. 35 (2024) 109699. doi: 10.1016/j.cclet.2024.109699
P. Qin, S. Zhu, M. Li, et al., Chin. Chem. Lett. 34 (2023) 135272.
Y. Li, J. Hu, L. C, et al., Anal. Chem. 96 (2024) 5757–5762. doi: 10.1021/acs.analchem.4c00063
H. Liu, Y. Li, Y. Xiang, et al., J. Anal. Test. 8 (2024) 245–250. doi: 10.1007/s41664-024-00300-7
S. Zhu, Z. Song, Y. Wang, et al., J. Hazard. Mater. 480 (2024) 136362. doi: 10.1016/j.jhazmat.2024.136362
J. Zheng, Y. Kuang, S. Zhou, et al., Talanta 187 (2018) 337–347. doi: 10.3846/ijspm.2018.5368
Y. Tu, H. Li, Y. Xue, et al., Talanta 278 (2024) 126503. doi: 10.1016/j.talanta.2024.126503
M. Bazargan, F. Ghaemi, A. Amiri, et al., Coord. Chem. Rev. 445 (2021) 214107. doi: 10.1016/j.ccr.2021.214107
H. Tao, W. Guo, J. Liu, et al., J. Hazard. Mater. 467 (2024) 133764. doi: 10.1016/j.jhazmat.2024.133764
W. Guo, H. Tao, H. Tao, et al., Anal. Chim. Acta 1287 (2024) 341953. doi: 10.1016/j.aca.2023.341953
E. Torabi, M. Mirzaei, M. Bazargan, et al., Anal. Chim. Acta 1224 (2022) 340207. doi: 10.1016/j.aca.2022.340207
H. Tao, J. Liu, W. Guo, J. Anal. Test. 8 (2024) 441–450. doi: 10.1007/s41664-024-00330-1
S. Xu, H. Li, L. Xiao, et al., Anal. Chem. 96 (2024) 10772–10779. doi: 10.1021/acs.analchem.4c01900
D. Li, M. Qin, X. Lou, et al., J. Chromatogr. A 1737 (2024) 465463. doi: 10.1016/j.chroma.2024.465463
H. Han, S. Ding, Y. Geng, et al., Food Chem. 403 (2023) 134310. doi: 10.1016/j.foodchem.2022.134310
A. Napylov, N. Reyes-Garces, G. Gomez-Rios, et al., Angew. Chem. Int. Ed. 59 (2020) 2392–2398. doi: 10.1002/anie.201909430
M. Li, X. Ren, Y. Gao, et al., Chem. Commun. 58 (2022) 7574–7577. doi: 10.1039/d2cc02461f
M. Mu, S. Zhu, Y. Gao, et al., Food Chem. 459 (2024) 140276. doi: 10.1016/j.foodchem.2024.140276
X. Ren, H. Liu, J. Wang, et al., Chin. Chem. Lett. 35 (2024) 109282. doi: 10.1016/j.cclet.2023.109282
J. Yang, S. Tian, Z. Song, et al., Coordin. Chem. Rev. 523 (2025) 216257. doi: 10.1016/j.ccr.2024.216257
Y. Liu, L. Zhang, H. Cai, et al., Sci. Bull. 69 (2024) 3127–3149. doi: 10.3390/s24103127
M.M. AsI, H. Shirkhanloo, N. Mansouri, et al., J. Anal. Test. 7 (2023) 444– 458. doi: 10.1007/s41664-023-00272-0
S. Zhu, X. Lou, J. Zhu, et al., Chem. Eng. J. 488 (2024) 150876. doi: 10.1016/j.cej.2024.150876
D.S. Bin, Z.X. Chi, Y. Li, et al., J. Am. Chem. Soc. 139 (2017) 13492–13498. doi: 10.1021/jacs.7b07027
S. Feng, K. Li, P. Hu, et al., ACS Nano 17 (2023) 23152–23159. doi: 10.1021/acsnano.3c09328
Y. Liu, J. Han, G. Chen, et al., Anal. Chim. Acta 1329 (2024) 343191. doi: 10.1016/j.aca.2024.343191
Y. Qian, Y. Luo, Y. Li, et al., Chem. Eng. J. 467 (2023) 143433. doi: 10.1016/j.cej.2023.143433
Z. Zhang, M. Qin, B. Jia, et al., Chem. Comm. 53 (2017) 2922–2925. doi: 10.1039/C7CC00219J
F. Yang, F. Zhang, Y. Song, et al., J. Energy Storage 85 (2024) 111160. doi: 10.1016/j.est.2024.111160
D. Li, X. Ren, Q. Ai, et al., Adv. Energy Mater. 8 (2018) 1802386. doi: 10.1002/aenm.201802386
T. Huang, Z. Wu, Q. Yu, et al., Chem. Eng. J. 359 (2019) 69–78. doi: 10.1016/j.cej.2018.11.108
Y. Qin, L. Miao, M. Mansuer, et al., ACS Appl. Mater. Interfaces 14 (2022) 33328–33339. doi: 10.1021/acsami.2c08342
X. Yang, Y. Li, P. Zhang, et al., Carbon 157 (2020) 70–79. doi: 10.1016/j.carbon.2019.10.008
P. Liu, S. Gao, Y. Wang, et al., Chem. Eng. J. 381 (2020) 122653. doi: 10.1016/j.cej.2019.122653
D. Zhang, S. Shen, X. Xiao, et al., RSC Adv. 10 (2020) 26546–26552. doi: 10.1039/d0ra02935a
A. Mollahosseini, M. Rastegari, M. Panahi-Dehghan, et al., J. Chromatogr. Sci. 60 (2022) 401–407. doi: 10.1093/chromsci/bmab082
M. Merdivana, V. Pinob, J.L. Anderson, et al., Environ. Technol. 15 (2016) 1897–1904.
X. Yang, J. Wang, W. Wang, et al., Microchim. Acta 186 (2019) 1–8. doi: 10.1007/s00604-018-3127-5
L. Xu, W. Hu, J. Zhang, et al., Chem. Pap. 77 (2023) 6947–6957. doi: 10.1007/s11696-023-02988-w
A. Mohammadi, Y. Yamini, N. Alizadeh, J. Chromatogr. A 1063 (2005) 1–8. doi: 10.1016/j.chroma.2004.11.087
M.B. Gholivand, M.M. Abolghasemi, P. Fattahpour, Chromatographia 74 (2011) 807–815. doi: 10.1007/s10337-011-2146-8
M. Kalantari, J. Zhang, Y. Liu, et al., Chemosphere 215 (2019) 716–724. doi: 10.1016/j.chemosphere.2018.10.071
A.L.S. Vieira, R.S. Ribeiro, A.R. Lado Ribeiro, et al., J. Environ. Chem. Eng. 10 (2022) 107348. doi: 10.1016/j.jece.2022.107348
A.O. Abo El Naga, S.A. Shaban, F.Y.A. El Kady, J. Taiwan Inst. Chem. Eng. 93 (2018) 363–373. doi: 10.1016/j.jtice.2018.07.044
Y. Umezawa, S. Tsuboyama, H. Takahashi, et al., Carbohydr. Polym. 55 (1999) 10047–10056.
T. Yamate, K. Kumazawa, H. Suzuki, et al., ACS Macro Lett. 5 (2016) 858–861. doi: 10.1021/acsmacrolett.6b00265
Y. Rong, C. Pan, K. Song, et al., Chem. Eng. J. 461 (2023) 141979. doi: 10.1016/j.cej.2023.141979
Y. Sun, W. Sun, J. Li, et al., J. Hazard. Mater. 462 (2024) 132699. doi: 10.1016/j.jhazmat.2023.132699
Z. Zhao, W. Wu, W. Li, et al., ACS EST Eng. 4 (2024) 1635–1643. doi: 10.1021/acsestengg.4c00060
X. Tian, Y. Hao, J. Yang, et al., Chem. Eng. J. 500 (2024) 157223. doi: 10.1016/j.cej.2024.157223

Figure 1 Schematic procedure for synthesis of PHCNs and utilization as HS-SPME fiber coating for enrichment of PAHs.

Figure 2 (a) XRD pattern. (b) Raman spectrum. (c) TGA curve. (d) Contact angle. (e) N2 adsorption-desorption isotherms. (f) Pore size distribution.

Figure 3 (a, e) SEM images of PHCNs. (b, f) TEM images of PHCNs. (c) bare fiber. (d, g) PHCNs-coated fiber. (h) Surface of SPME fiber coating. (i) SAED result. Mapping analysis of PHCNs (j) and its corresponding element mapping images (k-m: C, N, O).

Figure 4 The chromatogram for analysis of campus lake water (a) and lime tree honey (b). Direct injection of real sample (Ⅰ) with volume of 1 μL, extraction of real sample (Ⅱ) with PHCNs as fiber coating, chromatogram of spiked real sample (20 ng/mL) after extraction (Ⅲ), and extraction of mixed standard solution concentration of 20 ng/mL (Ⅳ). Peak identification: (1) ACE, (2) FLU, (3) PHE, (4) ANT, (5) PYR. The recoveries and RSDs of target PAHs in two real samples using the PHCNs based HS-SPME fiber coating (c). Comparison of PHCNs coated fiber with other fiber coatings for determination of PAHs (d).
Table 1. Analytical performance of the HS-SPME using PHCNs as fiber coating for analysis of PAHs.
| Analytes | Linear range (ng/mL) | R2 | LODs (ng/mL) | LOQs (ng/mL) | EFs | RSD (%) | ||
| Intraday (n = 3) | Interday (n = 3) | Fiber to fiber (n = 3) | ||||||
| ACE | 0.01–30 | 0.9921 | 0.003 | 0.01 | 6818 | 1.80 | 3.53 | 8.10 |
| FLU | 0.01–30 | 0.9994 | 0.003 | 0.01 | 8895 | 3.43 | 3.10 | 3.75 |
| PHE | 0.02–30 | 0.9979 | 0.006 | 0.02 | 9211 | 3.02 | 2.62 | 6.78 |
| ANT | 0.02–30 | 0.9974 | 0.006 | 0.02 | 6598 | 2.02 | 6.51 | 5.74 |
| PYR | 0.02–30 | 0.9987 | 0.006 | 0.02 | 5420 | 4.25 | 9.39 | 8.69 |
 下载: 导出CSV
Table 2. Comparison with other reported materials as fiber coating of SPME for analysis of PAHs.
| Fiber coatings | Real samples | Linear ranges (ng/mL) | LODs (ng/mL) | Extraction time (min) | Thermal stability (℃) | Lifespan (times) | EFs | Analytical methods | Recovery (%) | Ref. | ||||||||||||||||||||||||||||||||||||||||||||||||||||||||||||||||||
| PAN/CPa | Water | 1–200 | 0.10–0.32 | 40 | 357 | 20 | N.P. | DI-SPME-GC-FID | 86.0–105.0 | [45] | ||||||||||||||||||||||||||||||||||||||||||||||||||||||||||||||||||
| PIL-benzyl | River water and sea water | 0.02–20 | 0.01–0.04 | 60 | N.P. | N.P. | N.P. | HS-SPME-GC-FID | 67.2–130.0 | [46] | ||||||||||||||||||||||||||||||||||||||||||||||||||||||||||||||||||
| TAPB-TMC-COF | Water | 2–2000 | 0.29–0.94 | 32 | N.P. | N.P. | 819–2420 | HS-SPME-GC-FID | 75.0–105.0 | [47] | ||||||||||||||||||||||||||||||||||||||||||||||||||||||||||||||||||
| PG/OTMSb | Lake water | 0.1–100 | 0.03–0.05 | 50 | 800 | N.P. | 941–5171 | HS-SPME-GC-FID | 63.88–116.51 | [48] | ||||||||||||||||||||||||||||||||||||||||||||||||||||||||||||||||||
| PPy-DSc | Water | 0.5–100 | 0.05–0.16 | 50 | 300 | 50 | N.P. | HS-SPME-GC-FID | 83.0–108.0 | [49] | ||||||||||||||||||||||||||||||||||||||||||||||||||||||||||||||||||
| APTES-SBA-15 | River water and sea water | 0.05–100 | 0.04–0.24 | 30 | 340 | 50 | N.P. | HS-SPME-GC-FID | 101.0–110.0 | [50] | ||||||||||||||||||||||||||||||||||||||||||||||||||||||||||||||||||
| PHCNs | Water and honey | 0.01–30 | 0.003–0.006 | 25 | 800 | 60 | 5420–9211 | HS-SPME-GC-FID | 80.93–118.0 | This work | ||||||||||||||||||||||||||||||||||||||||||||||||||||||||||||||||||
| N.P.: Not proved. | ||||||||||||||||||||||||||||||||||||||||||||||||||||||||||||||||||||||||||||
| a Polyacrylonitrile/clinoptilolite. | ||||||||||||||||||||||||||||||||||||||||||||||||||||||||||||||||||||||||||||
| b Phosphogypsum/octadecyltrimethoxysilane. | ||||||||||||||||||||||||||||||||||||||||||||||||||||||||||||||||||||||||||||
| c Dodecylsulfate-doped polypyrrole. | ||||||||||||||||||||||||||||||||||||||||||||||||||||||||||||||||||||||||||||
下载: 导出CSV

 扫一扫看文章

扫一扫关注我们