Figure 1.
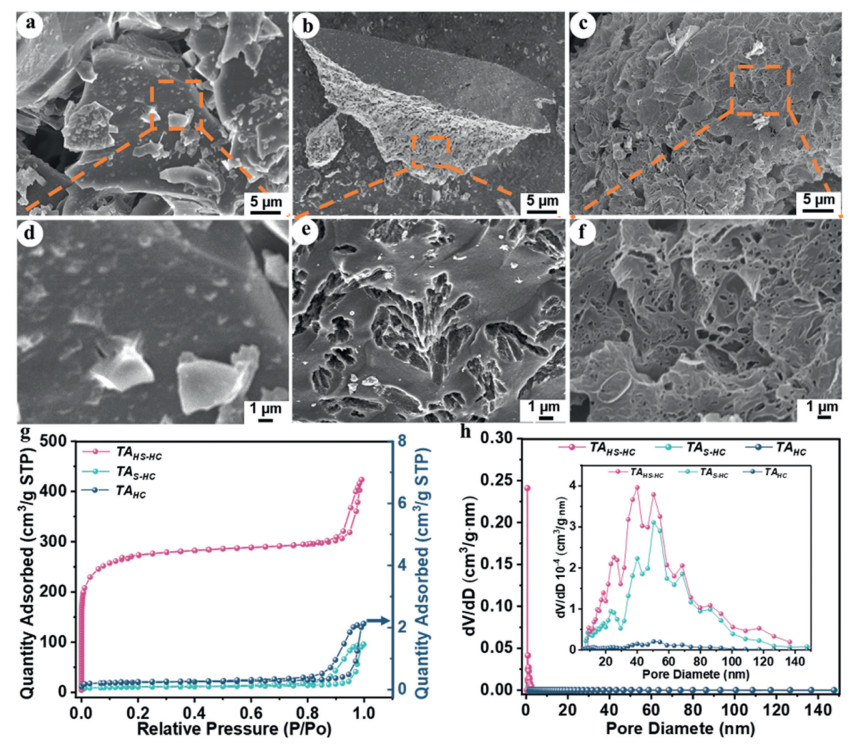
Morphological and structural characterization of TAs. SEM of (a, d) TAHC, (b, e) TAS-HC, and (c, f) TAHS-HC, nitrogen adsorption and (g) desorption isotherms, (h) pore size distribution curves of TAs.
Tannin-derived sulfur-doped carbon with tunable porosity and dilated interlayer spacing for reversible Na-ion diffusion
Yu Su , Jinbo Hu , Laiqiang Xu , Xinwen Jiang , Gonggang Liu , Yuanjuan Bai , Yuanyuan Liao , Shanshan Chang , Xiaowei Cheng

On account of the uneven distribution of lithium distribution and the homogeneous electrochemistry of the two alkali metals of Li and Na, scientists have paid more and more attention on the development of sodium-ion batteries (SIBs) in commercialization [1-4], which have been already valued in industry similarly as lithium-ion batteries (LIBs). It is very important that the exploration of high-performance electrode materials for SIBs should be continuously sought in the upcoming time. Up to now, various alternatives of negative electrodes have been reported in plentiful studies of SIBs, including tin- or antimony-based alloys [5], metal oxides [6], organic compounds [7], and carbon-based materials [8,9]. The hard carbon (HC) is renowned for its exceptional chemical stability and electrochemical activity, which is given way to an excellent anode for SIBs [10-13], presenting a desired electrochemical capacity exceeding 300 mAh/g [14-17]. However, a relatively regrettable kinetics of Na+ has given rise to the low energy density [18]. Moreover, the reduced stability of the solid-electrolyte interface (SEI) on HC anodes has blocked the industrialized application when being performed in a long-term cycling [19-23]. Heteroatom doping (N, S, P, B) in HC has been extensively investigated as an effective strategy to tune the specific surface area, pore structure, and functional groups, which can further modify some key properties as interlayer spacing, ionic conductivity and sodium storage capacity [24-28].
Chen et al. [29] prepared N-doped HC microspheres originating from resorcin and formaldehyde and expanded the HC layer spacing by 18% through controlling the carbonization temperature, thus bringing a higher initial Coulombic efficiency (ICE) of 87%. A sulfur-doped HC was synthesized with a carbon source of glucose via a hydrothermal method, which can effectively reduce 75% of charge transfer resistance [30]. By activating and carbonizing basswood in phosphoric acid, the P-doped HC was prepared [31]. The doping phosphorus could contribute to 2.36 times of specific surface area and 1.16 times of porosity in the basswood-derived carbon. However, the interlayer spacing could only express minimal improvement. As a result, the obtained HC could demonstrate a capacity retention rate of only 53.97% at 100 mA/g after 500 cycles. The boron-doped HC spheres were synthesized with glucose and boric acid as precursors. The formation of B-C-O bonds can raise the sodium storage capacity by creating additional Na+ adsorption sites, which can greatly increase the adsorption energy on the carbon surface, and 48.6% increase of adsorption energy between the carbon interlayers [32]. Although heteroatom doping can indeed reinforce the storage capacity of Na+, it also presents certain drawbacks, such as unstable Coulombic efficiency (CE), low-capacity retention and limited cycle life [12,13]. Furthermore, it is still a challenge to choose an appropriate precursor for the modified reaction of HC, exhibiting the extensive capability of the anode in SIBs [33-35].
It is very interesting that K2SO4 can react with carbon to form K2S, CO, CO2, etc. in an inert atmosphere [36]. Especially, S at its highest oxidation state can be reduced to negatively charged sulfurs by carbon intermediate, then that in reduced form is also present in the layered carbon structures [37,38]. However, it has not been focused on the efficient strategy of sulfur doping and variation of specific surface area (SSA) in metal-ion batteries. Recently, it is reported that HC anodes of potassium-ion batteries are moderated with K2SO4 [39]. The upward trend of SSA was investigated, but the interlayer spacing was not dilated during the activation process of K2SO4. In this work depicting materials and methods (Texts S1-S4 in Supporting information), a natural net-linkage polymer of phenolic compounds, namely economic tannin, is used as the carbon resource. K2SO4 is selected as a catalyst of porous carbon and a heteroatom dopant as well. The tannin-derived HC (TAs) shows a hierarchical textural pore structure, high specific surface area, and expanded interlayer spacing. When applied as an anode in SIBs, the TAs delivers the excellent cycling of 332.6 mAh/g at a current density of 100 mA/g in 500 cycles and rate capabilities of 236.7 mAh/g at a current density of 3 A/g. Especially, the mechanism between SEI stability and capacitance in TAs are elaborated by inspecting fluoro- and sodium-inorganics. This investigation reports a multifunctional chemical of K2SO4 for TAs as both the catalyst and sulfur dopant, which promotes a potential application of low-value tannin in Na+ storage.
In Figs. 1a-f of SEM, TAs are expressed by some irregular-size, different-shape and multilevel-pore particles with rough surface, especially no visible pores in the sample of TAHC (tannin: K2SO4 = 16:0). It is an unknown phenomenon that there is a great difference between TAHC here and other unmodified biomass HCs. With the increase of K2SO4 content, the surface of TAS-HC (tannin: K2SO4 = 16:5) appears progressively smoother, furthermore, presenting the emergence of some pore structures (Figs. 1b and e). It is much more interesting that there are plenty of pores and multilevel pore structure in TAHS-HC (tannin: K2SO4 = 16:10) of highly doping sulfur (Figs. 1c and f). It could be said that the hierarchical pore structure is beneficial for improving the electrochemical performance of TAHC, because of more ion transport channels, higher SSA, and additional active adsorption sites of Na+ [40]. In Fig. 1g, the sorption isotherms of TAHS-HC are solely assigned to the type Ⅰ isotherms [41], indicating the existence of micropores in this sample. The obvious hysteresis loops appear in both TAS-HC and TAHS-HC, showing the formation of mesopores in them. Especially, TAHS-HC presents much higher adsorption capacities due to the increase of SSA after the activation of abundant K2SO4 (Table S1 in Supporting information). According to the nitrogen sorption data, it can be indicated that total pore volume (< 170–200 nm) of TAs is all boosted by the addition of K2SO4, i.e., 0.002 cm3/g for TA, 0.141 cm3/g for TAS-HC, and 0.300 cm3/g for TAHS-HC. The highest SSA of TAs can reach 891.8 m2/g at the tannin to K2SO4 mass ratio of 1.6, For comparison, the TAHC without K2SO4 treatment shows nearly no nitrogen sorption. It is very interesting that TAHS-HC is a candidate material of SIB anode compared to some HC precursors and S-doping strategies for tuning SSA, e.g., thiophene as the carbon and sulfur source to prepare sulfur-doped carbon with SSA from 1.721 m2/g to 29.08 m2/g [42], commercial HC and sulfur powder to prepare sulfur-doped carbon with SSA from 128.8 m2/g to 335.7 m2/g [43]. The SEM image of TAHS-HC distinctly shows numerous interconnected hierarchically porous structures (Fig. 1f). Moreover, the volume ratio of micropores is investigated to be 45% of the total pore volume. Hence, TAs modified by a sulfur doping can facilitate HC to obtain additional platform capacity at low current density. Furthermore, the hierarchical pores in TAs could greatly possess rich specific surface area, which could improve the surface adsorption capacity of HC. Because of the hierarchically porous structures of the TAHS-HC, the Na+ diffusion can modify the contact between the electrode and electrolyte during the Na+ insertion/extraction, leading to the intensification of the electrochemical performance in SIBs [44]. The energy dispersive spectroscopy (EDS) results of TAHS-HC in Fig. S1 (Supporting information) demonstrate that sulfur is uniformly doped into HC. The XPS spectrum of the TAs (Fig. S2a in Supporting information) also confirms that sulfur is successfully doped. The C 1s spectrum of TAHC is deconvoluted into three peaks (Figs. S2b and c in Supporting information), which are assigned to C = C (sp2) and C—C (sp3) (284.7 eV), C—O (285.6 eV), and O—C = O (287.8 eV), respectively [22]. The C = C (sp2) peak is attributed to the chemical defects, while the C—C (sp3) peak is attributed to the graphitic nature [45-47]. The high-resolution C 1s spectra of TAS-HC and TAHS-HC show a shift relative to that of TAHC at the C—O single bond near 285.6 eV (Figs. S2d and g in Supporting information). This shift can be attributed to the presence of the C-S bond near 286.4 eV. Additionally, the S 2p spectra of TAS-HC and TAHS-HC (Figs. S2f and i in Supporting information) can be deconvoluted into three peaks at 163.7, 164.9, and 168.3 eV, which are assigned to S 2p3/2, S 2p1/2, and S-O respectively. These peaks correspond to the -C-Sx-C- bonds (where x = 1–2) for the S 2p3/2 and S 2p1/2 signals, and the -C-SOx-C- bonds (where x = 2–4) for the S-O signal. Hence, this XPS information can confirm that sulfur is successfully doped into the HC of TAS-HC and TAHS-HC.
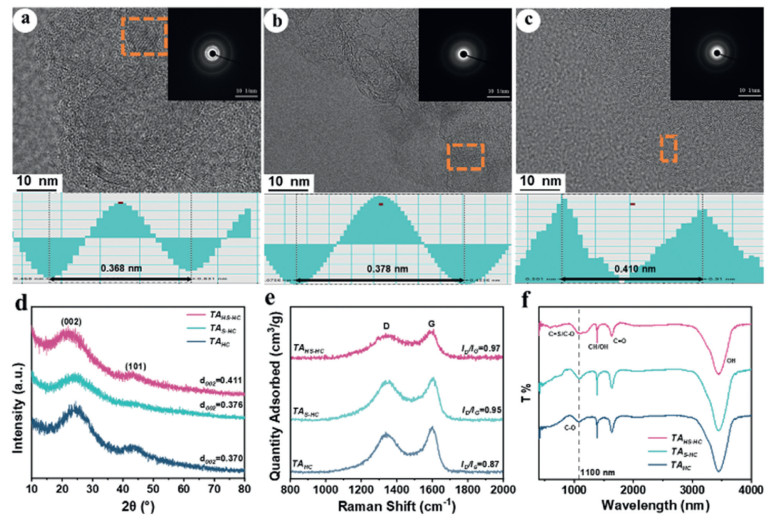
In Figs. 2a-c, TAs express the distinct characteristics, attributed to the crystallized HCs. As the sulfur content increases, the diffraction ring gradually weakens, indicating a reducing domain of the graphite structure. This reduction is advantageous for buffering a volume expansion during the sodiation [47]. Layer spacing analysis is conducted in the graphite region by TEM (Figs. 2a-c). The interlayer spacings for TAHC, TAS-HC, and TAHS-HC are detected to be 0.368, 0.378, and 0.410 nm, respectively. As shown in Fig. 2d, the XRD patterns of TAs depict two broad peaks attributed to (002) and (100), typically confirming the crystalline region of HC. The 2θ value of the (002) plane shifts to a lower angle with the increase of sulfur doping content. Hence, it could be attributed to an increasement of layer spacing in TAs. Namely, the interlayer spacings of TAHC, TAS-HC, and TAHS-HC are calculated to be 0.370 nm, 0.376 nm, and 0.411 nm by applying Bragg's equation, respectively. Compared to TAHC, an increasement of interlayer spacing in TAS-HC and TAHS-HC can happen by 1.6% and 11.1% respectively. It is very significant to improve the Na+ storage performance because the larger interlayer spacing can provide more active sites. Otherwise, Na+ blockage can be effectively prevented during charging and discharging. Consequently, it can accelerate the diffusion and reaction rate of Na+. Therefore, the coefficient for Na+ diffusion will be investigated in the following experiments. In addition to the interlayer spacing, the microcrystalline sizes, including lateral size (La) and vertical size (Lc), are also determined by the fitted XRD patterns (Table S1). With the stepwise increase in sulfur doping content, both the La and Lc gradually increase. Thus, it could also reflect the gradual increase of defects. The Raman spectra of the TAs all show a D-band (defective graphitic band) peak at about 1340 cm−1 and G-band (crystalline graphite band) peak at 1600 cm−1. ID/IG represents an indicator of the degree of graphitic disorder in the carbon structure [48], which is 0.87 for TAHC, 0.95 for TAS-HC, and 0.97 for TAHS-HC respectively (Fig. 2e), inferring the increasing disorder of TAs with higher sulfur doping content. It is attributed to the larger atomic radius of sulfur atoms than that of carbon atoms. It is said that the length of the C-S bond (0.178 nm) formed after doping is greater than that of the C—C bond (0.154 nm) [49]. In the C-S-C structure, sulfur is regarded as the sp3 hybridization, causing torsion and distortion of the carbon plane [49]. The involved sulfur can hinder the formation of graphite domains and increase the disorder in HC as well. The influence of functional groups on electrochemical performance of TAs has been further characterized by FTIR. In Fig. 2f, compared to TAHC, both TAS-HC and TAHS-HC give an intensive peak near 1100 cm−1, which is attributed to the stretching vibration of C = S and C—O-C bonds. A distinctive sharp peak exists at 1700 cm−1, due to the stretching vibration of C = O. The C = S bonds could form the stable active sites, which can optimize layer spacing, and shorten the ion diffusion distance. The oxygen is a characteristic element inherent in disordered carbon, which not only controls the structure but also participates in the redox reaction or chemisorption of Na+ and contributes to the storage capacity of Na+ [45]. Especially, the C = O functional group has been demonstrated as a highly efficient reversible sodium storage active site (C = O + Na+ + e− → C−O−Na). Therefore, it can boost the electrochemical reactions and dynamics [50].
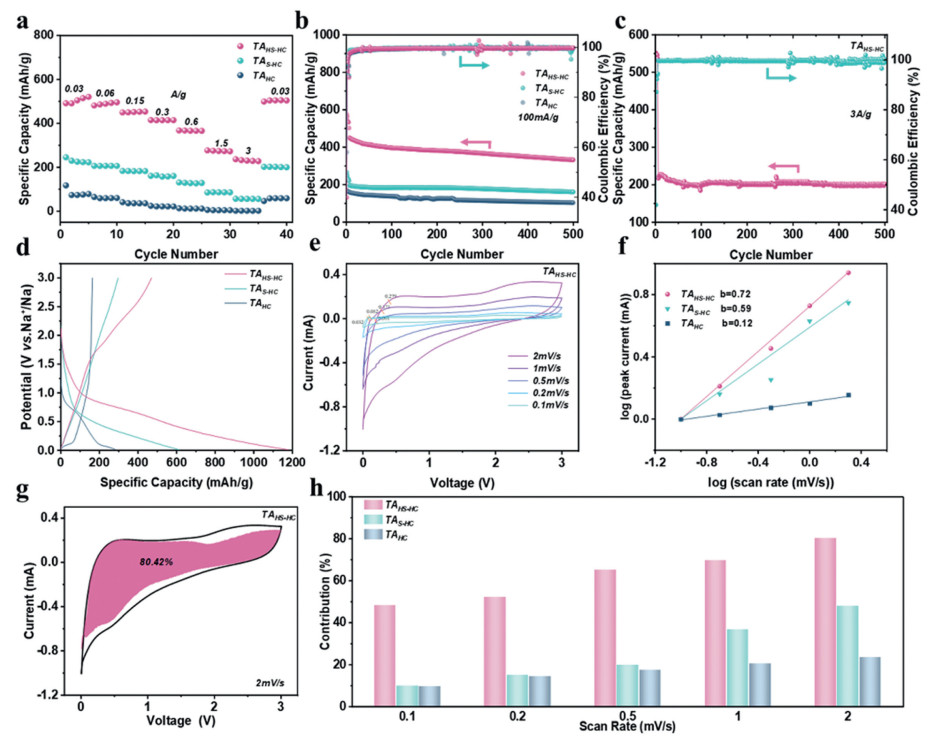
With sodium serving as both the counter and the reference electrode of a CR2016 coin cell, the sodium storage behavior of TAs was depicted in Fig. 3. The rate performance of TAs anodes is investigated at various current densities from 30 mA/g to 3 A/g (Fig. 3a). The TAHS-HC anode is demonstrated with a reversible capacity of 520.5 mAh/g at 30 mA/g, which can retain a high reversible capacity of 236.7 mAh/g at 3 A/g. The excellent rate capability can be attributed to the high SSA [51], which provides more surfactant adsorption spaces. Especially, it is striking that a higher SSA is more conducive to the adsorption and desorption of Na+ under the current density. More distinctly, when the current density is set back to 30 mA/g after a charge-discharge plot, TAHS-HC can nearly recover the initial capacity of 504.2 mAh/g (Fig. 3b). Exhilaratingly, after 500 cycles at a current density of 100 mA/g, TAHS-HC can retain a reversible specific capacity of 332.6 mAh/g. In Fig. 3c, even at a higher current density of 3 A/g, TAHS-HC delivers a reversible capacity of 200 mAh/g after 500 cycles, underscoring its outstanding cycling stability. The coulomb efficiency of > 100% could be attributed to the failed-desorption ions in the previous cycle of charge and discharge process, which are desorbed in the immediately following cycle. Fig. 3d presents that the first cycle data for three types of TAs, which has the highest reversible capacity of 520.5 mAh/g. The ICE of TAHC, TAS-HC, and TAHS-HC are 57.81%, 48.43%, and 39.89%, respectively (Fig. 3d and Figs. S3a-c in Supporting information). The ICE decreases as the sulfur doping content increases, which can be attributed to the modification of the primary sodium storage behavior in HC by sulfur doping. The capacitive effect (b-value) and pseudocapacitance contribution are further investigated by cyclic voltammetry (CV) test (Fig. 3e). It indicates a diffusion-controlled behavior at b < 0.5, and a pseudocapacitive behavior at b > 0.5 [9,38]. In Fig. 3f, as the sulfur doping content increases, the b-values are 0.12 for TAHC, 0.59 for TAS-HC and 0.72 for TAHS-HC, respectively. It can be deduced to different shifts of sodium storage mechanism among TAHC, TAS-HC, and TAHS-HC. Namely, the diffusion-controlled behavior in TAHC is dominant, but the pseudocapacitive behavior in TAS-HC and TAHS-HC is primary. Although this change enhances the overall capacity, it also results in a higher initial irreversible capacity. Compared to TAS-HC and TAHS-HC, TAHC exhibits a pronounced voltage plateau at approximately 0.1 V, which is attributed to the intercalation and hole-filling processes [41,52,53]. After sulfur doping, the area of the plateau decreases (Fig 3d), which could be inferred that the ratio of surface adsorption capacity simultaneously increases [54,55]. Figs. 3g and h and Figs. S4-S7 (Supporting information) show that the proportion of pseudocapacitive behavior also increases as the CV scan rate of TAs increases. It is speculated that Na+ intercalation and deintercalation under high current conditions can effectively proceed on account of Na+ surface adsorption in TAHS-HC, which also explains the excellent rate performance of TAHS-HC [25,55,56].
Some interesting Galvanostatic intermittent titration technique (GITTs) are shown in Figs. 4a and b and Fig. S8 (Supporting information). During the charging process, the Na+ diffusion coefficient jumps at the minimum when the voltage reaches 0.1 V. This change is attributed to a shift in the sodium storage behavior of TAs, from intercalation filling to surface adsorption. When the charging process continues, the diffusion coefficient increases to 0.25 V. After 0.25 V of charging process, the diffusion coefficient gradually decreases. At the initial stage of the discharge process (Fig. 4b), Na+ desorbs from TAs. Next, when the discharge progresses and the voltage reaches approximately 0.6 V, the surface adsorption of Na+ decreases, leading to a reduction of the diffusion rate. When the voltage reaches 0.1 V, the desorption process is completed. Na+ inserted between the interlayers and within the pores begins to escape, causing the increase of diffusion rate. All TAs exhibit similar diffusion trends. However, TAS-HC and TAHS-HC show a higher diffusion coefficient at the same voltage. This enhanced diffusion can be attributed to the reversible redox reaction between Na and S [51], as well as the hierarchical pores, which provide more ion transport channels and facilitate a higher ion transport rate [42]. Fig. 4c presents the electrochemical impedance spectroscopy (EIS) results for the three HC samples. In the high-to-medium frequency region, TAHS-HC exhibits the smallest arc diameter, indicating that it has the lowest charge transfer resistance, which facilitates the transfer of Na+ across its interface. In the low-frequency region, the steepest slope of TAHS-HC infers that Na+ transport at the electrode/electrolyte interface primarily exhibits pseudocapacitive behavior. Therefore, it could be confirmed that TAHS-HC owns the highest pseudocapacitive capacity. The oblique line in the low-frequency region of the Nyquist plot represents the Warburg impedance, which could reflect the Na+ diffusion resistance between the electrode interfaces, and state the diffusion impedance of Na+ within the bulk electrolyte when they move toward the electrode surface.
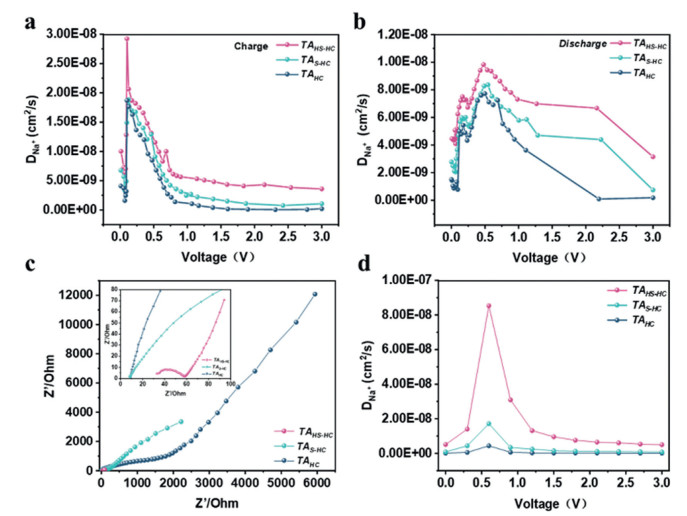
In Fig. 4d, the peak of the ion diffusion rate is located at near 0.6 V. Based on the ion diffusion coefficients calculated by both GITT and EIS, it is inferred that the voltage window for the Na-S redox reaction lies between 0.5 V and 0.7 V, where the ion diffusion rate reaches its maximum. Increased sulfur doping enhances the diffusion rate in HC, although TAs present a similar trend involving the ion diffusion rates. This similarity is deduced that a voltage of 0.1 V serves as the threshold, which could separate the adsorption and intercalation behaviors during the processes of charge and discharge. As the sodium storage capacity between carbon layers approaches its limiting value, a transition in adsorption behavior may occur to result in a peak of ion diffusion rate. Additionally, the excess amount of sulfur doping can modify the ion diffusion due to the expanded pore structure, which could afford an additional ion transport channel to accelerate the Na+ diffusion.
Based on the aforesaid experimental results and analysis, a sulfur doping model has been developed, where the interlayer spacing in the initial interlayer spacing of carbon was 3.68 Å (Fig. S9a in Supporting information). As shown in Figs. S9b-d (Supporting information), the interlayer spacing of sulfur doped at the position of S1, S2, and S3 is assumed according to the defect structure of HC. S-doped positions and the influence of interlayer distance were explored by the first-principles calculation. Compared to an interlayer spacing in the perfect carbon, the three different S-doping positions of S1, S2, and S3 were expanded by 0.35, 0.39, and 0.11 Å, respectively, especially shorter interlayer spacing at S3 site of HC layers. Hence, it can be progressively proved to implant sulfur into TAs, further to dilate the interlayer spacing of the initial carbon. Like this, it was also well proved that the vacancy defects of HC layers can be firstly doped by sulfur atoms, then some excessive sulfur doping could successively occur among the interlayers of HC. Therefore, it was consistent with the experimental results of TEM and XRD. It was well known that the interlayer spacing is very significant to Na+ diffusion [57].
To theoretically evaluate the effect of sulfur doping on Na+ adsorption and diffusion, the adsorption energy and energy barrier of Na+ diffusion in TAs with different sulfur doping positions are calculated by DFT. As shown in Fig. S10 (Supporting information), the adsorption energy of Na+ on the initial carbon layer is −0.41 eV, while the adsorption energies for sulfur-doped carbon at the S1 position and at the S3 position of HC layer defect are −2.52 eV and −2.87 eV, respectively. These results can demonstrate that higher adsorption energy of Na+ is firstly broken and filled up in defects of the HC layer.
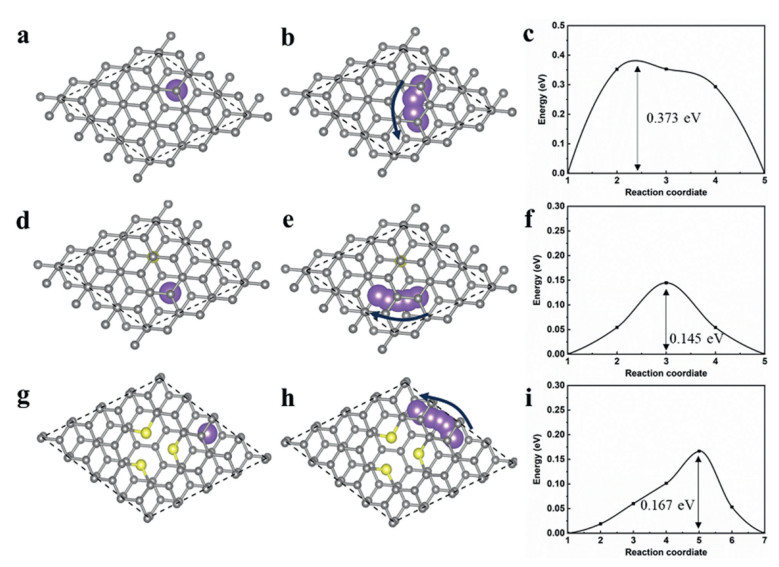
In order to explore the differences in the diffusion paths of Na+ in the three structures, the diffusion energy barriers of Na+ in different TAs structures are further calculated. As shown in Figs. 5a-i, when Na+ migrates along the horizontal direction of the (002) crystal plane between the original carbon layers, the diffusion energy barrier that must be overcome is 0.373 eV (Fig. 5c). However, when Na+ is doped with sulfur at the S1 and S3 sites (Figs. S10b and c), the diffusion energy barriers along the same direction of the (002) crystal plane in the carbon layer are reduced to 0.145 eV and 0.167 eV (Figs. 5f and i), respectively. These results demonstrate that sulfur doping significantly reduces the diffusion energy barrier for Na+ migration between carbon layers, and accelerates the diffusion rate of Na+.
To substantiate HC's feasibility in some practical applications, the full cell was assembled from Na3V2(PO4)3 (NVP) (Fig. S11 in Supporting information) cathode and TAHS-HC anode. The rhombohedral Na3V2(PO4)3, a typical sodium superionic conductor (NASICON), was selected as the cathode due to its high Na+ mobility and robust structure. The initial charge-discharge profile at a current density of 0.1 A/g indicated (Fig. S12a in Supporting information) a capacity up to 185.04 mAh/g. During the long-term cycling, the durability and operational lifespan of the NVP|TAHS-HC full cell were further scrutinized under a current density of 100 mA/g (Fig. S12b in Supporting information). The capacity retention of the NVP|TAHS-HC full battery after > 100 cycles was described by the remarkable durability and the excellent stability, with a capacity retention rate of 96.9% after 100 cycles.
To elaborate the process of Na+ intercalation and deintercalation in the carbon layers of TAs electrodes, XRD and Raman spectroscopy tests were performed on the TAHS-HC of the batteries during discharge-charge process of various voltages. As shown in Fig. 6a, performing the charge process, the (002) diffraction peak of TAHS-HC shifts significantly to the small-angle direction of the XRD patterns in the range of 24°−26°. However, it shifts significantly to the large-angle direction during the discharge process. Then, it could be inferred that during the charge Na+ intercalation among the carbon layers of TAHS-HC results in an expansion of the interlayer spacing in the carbon structure. While for the discharge, it seems that Na+ escaped from the carbon layers of TAHS-HC gives rise to the release of interaction space between the carbon layers. It suggests that Na+ is reversibly intercalated into the voids among the TAHS-HC layers during charge and discharge cycles. Fig. 6b shows that the ID/IG ratio of the sloped region (> 0.1 V) significantly decreases, corresponding to the adsorption of Na+ on defects in TAHS-HC. In contrast, the ID/IG of the plateau region (< 0.1 V) remains relatively stable, where the defect structure of TAHS-HC could almost not involve Na+ filling in the pores/Na+ intercalation. Additionally, the slight leftward shift of the G peak suggests that changes in the pore structure have minimal impact on Na+ intercalation behavior. It can infer that both pore filling and intercalation reactions coexist. Overall, this implies that both Na+ intercalation and Na+ deintercalation occur in the interlayer spaces and the amorphous regions surrounding graphite domain defects during charge and discharge.

During repeated cycling, the dissolution of the SEI causes continuous SEI breakdown, followed by reformation and electrolyte decomposition. This process may lead to electrolyte depletion, low CE, irreversible capacity loss, and a shortened cycle life [19]. To further explore the relationship between the Na+ storage characteristics of TAs and the SEI surrounding the TAs negative electrode, the chemical composition and structure of SEI layers formed TAs after 100 cycles were analyzed. Figs. S13 and S14 (Supporting information) present the specific chemical compositions of SEI layers formed on the TAs electrodes after cycling. Unlike TAHC, TAS-HC and TAHS-HC display C-F peaks at approximately 688.0 and 688.7 eV, respectively, which are indicative of fluorinated organic compounds in SEI. These compounds are detected at various etching depths, indicating their widespread distribution throughout SEI. The presence of these stable fluorinated organic compounds reduces dissolution of SEI component, thereby enhancing the electrochemical stability of the TAs anode and preserving SEI integrity. The absence of a C-F peak in XPS spectrum of TAHC (Fig. S14) suggests that sulfur doping promotes the formation of fluorinated organic species within the ester-based electrolyte. Additionally, NaSO3 has been clarified to have a reaction due to sulfur, Na+ and carbonate solvents in the electrolyte [58]. It is the inorganic of Na2SO3 that is benefit to improve the stability of the SEI film, which could slow down the decomposition of the electrolyte. The curves of O 1s and F 1s of TAs can deduce that the concentrations of inorganic components, such as NaF and C = O, increase with the etching depth, especially focusing on the peak of 6 nm. At the depth of 6 nm, NaF and C = O comprise 73.4% and 50.28% in the total F and O elemental contents, respectively. Hence, it could conclude that the dominance of inorganic species is primary in the inner SEI layer. This inorganic composition contributes to the formation of a stable layered SEI structure, which is essential for the enhanced stability observed in TAHS-HC. Furthermore, the permeable nature of the inorganics intensifies Na+ conductivity compared to organics, significantly improving the rate performance of the TAHS-HC negative electrode.
In summary, the sulfur content of TAS-HC and TAHS-HC was 3.04 at% and 7.62 at%, respectively, by one-step carbonization method based on different ratios of K2SO4 to tannic acid. K2SO4 as a sulfur source can greatly increase the specific surface area, from 0.4 m2/g to 891.8 m2/g, and further modify the surface adsorption capacity of HC during the charge and discharge process. The high reversible specific capacity of 382.50 mAh/g was achieved after 500 cycles at the current density of 100 mA/g. The XRD and DFT results show that the interlayer spacing can be dilated to exceed above 0.400 nm by S doping. At the same time, the C = S and defects introduced by sulfur doping can provide stable active sites to improve the sodium storage performance. Additionally, the energy barrier of the Na+ diffusion to migrate along the vertical direction of (002) crystal plane is calculated to be about only 0.145 eV by DFT, which means that Na+ can migrate across the (002) plane through the interlayer defect structure. The XPS investigation of SEI layer after Ar etching can progressively manifest some excess C = O formed on account of S doping to extraordinarily generate a stable SEI layer. This work provides a feasible solution for the HC negative electrode of SIBs, and improves the electrochemical performance by modifying the HC pores, interlayer spacing and functional groups with the addition of K2SO4.
The authors declare that they have no known competing financial interests or personal relationships that could have appeared to influence the work reported in this paper.
Yu Su: Writing – original draft, Methodology, Investigation. Jinbo Hu: Writing – review & editing, Supervision, Funding acquisition. Laiqiang Xu: Software, Methodology. Xinwen Jiang: Formal analysis, Data curation. Gonggang Liu: Writing – review & editing, Methodology, Formal analysis. Yuanjuan Bai: Validation, Methodology. Yuanyuan Liao: Methodology, Investigation. Shanshan Chang: Writing – review & editing, Supervision. Xiaowei Cheng: Writing – review & editing, Writing – original draft, Funding acquisition.
This work was financially supported by National Natural Science Foundation of China (Nos. 32271791, 32171709 and 22475053), Hunan Provincial Natural Science Foundation of China (No. 2024JJ7643) and Natural Science Foundation of Shanghai (No. 22ZR1404100).
Supplementary material associated with this article can be found, in the online version, at doi:
S. Chu, A. Majumdar, Nature 488 (2012) 294–303. doi: 10.1038/nature11475
G. Huang, Q. Kong, W. Yao, et al., ChemSusChem 16 (2023) e202202070. doi: 10.1002/cssc.202202070
I. Jeon, D. Yang, D. Yadav, et al., Electrochim. Acta 439 (2023) 141730. doi: 10.1016/j.electacta.2022.141730
Y. Liu, B.V. Merinov, W.A. Goddard, Proc. Natl. Acad. Sci. U. S. A. 113 (2016) 3735–3739. doi: 10.1073/pnas.1602473113
Y. Xu, Y. Zhu, Y. Liu, et al., Adv. Energy Mater. 3 (2013) 128–133. doi: 10.1002/aenm.201200346
Y. Ge, H. Jiang, J. Zhu, et al., Electrochim. Acta 157 (2015) 142–148. doi: 10.1016/j.electacta.2015.01.086
H. Ha, S. Nam, S.H. Jeong, et al., J Mech. Sci. Technol. 33 (2019) 3865–3870. doi: 10.1007/s12206-019-0730-2
D. Saurel, B. Orayech, B. Xiao, et al., Adv. Energy Mater. 8 (2018) 201703268.
Q. Hu, L.Q. Xu, G.G. Liu, et al., ACS Nano 1 (2024) 21491–21503. doi: 10.1021/acsnano.4c06281
Y. Qi, Y. Lu, F. Ding, et al., Angew. Chem. Int. Ed. 58 (2019) 4361–4365. doi: 10.1002/anie.201900005
B. Cao, H. Liu, B. Xu, et al., J. Mater. Chem. A 4 (2016) 6472–6478. doi: 10.1039/C6TA00950F
B. Feng, L.Q. Xu, Z.Y. Yu, et al., Electrochem. Commun. 148 (2023) 107439. doi: 10.1016/j.elecom.2023.107439
L.Q. Xu, B. Feng, Y. Su, et al., Rare Met. 43 (2024) 6362–6372. doi: 10.1007/s12598-024-02763-0
M. Sun, Y. Qu, F. Zeng, et al., Ind. Eng. Chem. Res. 61 (2022) 2126–2135. doi: 10.1021/acs.iecr.1c04575
C.C. Cai, Y.C. Chen, P. Hu, et al., Small 18 (2022) 2105303. doi: 10.1002/smll.202105303
L.F. Zhao, Z. Hu, W.H. Lai, et al., Adv. Energy Mater. 11 (2021) 2002704. doi: 10.1002/aenm.202002704
D. Alvira, D. Antoran, J.J. Manya, Chem. Eng. J. 447 (2022) 137468. doi: 10.1016/j.cej.2022.137468
M.S. Islam, C.A.J. Fisher, Chem. Soc. Rev. 43 (2014) 185–204. doi: 10.1039/C3CS60199D
Y. Jin, P.M.L. Le, P. Gao, et al., Nat. Energy 7 (2022) 718–725. doi: 10.1038/s41560-022-01055-0
H. Fang, S. Gao, M. Ren, et al., Angew. Chem. Int. Ed. 62 (2023) e202214717. doi: 10.1002/anie.202214717
M. Ma, H. Cai, C. Xu, et al., Adv. Funct. Mater. 31 (2021) 2100278. doi: 10.1002/adfm.202100278
L. Liu, L. Xiao, Z. Sun, et al., J. Energy Chem. 94 (2024) 414–429. doi: 10.1016/j.jechem.2024.02.055
C. Bommier, X. Ji, Small 14 (2018) 1703576. doi: 10.1002/smll.201703576
Q. Jin, W. Li, K. Wang, et al., J. Mater. Chem. A 7 (2019) 10239–10245. doi: 10.1039/c9ta02107h
Y. Zhao, Z. Hu, C. Fan, et al., Chem. Eng. J. 446 (2022) 137427. doi: 10.1016/j.cej.2022.137427
R. Muruganantham, F.M. Wang, W.R. Liu, Electrochim. Acta 424 (2022) 140573. doi: 10.1016/j.electacta.2022.140573
X. Wang, M. Hou, Z. Shi, et al., ACS Appl. Mater. Interfaces 13 (2021) 12059–12068. doi: 10.1021/acsami.0c23165
W. Shen, H. Li, C. Wang, et al., J. Mater. Chem. A 3 (2015) 15190–15201. doi: 10.1039/C5TA03519H
R. Chen, X.Y. Li, C.C. Cai, et al., Small 19 (2023) 2303790. doi: 10.1002/smll.202303790
X. Yuan, S. Chen, J. Li, et al., Carbon Energy 3 (2021) 615–626. doi: 10.1002/cey2.98
Z. Xu, Y. Huang, L. Ding, et al., Energy Fuels 34 (2020) 11565–11573. doi: 10.1021/acs.energyfuels.0c02286
D. Wu, F. Sun, Z. Qu, et al., J. Mater. Chem. A 10 (2022) 17225–17236. doi: 10.1039/d2ta04194d
Z. Wang, B. Liu, J. Xie, et al., J. Alloys Compd. 911 (2022) 164979. doi: 10.1016/j.jallcom.2022.164979
B. Wan, H. Zhang, S. Tang, et al., Energy Fuels 6 (2022) 4338–4345. doi: 10.1039/d2se00937d
C. Wang, N. Zhao, B. Li, et al., J. Mater. Chem. A 9 (2021) 20483–20492. doi: 10.1039/d1ta05755c
S.H. Deng, X.B. Wang, J.Y. Zhang, et al., J. Environ. Manage. 218 (2018) 50–58. doi: 10.1016/j.jenvman.2018.04.057
P. Hong, X. Liu, X. Zhang, et al., Int. J. Energy Res. 44 (2020) 5385–5396. doi: 10.1002/er.5288
X. Liu, M. Antonietti, Adv. Mater. 25 (2013) 6284–6290. doi: 10.1002/adma.201302034
Y. Zhang, L. Li, Y. Xiang, et al., Mater. Interfaces 12 (2020) 30431–30437. doi: 10.1021/acsami.0c07616
W. Nie, H. Cheng, X. Liu, et al., J. Power Sources 522 (2022) 230994. doi: 10.1016/j.jpowsour.2022.230994
G. Zhao, D. Yu, H. Zhang, et al., Nano Energy 67 (2020) 104219. doi: 10.1016/j.nanoen.2019.104219
R. Mishra, S. Panigrahy, S. Barman, Energy Fuels 36 (2022) 12310–12318. doi: 10.1021/acs.energyfuels.2c02383
S. Manna, S. Puravankara, Next Mater. 7 (2025) 100353. doi: 10.1016/j.nxmate.2024.100353
R. Wang, Y. Li, Y. Wang, et al., Appl. Energy 261 (2020) 114369. doi: 10.1016/j.apenergy.2019.114369
H.D. Asfaw, C.W. Tai, M. Valvo, et al., Mater. Today Energy 18 (2020) 100505. doi: 10.1016/j.mtener.2020.100505
H. Lei, J. Li, X. Zhang, et al., Infomat 4 (2022) e12272. doi: 10.1002/inf2.12272
W. Deng, Y. Cao, G. Yuan, et al., ACS Appl. Mater. Interfaces 13 (2021) 47728–477239. doi: 10.1021/acsami.1c15884
J. Yang, Z. Ju, Y. Jiang, et al., Adv. Mater. 30 (2018) 1700104. doi: 10.1002/adma.201700104
Y. Li, M. Chen, B. Liu, et al., Adv. Energy Mater. 10 (2020) 20000927.
P. Bai, Y. He, X. Zou, et al., Adv. Energy Mater. 8 (2018) 1703217. doi: 10.1002/aenm.201703217
Z.Y. Hong, Y.C. Zhen, Y.R. Ruan, et al., Adv. Mater. 30 (2018) 1802035. doi: 10.1002/adma.201802035
H. Tonnoir, D. Huo, R.L.S. Canevesi, et al., Mater. Today Chem. 23 (2022) 100614. doi: 10.1016/j.mtchem.2021.100614
A. Beda, A.M. Escamilla-Pérez, L. Simonin, et al., ACS Appl. Energy Mater. 5 (2022) 4774–4787. doi: 10.1021/acsaem.2c00215
H. Kim, J. Hong, G. Yoon, et al., Energy Environ. Sci. 8 (2015) 2963–2969. doi: 10.1039/C5EE02051D
G. Luo, F. Shen, C. Bommier, et al., Acc. Chem. Res. 49 (2016) 231–240. doi: 10.1021/acs.accounts.5b00482
R. Wei, M. Huang, W. Ma, et al., J. Energy Chem. 49 (2020) 136–146. doi: 10.1016/j.jechem.2020.01.010
Y. Zeng, F. Wang, Y. Cheng, et al., Energy Storage Mater. 73 (2024) 103808. doi: 10.1016/j.ensm.2024.103808
X.Q. Chang, Y.F. Ma, M. Yang, et al., Energy Storage Mater. 23 (2019) 358–366. doi: 10.1016/j.ensm.2019.04.039

Figure 1 Morphological and structural characterization of TAs. SEM of (a, d) TAHC, (b, e) TAS-HC, and (c, f) TAHS-HC, nitrogen adsorption and (g) desorption isotherms, (h) pore size distribution curves of TAs.

Figure 2 Structural analysis of TAs. HRTEM and the corresponding SAED and FFT modes are displayed at the bottom of (a) TAHC, (b) TAS-HC and (c) TAHS-HC, (d) XRD patterns, (e) Raman spectra, (f) FTIR spectra of TAs.

Figure 3 The comparison of electrochemical performance among TAs. (a) Rate performance. (b) Cycle performance at 100 mA/g current density. (c) Cycle performance of TAHS-HC at 3 A/g current density. (d) First cycle diagram. (e) CV curves at different scan rates of TAHS-HC. (f) b value calculated based on the relationship between CV peak current and scan rate. (g) Pseudocapacitive ratio of TAHS-HC at 2 mV/s scan rate. (h) Pseudocapacitive ratio bar graph at different scan rates.

Figure 4 Electrochemical analysis of TAs: (a) Ion diffusion coefficient during discharging calculated based on GITT. (b) Ion diffusion coefficient during charging process. (c) EIS. (d) Ion diffusion coefficient calculated based on EIS.

Figure 5 Migration path and migration barrier of Na+ in TAs. Na+ initial position, migration path, migration barrier in (a-c) initial carbon layers, (d-f) S1 site carbon layers, (g-i) S3 site carbon layers, yellow cycle as S, purple ball as Na+, arrow as mobile direction of Na+.

 扫一扫看文章

扫一扫关注我们
 DownLoad:
 下载:
下载:
