
Figure 1.
Preparation process of hydrangea-like B/N co-doped carbon.
Hydrangea-like B/N co-doped carbon-based electrochemical sensors for the efficient and sensitive detection of aristolochic acid in Aristolochia
Menglin Zhou , Lin Zhang , Xuefei Shan , Fengqin Chang , Wentong Chen , Xuguang An , Guangzhi Hu

Aristolochic acid (AA) is a nitrophenanthrenecarboxylic acid that occurs naturally in Aristolochia sinensis [1]. Aristolochia is frequently used as an herbal remedy for a number of conditions, such as gout and arthritis, and it is also used for obstetrics and the treatment of snakebites [2]. AA is highly nephrotoxic and carcinogenic. When aristolochic acid is ingested, it transforms into substances in the renal tubules in the kidneys and liver, which leads to cellular DNA damage. This ultimately leads to carcinoma or renal fibrosis [3]. The Carcinogenicity Potency Database (CPDB) of the National Institutes of Health showed that the dose (TD50) causing cancer in the tested animals was 0.0141 mg kg-1 d-1 in a single toxicity test with long-term continuous exposure to AA [4]. Therefore, many countries worldwide ban both the use of most AA-containing herbs as medicines and their production [5]. However, as AA poisoning continues to occur in Asia and Europe, owing to the common belief that natural herbs are less toxic than Western medicines [6], and as these countries still use Aristolochia sinensis as an herbal medicine in clinical practice, it is essential to develop a method for the rapid and accurate detection of AA in plants.
Currently, the most commonly used international methods for the detection of Chinese herbal medicines are high-performance liquid chromatography (HPLC) [7], liquid chromatography–mass spectrometry (LC–MS) [8], Raman spectroscopy [9], molecularly imprinted technique [10], fluorescence sensing test [11], and high-performance thin-layer chromatography (HPTLC) [12], all of which are highly accurate and sensitive for detection. However, all of these methods suffer from the problems of expensive testing, long testing times, large instrumentation, and high operational requirements. Compared with these methods, electrochemical sensors can effectively solve the shortcomings of the above equipment and can accurately, quickly, and sensitively detect the substances to be tested [13]. Commonly used methods that employ electrochemical sensors include differential pulse voltammetry (DPV) [14], square wave voltammetry (SWV) [15] and linear sweep voltammetry (LSV) [16]. However, few electrochemical methods have been reported for the analysis of AA. Therefore, it is crucial to construct a novel electrochemical workstation for the analysis of AA.
The crucial factor affecting the strength of the current signal depends on the functional materials modified on the electrode surface [17]. By modifying the functional materials, the number of active sites on the surface of the electrode can be increased, and the surface area can be enlarged, thus improving the electrochemical properties and enhancing the current response [18]. Currently, the materials commonly used to modify electrodes are carbon, metal frameworks, and metal oxides [19]. Among these, carbon nanomaterials have excellent development prospects in the field of electrochemical sensing, owing to their low background currents, large specific surface areas, and ease of modification to improve their conductivity [20]. Huang et al. [21] applied B/N co-doped carbon materials (BNC) to construct a sensor with which to detect heavy metal ions that exhibited good electrochemical performance with a high sensitivity and a low detection limit to meet detection standards. Owing to the excellent electrochemical properties of B/N co-doped materials, in this study, hydrangea-like B/N co-doped carbon nanocomposites were synthesised to further reduce the background current, enhance the electrochemical properties, and apply them in AA electrochemical fractionation.
In this study, we report a highly crosslinked polymer with a novel morphology that was carbonised via high-temperature calcination and doped with B/N to synthesize hydrangea-like B/N co-doped carbon nanomaterials. Hydrangea-like B/N co-doped carbon (hydrangea-like BNC) was used to construct an electrochemical sensor for the analysis of AA. The structural morphology of the hydrangea-like BNC was analysed via scanning electron microscopy (SEM), transmission electron microscopy (TEM), X-ray diffraction (XRD), and X-ray photoelectron spectroscopy (XPS). A glassy carbon electrode (GCE) modified with hydrangea-like B/N co-doped carbon materials was used to quantitatively analyse AA by using a three-electrode system. Moreover, its electrochemical behaviour was studied, and it demonstrated excellent detection performance.
Hypercrosslinked polymers were prepared via the Friedel–Crafts reaction with anhydrous FeCl3 as a catalyst, using an externally added crosslinking agent [22]. First, 1,2-dichloroethane (DCE, 20.00 mL) and anhydrous FeCl3 (3.211 g) were added to a beaker and stirred well until fully dissolved. Then, dimethoxymethane (FDA, 5.41 mL) was added, the mouth of the beaker was covered with a sealing film, pyrrole (1.40 mL) was added quickly using a pipette gun, and the product obtained from the reaction was stirred at 25 ℃ for 4 h. The product obtained from the reaction was washed and filtered through ethanol. The product obtained from the reaction was washed with ethanol and filtered. The solid (solid A) obtained after filtration was then placed in a vacuum-drying oven for drying. Then, 3.05 g of boric acid and 3.00 g of urea were placed into a beaker with pure water to be completely dissolved. Then, the beaker was put into the oven at 60 ℃ to dry the water and obtain the B/N mixture as a solid (solid B). Then, 6.00 g solid B and 6.00 g solid A were mixed in a mortar and ground uniformly to obtain a solid mixture (solid C). Solid C was put in nitrogen at a 5 ℃/min heating rate, 900 ℃, for 3 h of carbonisation to obtain the final product hydrangea-like B/N co-doped carbon material (termed hydrangea-like BNC) (Fig. 1) [23].
Here, 0.1 mol/L phosphate-buffered saline (PBS; Na2HPO4, NaH2PO4, and NaCl, pH 7.0) was used as the electrolyte. And a Pt wire, Ag/AgCl electrode (R0303, reference filling solution: 3.5 mol/L KCl), and hydrangea-like BNC-modified GCE or GCE as the counter, reference, and working electrode, respectively. The electrochemical properties of the electrode were probed using cyclic voltammetry (CV), and the controlled processes on the surface of the electrode were probed using LSV. In addition, the impedance of the electrode was analysed using electrochemical impedance spectroscopy (EIS), and both CV and EIS were carried out in a 0.1 mol/L KCl solution containing 5 mmol/L [Fe(CN)6]3-/4-. Electrochemical processes occurring in an environment containing AA were tested using both this method and SWV. The CV was tested at potential conditions of −0.1~0.6 V with a scan rate of 100 mV/s, LSV was tested at scan rates of 10–100 mV/s with potential conditions of -0.3~-0.9 V, and SWV was tested at an amplitude of 25 mV and a frequency of 25 Hz with potential conditions of −0.3~−0.9 V [24]. All the tests, except for the EIS, were performed in 0.1 mol/L PBS using CHI-660E. The EIS tests were performed on a Multi Autolab M204 electrochemical workstation.
SEM and TEM were used to analyse the morphology and structure of the hydrangea-like BNC. Figs. 2a–c show SEM images of the hydrangea-like BNC. The overall morphology of the BNC is hydrangea-like, with rod-like projections. Figs. 2d–f show transmission electron micrographs of the hydrangea-like BNC. The overall morphology of the hydrangea-like BNC is hydrangea-like, that is, composed of multiple rod-like structures that are spliced together to form a hydrangea. Figs. 2g–k show energy-dispersive X-ray spectroscopy (EDS) images that indicate that the four B, N, C, O elements are uniformly distributed throughout the material.

The microstructure was further analysed using XRD and XPS. Fig. 3a shows the XRD results. The characteristic peaks at 26.35°, 41.25°, and 44.62° correspond to the (002), (100), and (101) crystallographic planes of (B/N)0.33C0.67, which is the same as those of the standard card PDF #52-0233 of boron nitrogen carbide.

The chemical composition of the hydrangea-like BNC was obtained via XPS analysis. Fig. 3b demonstrates the total energy spectrum of XPS, which shows the peaks and contents of the four B, N, C, O elements. Fig. 3c shows the deconvolution energy spectra of C 1s at 284.6, 285.5, and 288.6 eV, corresponding to the characteristic peaks of C—B, C—O, and C—N, respectively [25]. Fig. 3d shows the deconvolution energy spectrum of B 1s, which is decomposed into three prominent peaks at 192.1, 191.1, and 190.4 eV, respectively, corresponding to the B—O, B—N, and B—C bonds [26]. Fig. 3e shows the deconvolution energy spectra of N 1s at 397.7, 398.2, and 398.8 eV, showing four peaks corresponding to the characteristic peaks of pyridinic N, C—N—B, pyrrolic N, and graphite N [27,28]. The presence of C—N—B indirectly proves that B and N were successfully doped into the carbon bases and induced defect formation. N doping can increase the defects of the surface sites of the material [29]. Pyridine N refers to the N atoms at the edge of the carbon base, where the edge N atoms are more active than the planar N atoms and therefore more favourable to provide active sites [30,31]. Graphite N atoms are doped into the graphene layer and replace carbon atoms within carbon matrix plane, and graphite N embedded in the sp2-type carbon basal plane is favourable for enhancing the electrical conductivity of the carbon framework [32]. Therefore, pyridine N and graphite N greatly improved the electrochemical performance.
The specific surface area and pore size distribution of the hydrangea-like BNC were analysed via BET modelling. Fig. 3f shows the hydrangea-like BNC adsorption and desorption curves, and there is a bulge in the latter section of the curve that corresponds to the capillary condensation system in porous adsorbents. Moreover, this is the type Ⅵ isotherm in the IUPAC [33], and the adsorption pore sizes range from 1.43 nm to 6.39 nm, indicating that this is a mesoporous material. The hydrangea-like BNC had a specific surface area of 305.639 m2/g, an average pore size of 3.4 nm, and an average pore volume of 0.291 cm3/g.
We compared the electrochemical characterization of hydrangea-like BNC/GCE and GCE. The two electrodes were subjected to EIS and CV tests in a 0.1 mol/L KCl solution containing 5 mmol/L of [Fe(CN)6]3-/4-. Fig. 4a shows the impedance diagram of the EIS. The semicircle represents the process of electron transfer, and the diameter of the semicircle represents the electrode [34]. The impedance of the modified electrode is much smaller than that of the GCE, and after circuit fitting, the first semicircle is the solution resistance and the second semicircle is the electrode resistance. By fitting the equivalent circuit to calculate the electron transfer resistance Rct, the resistance of the GCE is approximately 819 Ω, and the resistance of the hydrangea-like BNC/GCE is approximately 98 Ω. Fig. 4b shows the results of the CV test, which can determine the redox ability of the electrode and the electrode surface area; the larger the peak value, the larger the redox ability and the electrode surface area. According to the Randles–Sevcik equation [35]:
|
|
(1) |
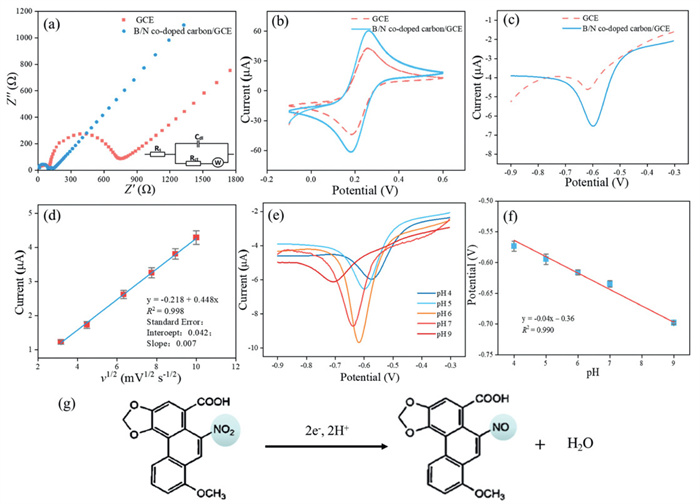
The size of the specific surface area of the electrode in the reversible process can be calculated. The specific surface area of the GCE was calculated to be 0.051 cm2, and that of the hydrangea-like BNC/GCE was calculated to be 0.126 cm2. The increase in the specific surface area was accompanied by a corresponding increase in the number of electrochemically active sites on the surface, which enhanced electrochemical performance. We also compared the electrochemical behaviours of the hydrangea-like BNC/GCE and GCE in AA solution, and the results are shown in Fig. 4c. The electrochemical responses of hydrangea-like BNC/GCE are significantly larger than those of GCE in 0.1 mol/L PBS with 15 µmol/L AA. These results are attributable to the excellent electrochemical performance of the modified electrode, with its faster electron transfer rate and larger effective area. Subsequently, the control process on the electrode surface was investigated. Fig. S2a (Supporting information) and Fig. 4d show that the current is proportional to the square root of the scanning rate in the 10–100 mV/s range, and the main diffusion-controlled process in the 20 µmol/L AA is a process that is dominated by the diffusion rate. The main influencing factors are the concentration of the modification amount and the environmental conditions, such as the pH of the solution, which must subsequently be optimized [36].
For the reaction dominated by diffusion control, the adsorption control was relatively weak. Therefore, the enrichment voltage and enrichment time had little effect on the signal. To achieve the optimal conditions for the experiment and obtain the best electrochemical signal response, we optimized both the concentration of the modification on the surface of the electrode and the pH of the buffer solution. Fig. S2b (Supporting information) shows the magnitude of the electrochemical signal at 0.1 mol/L PBS with 15 µmol/L AA for electrodes with different concentrations of modification. The electrochemical response reaches its maximum at 1.5 mg/mL. As the concentration of the modification amount increases, the thickening of the coating may lead to the coverage of parts of the active sites on the surfaces of the electrodes. Simultaneously, this may increase the difficulty of electron transfer and thereby lead to a decrease in the current response. Therefore, in this study, we chose 1.5 mg/mL as the optimal modification concentration.
The pH of the buffer solution affects the ease of redox reaction. Hence, to explore the optimal pH for testing AA, we investigated five different pH values. Fig. S2c (Supporting information) shows that the current signal reaches its maximum at a pH of 7, and the current signal decreases rapidly with the further increase of pH. This is because the hydroxyl groups in the solution increase with the increase of pH, and some of the hydroxyl groups occupy the active site, which decreases the styling current signal. Therefore, we selected a pH of 7 as the optimal pH for this study. Fig. 4e shows that the peak potential gradually shifted negatively with the gradual increase in pH, and Fig. 4f demonstrates the linear relationship between the pH and peak potential. Its linear equation is Ea (V) = -0.04pH - 0.36, and the slope is close to the value calculated by the Nernst equation (0.0598 V/pH), indicating that the number of protons participating in the reaction is the same as the number of electrons. At the same time, according to the Laviron equation (Fig. S2d in Supporting information) [37], the electron transfer number (n) is calculated to be 2.33, which approximates the integer 2. Therefore, it can be deduced that the electrochemical reaction paths occurring at the electrode surface AA are in Fig. 4g [38].
To investigate the test performance of the electrochemical workstation, we examined the sensitivity of the experimentally obtained optimal conditions by modifying the concentration of 1.5 mg/mL and pH 7 of the 0.1 mol/L PBS via the SWV method for different concentrations of AA in 0.1 mol/L PBS. Fig. 5a shows that the current signal increased as the concentration of AA increased. However, owing to the solubility problem of AA, the concentration of ethanol as an AA solvent in the electrolytic cell increases with an increase in the AA concentration. This results in the slight fluctuation of the current signal. Fig. 5b shows the linear relationship between the current intensity and AA concentration. With the increase of the AA concentration, the current signal increases and shows a linear relationship, with a linear equation of Ipa (µA) = -0.41 - 0.31C (µmol/L) and an R2 value of 0.998, which indicates a strong correlation.

The limit of detection (LOD) of the hydrangea-like-BNC-based sensor for the detection of AA was calculated using the formula LOD = 3Sb/S, where Sb is the standard deviation of 10 measurements in a blank solution and S is the slope of the standard curve. The calculated LOD was 47.3 nmol/L, which can be used for basic AA detection. Table 1 [38–43] lists the current detection methods and detection lines for aristolochic acid and shows that the electrochemical detection of aristolochic acid is less time-consuming and more time-effective when the sensitivity and detection limits are not significantly different.
 DownLoad:
CSV
DownLoad:
CSV
| Methods | LOD (µmol/L) | Linear range (µmol/L) | Sensitivity (µA L µmol-1 cm-2) | Ref. |
| PG Electrodes | 0.01 | 0.05–1.3 | 2.3 | [39] |
| MoS2/S-Ti3C2/LGE | 0.002 | 0.01–857.01 | 19.6 | [40] |
| OMC/GCE | 0.186 | 0.6–50 | 0.31 | [38] |
| Co/GCE | 0.08 | 0.12–37 | - | [41] |
| MoS2@MWCNTs/ GCE | 0.06 | 0.2–100 | 0.91 | [42] |
| MoS2–BHCs/GCE | 0.015 | 0.05–80 | 0.35 | [43] |
| Hydrangea-like BNC/GCE | 0.0473 | 0.1–40 | 0.45 | This work |
| PG: pyrolytic graphite; LGE: laser-induced graphene electrode; OMC: ordered mesoporous carbon; MWCNTs: multiwalled carbon nanotubes; BHC: Bowl-shaped hollow carbon. | ||||
The ability of electrochemical sensors to adapt to complex environments, the number of times they can be reused, and the accuracy of testing are important indicators of their applicability. Therefore, we analysed and investigated their reproducibility and immunity to interference. Repeatability experiments measure the results of repeating an experiment many times without changing any conditions, and in the AA buffer solution containing 15 µmol/L, 10 continuous tests were performed. Fig. 5c shows the results. The fold line has a slight fluctuation, the difference between the test results is within 5%, and the RSD value is 2.6%, which indicates that the discretization of the test results from the mean value is good and that the data are close to the mean value. Fig. 5d shows the results of reproducibility tests conducted in the same buffer solution environment, using five different electrodes for testing and analysis. The five electrodes were measured three times, and the average values were similar. Moreover, the error was small, and the RSD was 2.2%, indicating that the results are highly accurate and that the test data are stable, meaning that the results are reproducible. The anti-interference ability is the key for the sensor to accurately detect AA in complex environments. To test the performance of this sensor, we added six cations (Na+, K+, Ca2+, Mg2+, Cu2+, Fe3+) and two anions (SO42-, CO32-) at concentrations 100 times higher than that of AA, and organic substances (chloramphenicol, uric acid, urea, glucose, glycine, glutamic acid, citric acid, and ascorbic acid) at concentration 50 times higher than that of AA, and two oxidizing agents (H2O2, KMnO4) at the same concentration as AA to a buffer solution containing 15 µmol/L of AA. Figs. 5e and f show the results of the subsequent analysis. The test results of the sensor for AA in the inorganic and organic environments were relatively stable, and the fluctuations of the electrochemical signal values were small, with peaks and troughs within 5%. These results indicate that the sensor had a better ability to resist interference in a complex environment, had a good selectivity for AA, and was able to analyze the AA accurately in a complicated testing environment. Hence, AA can be accurately analysed in a complex environment for real sample testing.
The practical application value of the hydrangea-like BNC-based sensor was obtained by analyzing the extract of the herbal medicine, which was processed by adding ethanol to Aristolochia powder, which was then heated, refluxed for 1 h and filtered. The filtrate was then evaporated, and the residue was dissolved by adding ethanol as a solution to be tested. This solution was then subjected to HPLC and electrochemical sensing analyses. Table 2 shows the test results. The recoveries of the tests were 97.2%–103.7%, the RSD ranged from 1.9% to 2.7%, and the electrochemical sensing test results were consistent with those of the HPLC, thereby indicating that the hydrangea-like BNC-based sensor was able to accurately detect AA content in Aristolochia and therefore has practical application value.
DownLoad:
CSV
| Sample | Add (µL) | Found (µmol/L) | RSD (%) | Recovery (%) | HPLC (µmol/L) |
| Aristolochia | 100 | 1.43 | 1.9 | 97.2 | 1.46 |
| 200 | 3.05 | 2.7 | 103.7 | 2.93 | |
| 350 | 5.09 | 2.1 | 99.2 | 5.13 |
In this work, we synthesised spiny spherical polymers by using the Friedel-Crafts crosslinking reaction and co-doped B/N via high-temperature calcination to synthesize a novel hydrangea-like boron and nitrogen co-doped carbon material for the construction of electrochemical sensors for the detection of AA. Rod-like branching increases the specific surface area of the material, which increases the number of active sites, and co-doping with B and N reduces the background current and improves the electrochemical performance. The effective area and redox capacity of the modified electrodes were greatly improved, compared with those of glassy carbon electrodes. Moreover, the hydrangea-like BNC-based sensor showed good sensitivity and accuracy under optimal conditions and was able to accurately detect AA in the range of 0.1–40 µmol/L with a sensitivity of 0.31 µA L µmol-1 cm-2 and a limit of detection of 47.3 nmol/L via the SWV method. In the complex sample environment of AA detection, the recoveries reached 97.2%–103.7% with RSDs of 1.9%–2.7%, and the results were consistent with those of the standard method of HPLC. In conclusion, the hydrangea-like B/N co-doped composites that we designed and synthesized exhibited excellent electrochemical properties and are potential candidates for the preparation of economical and practical electrocatalysts that are capable of rapidly and accurately detecting the AA content in Aristolochia and have excellent application value and development prospects.
The authors declare that they have no known competing financial interests or personal relationships that could have appeared to influence the work reported in this paper.
Menglin Zhou: Writing – original draft, Investigation, Data curation, Conceptualization. Lin Zhang: Visualization, Investigation. Xuefei Shan: Resources, Methodology. Fengqin Chang: Methodology, Formal analysis. Wentong Chen: Resources, Formal analysis. Xuguang An: Methodology, Formal analysis. Guangzhi Hu: Writing – review & editing, Validation, Supervision, Project administration, Funding acquisition.
The work was funded by the National Natural Science Foundation of China (No. 22476170), Science and Technology Talent and Platform Program of Yunnan Provincial Science and Technology Department (No. 202505AW340011), Double Thousand Plan of Jiangxi Province and Double First-Class University Plan (No. C176220100042).
Supplementary material associated with this article can be found, in the online version, at doi:
Z. Xian, J. Tian, Y. Zhang, et al., Biomed. Pharmacother. 142 (2021) 112081.
A. Dey, A.K. Hazra, A. Mukherjee, S. Nandy, D.K. Pandey, J. Ethnopharmacol. 266 (2021) 113416.
L. Ouyang, Q. Zhang, G. Ma, et al., Anal. Chem. 91 (2019) 8154–8161. doi: 10.1021/acs.analchem.9b00442
S.H. Zhang, Y. Wang, J. Yang, et al., Toxins 14 (2022) 879. doi: 10.3390/toxins14120879
F.d.r.D. Debelle, J.L. Vanherweghem, J.l.L. Nortier, Kidney Int. 74 (2008) 158–169. doi: 10.1038/ki.2008.129
J. Michl, H.M. Jennings, G.C. Kite, M.J. Ingrouille, M.S.J. Simmonds, M. Heinrich, J. Ethnopharmacol. 149 (2013) 235–244.
Y. Wang, W. Chan, J. Agric. Food Chem. 62 (2014) 5859–5864. doi: 10.1021/jf501609j
C.K. Chan, N.M. Pavlovic, W. Chan, Food Chem. 289 (2019) 673–679.
C.C. Lin, P.Y. Lin, Z. Han, et al., Spectrochim. Acta A 300 (2023) 122918.
Z. Du, Y. Li, C. Zeng, et al., Sens. Actuators B 417 (2024) 136189.
S. Zhou, Y. Luo, J. Wang, et al., Microchim. Acta 191 (2024) 366.
P. Agrawal, K. Laddha, J. Food Drug Anal. 25 (2017) 425–429. doi: 10.1016/j.jfda.2016.06.006
N. Zhumanazar, I.V. Korolkov, A.B. Yeszhanov, D.I. Shlimas, M.V. Zdorovets, Sens. Actuators A 354 (2023) 114094.
J. Ganesamurthi, X.R. Chen, R.S. Juang, S.Y. Wei, D.Y. Lin, J. Ind. Eng. Chem. 127 (2023) 270–282.
C. Yuan, C. Tang, X. Zhan, et al., J. Hazard. Mater. 467 (2024) 133715.
M. Zhou, G. Su, S. Pu, et al., Electroanalysis 35 (2023) e202200499.
K.Y. Goud, K.K. Reddy, M. Satyanarayana, S. Kummari, K.V. Gobi, Microchi. Acta 187 (2019) 29.
N.H. Phong, H.X.A. Vu, N. Van Hop, et al., J. Sci.: Adv. Mater. 8 (2023) 100592.
C. Gu, X. Su, B. Liu, et al., Microchem. J. 195 (2023) 109513.
G. Balkourani, A. Brouzgou, P. Tsiakaras, Carbon 213 (2023) 118281.
R. Huang, H. Zhang, X. Li, et al., Chem. Eng. J. 471 (2023) 144651.
T. Tang, M. Zhou, J. Lv, et al., Colloids Surf. B 216 (2022) 112538.
Y. Zhu, X. Wang, P. Wang, et al., Ecotoxicol. Environ. Saf. 225 (2021) 112745.
M. Zhou, T. Tang, D. Qin, et al., Sens. Actuators B 376 (2023) 132931.
S. Pu, M. Zhou, T. Tang, et al., Microchim. Acta 190 (2023) 307.
J. Li, P. Jin, W. Dai, et al., Mater. Chem. Phys. 196 (2017) 186–193.
R. Huang, J. Lv, J. Chen, et al., J. Hazard. Mater. 442 (2023) 130020.
J.S. Ma, M.Z. Wu, L. Chen, L.X. Zhang, Y. Xiong, Rare Met. 43 (2024) 380–388. doi: 10.1007/s12598-023-02401-1
X. Ma, P. Zhang, Y. Zhao, et al., Chem. Eng. J. 327 (2017) 1000–1010.
T. Sharifi, G. Hu, X. Jia, T. Wågberg, ACS Nano 6 (2012) 8904–8912. doi: 10.1021/nn302906r
Z. Huang, Z. Liao, W. Yang, et al., Electrochim. Acta 245 (2017) 957–966.
L. Chen, M. Shi, B. He, et al., J. Mater. Res. 34 (2019) 1993–2002. doi: 10.1557/jmr.2019.107
J. Hu, T. Zhao, H. Zhang, et al., Surf. Interfaces 38 (2023) 102818.
H. Wang, X. Bo, M. Zhou, L. Guo, Anal. Chim. Acta 1109 (2020) 1–8.
W. El hayaoui, N. Tajat, W.E. mouhri, et al., Microchem. J. 195 (2023) 109397.
T.N. Pham, D.N. Xuan, T.H. Van, et al., Langmuir 37 (2021) 12059–12070. doi: 10.1021/acs.langmuir.1c01853
C. Yuan, N. Li, X. Zhang, et al., Colloids Surf. A 675 (2023) 132011.
Y. Wang, M. Qiao, Y. Baikeli, et al., J. Hazard. Mater. 385 (2020) 121550.
Z. Sun, L. Liu, X. Zheng, et al., Anal. Bioanal. Chem. 378 (2004) 388–390.
U. Rajaji, P.S. Ganesh, S.Y. Kim, et al., ACS Appl. Nano Mater. 5 (2022) 3252–3264. doi: 10.1021/acsanm.1c03680
J. Wang, S.R. Wang, J.B. Hu, Q.L. Li, Chin. J. Anal. Chem. 30 (2002) 950–953.
Y. Wang, X. Mamat, Y. Li, et al., Electroanalysis 31 (2019) 1390–1400. doi: 10.1002/elan.201800893
M. Zhou, T. Tang, X. Deng, et al., Anal. Methods 15 (2023) 3449–3456. doi: 10.1039/d3ay00345k

Figure 2 (a–c) SEM images of hydrangea-like BNC. (d–f) TEM images of hydrangea-like BNC. (g-k) EDS images of hydrangea-like BNC.

Figure 3 (a) XRD image of hydrangea-like BNC. (b) XPS energy spectrum of hydrangea-like BNC. XPS energy spectrum of (c) C 1s, (d) B 1s, (e) N 1s. (f) Absorption and desorption isothermal curves and pore size fractions of hydrangea-like BNC.

Figure 4 (a) Nyquist diagram of GCE and hydrangea-like BNC/GCE. (b) CV of the GCE and hydrangea-like BNC/GCE in 0.1 mol/L KCl containing 5 mmol/L [Fe(CN)6]3-/4-. (c) SWV of the GCE and hydrangea-like BNC/GCE in 0.1 mol/L PBS with 15 µmol/L AA. (d) Linear relationship between the square root of the scan rate and the current response. (e) SWV current response curves at different pH values (4, 5, 6, 7, 9). (f) Linear relationship between the pH and potential. (g) Aristolochic acid detection mechanism.

Figure 5 (a) SWV current signal of GCE and hydrangea-like BNC/GCE in different concentrations of AA. (b) Linear relationship between the AA concentration and current signal. (c) Current signal measured 10 times with the same electrode. (d) Current signal measured by 5 different electrodes. (e) Current responses in different inorganic ions and oxidizing agents. (f) Current responses in different organic substances.
Table 1. Currently reported methods for detecting AA.
| Methods | LOD (µmol/L) | Linear range (µmol/L) | Sensitivity (µA L µmol-1 cm-2) | Ref. |
| PG Electrodes | 0.01 | 0.05–1.3 | 2.3 | [39] |
| MoS2/S-Ti3C2/LGE | 0.002 | 0.01–857.01 | 19.6 | [40] |
| OMC/GCE | 0.186 | 0.6–50 | 0.31 | [38] |
| Co/GCE | 0.08 | 0.12–37 | - | [41] |
| MoS2@MWCNTs/ GCE | 0.06 | 0.2–100 | 0.91 | [42] |
| MoS2–BHCs/GCE | 0.015 | 0.05–80 | 0.35 | [43] |
| Hydrangea-like BNC/GCE | 0.0473 | 0.1–40 | 0.45 | This work |
| PG: pyrolytic graphite; LGE: laser-induced graphene electrode; OMC: ordered mesoporous carbon; MWCNTs: multiwalled carbon nanotubes; BHC: Bowl-shaped hollow carbon. | ||||
 下载: 导出CSV
Table 2. Results of the hydrangea-like BNC-based sensor detection of AA in Aristolochia.
| Sample | Add (µL) | Found (µmol/L) | RSD (%) | Recovery (%) | HPLC (µmol/L) |
| Aristolochia | 100 | 1.43 | 1.9 | 97.2 | 1.46 |
| 200 | 3.05 | 2.7 | 103.7 | 2.93 | |
| 350 | 5.09 | 2.1 | 99.2 | 5.13 |
下载: 导出CSV

 扫一扫看文章

扫一扫关注我们
