Medical Science and Technology Innovation Center, School of Clinical and Basic Medical Sciences, Shandong First Medical University & Shandong Academy of Medical Sciences, Ji’nan 250117, China
b.
State Key Laboratory of Stem Cell and Reproductive Biology, Institute of Zoology, Chinese Academy of Sciences, Beijing 100101, China
Received Date:
12 December 2024 Accepted Date:
03 March 2025 Revised Date:
25 February 2025 Available Online:
15 February 2026
Abstract:In situ tumor vaccines, which leverage the antigenic profile of individual tumors, have demonstrated significant potential in tumor immunotherapy. However, their efficacy is often limited by the immunosuppressive tumor microenvironment (TME) and insufficient tumor targeting. To address these challenges, we engineered in situ nanovaccines through the self-assembly of the photosensitizer indocyanine green, immune adjuvant aluminum (Al3+), and hydrophilic drug zoledronic acid (ZOL). Intravenous injection of these nanovaccines led to efficient tumor accumulation, enhancing drug bioavailability and enabling the release of tumor-associated antigens via photothermal therapy. Additionally, the built-in ZOL induces polarization of tumor-associated macrophages, reversing the immunosuppressive TME. The potent antitumor immune response triggered by these nanovaccines effectively suppresses tumor growth. This study, which integrates a straightforward assembly method, substantial drug loading capacity, and promising therapeutic outcomes, introduces a novel and effective paradigm for carrier-free in situ nanovaccines in cancer treatment.
Immunotherapy, which aims to activate or enhance the body’s immune system to recognize and attack cancer cells, has emerged as a promising treatment for cancer [1-3]. It has shown substantial therapeutic success in certain cancers, particularly through the use of immune checkpoint inhibitors (ICIs), chimeric antigen receptor T-cell (CAR-T) cell therapy, and tumor vaccines [4-7]. Among these strategies, tumor vaccines, which trigger an antigen-specific immune response to target tumors, have gained increasing attention [8-10]. However, the application of tumor vaccines has been significantly hindered by tumor heterogeneity, individual patient variations, and the complexities in identifying specific mutant antigens [11-14]. To overcome these obstacles, in situ tumor vaccines have been developed by combining immune adjuvants with tumor-associated antigens (TAAs) that are directly released from dying tumor cells in vivo [15,16]. A significant advantage of in situ tumor vaccines is their reliance on the antigenic pool derived from individual tumors following various treatments, which eliminates the need for external antigen addition [17-19].
One promising approach for in situ vaccination is the induction of immunogenic cell death (ICD) in tumors. ICD is a process characterized by the release of TAAs and damage-associated molecular patterns (DAMPs), such as calreticulin (CRT), adenosine triphosphate (ATP), and high-mobility group protein B1 (HMGB1) [20-25]. These molecules act as “eat-me” and “find-me” signals, promoting the maturation of dendritic cells (DCs) and the activation of T cells to generate tumor-specific immune responses [26,27]. Photothermal therapy (PTT) has emerged as a highly effective, non-invasive strategy for tumor suppression and ICD induction [28-30]. However, despite its considerable promise in enhancing ICD-mediated immunotherapy, the clinical success of PTT is often restricted by challenges such as the systemic distribution of photosensitizers, rapid clearance from the body, and inadequate tumor accumulation [31]. To achieve more effective PTT-based in situ vaccination, optimized strategies that address these limitations are urgently needed.
In addition, the immunosuppressive tumor microenvironment (TME) poses a significant barrier to the efficacy of immunotherapy [32,33]. Among the immune cells within the TME, tumor-associated macrophages (TAMs) are the most abundant and predominantly adopt an immunosuppressive M2 phenotype, which plays a crucial role in fostering immunosuppression and enabling immune evasion by tumors [34]. By contrast, M1-type macrophages possess antitumor properties, such as secreting pro-inflammatory cytokines and enhancing T-cell activation [35]. Consequently, repolarizing TAMs from the M2 phenotype to the M1 phenotype is a promising strategy for mitigating TME-associated immunosuppression. This transformation facilitates the recruitment and infiltration of cytotoxic T lymphocytes (CTLs), thereby boosting anti-tumor immune responses [36]. Zoledronic acid (ZOL), a bisphosphonate widely used for osteoporosis treatment, has demonstrated the ability to polarize TAMs into the M1 phenotype [37,38]. However, its systemic administration faces significant challenges, including low bioavailability, off-target effects, poor cellular permeability, and potential toxicity [39,40]. To overcome these limitations, integrating TAM polarization with in situ vaccines offers an innovative approach. This strategy enables high tumor accumulation of therapeutic agents while simultaneously enhancing tumor immunogenicity and reversing the immunosuppressive TME, thereby promising a more potent immunotherapeutic effect.
Carrier-free nanoparticles (NPs), composed entirely or predominantly of active pharmaceutical ingredients (APIs), present a promising platform for drug delivery. These nanoparticles boast several advantages, including a straightforward preparation process, high drug loading capacity, and reduced carrier-induced side effects [41,42]. Building upon this concept, we developed an in situ nanovaccine, termed IZA NPs, through the self-assembly of the PTT photosensitizer indocyanine green (ICG), the immune adjuvant aluminum (Al3+), and ZOL via metal coordination-driven assembly (Scheme 1A). Following intravenous administration, IZA NPs demonstrated efficient tumor-specific accumulation. Upon localization, PTT induced ICD, which facilitated the release of TAAs and DAMPs, promoting DC maturation and T-cell activation. Simultaneously, the integrated ZOL polarized TAMs from the M2 to the M1 phenotype, alleviating tumor-induced immunosuppression. Collectively, these mechanisms generated robust antitumor immune responses, leading to significant inhibition of tumor growth (Scheme 1B).
Scheme 1
Scheme 1.
Schematic illustration of IZA NPs for improved tumor immunotherapy. (A) Schematic representation of the preparation of IZA NPs. (B) After intravenous injection, IZA NPs effectively accumulated in the tumor to form an in situ vaccine through PTT-induced ICD, thereby triggering antitumor immunity. Meanwhile, the released ZOL promoted M1 macrophage polarization by working synergistically to inhibit tumor growth.
As depicted in Scheme 1A, IZA NPs were synthesized through a one-step self-assembly method. Transmission electron microscopy (TEM) and scanning electron microscopy (SEM) images revealed that the IZA NPs possessed spherical and uniform structures (Figs. 1A and B). Dynamic light scattering (DLS) analysis of the NPs indicated an average hydrodynamic diameter of 274 nm, corroborating the TEM and SEM observations (Fig. 1C). The zeta potential of the NPs was measured at approximately −37.3 mV (Fig. 1D). To assess their colloidal stability, the particle size and polydispersity index (PDI) of the NPs were monitored at 1-day intervals. The parameters remained stable for 7 days in both water and a 10% fetal bovine serum solution. The results demonstrated no significant changes, indicating excellent stability under physiological and aqueous conditions (Fig. 1E and Fig. S1 in Supporting information). Ultraviolet-visible (UV–vis) absorption spectroscopy confirmed the successful encapsulation of ICG and ZOL, as indicated by their characteristic absorption peaks at 780 and 210 nm, respectively (Fig. 1F). Fourier transform infrared spectroscopy further validated the presence of these components within the IZA NPs. Peaks corresponding to ZOL (3160, 1638, 1582, and 1290 cm−1) and ICG (3430, 1412, 1355, 1085, 1005, and 930 cm−1) were distinctly observed (Fig. S2 in Supporting information) [43]. Elemental mapping images revealed the uniform distribution of phosphorus (P) (from ZOL) and Al elements, derived from ZOL and Al3+, respectively, confirming the successful loading of these components (Fig. 1G). Quantitative analysis through inductively coupled plasma mass spectrometry (ICP-MS) indicated that approximately 5.93% of ZOL was incorporated into the NPs. UV–vis spectrophotometry revealed an ICG encapsulation efficiency of 55.85%, demonstrating the effective integration of the functional components into the nanoparticle formulation. To investigate the release properties of IZA NPs, we conducted an analysis of ICG release from IZA NPs using UV–vis spectroscopy (Fig. S3 in Supporting information). The results indicate that in a physiological environment, only about 25% of the ICG was released within 24 h. In contrast, in an acidic microenvironment, the drug was released rapidly within the 1st h, followed by a gradual release of approximately 90% over 24 h. Furthermore, we found that laser irradiation further enhanced the release of the drug. This finding highlights the multifaceted responsiveness of IZA NPs, demonstrating they are both pH-responsive and light-responsive.
Figure 1
Figure 1.
Characterization and photothermal effect of IZA NPs. (A) TEM images, (B) SEM images, (C) size distribution, (D) zeta potential, and (E) colloidal stability of IZA NPs. (F) UV–vis spectra of ZOL, ICG, and IZA NPs. (G) High-angle annular dark field (HAADF)-TEM and the elemental mapping images of IZA NPs. Scale bar: 100 nm. (H) Temperature elevation of PBS, ICG, and IZA NPs under laser irradiation. (I) Photothermal curves of ICG and IZA NPs (at equivalent to ICG concentration) during three irradiation cycles. (J) Temperature changes of IZA NPs at different concentrations after 5 min of laser irradiation. (K) Temperature elevation of IZA NPs at varying concentrations under laser irradiation. (L) Infrared thermal images of IZA NPs at different concentrations. Data are presented as mean ± standard deviation (SD) (n = 3).
The photothermal properties of IZA NPs were evaluated using an 808 nm laser at a power density of 1 W/cm2. A substantial temperature rise was observed in both free ICG and IZA NPs upon irradiation, indicating efficient photothermal conversion (Fig. 1H). Importantly, the formation of IZA NPs did not diminish the photothermal conversion efficiency of ICG. Stability tests over three cycles of irradiation confirmed the consistent photothermal performance of the NPs compared to free ICG (Fig. 1I). Moreover, a dose-dependent photothermal effect was observed upon laser irradiation of varying concentrations of IZA NPs (Figs. 1J–L), underscoring their tunable and robust photothermal efficiency.
The cytotoxic effects of free ZOL, free ICG, and IZA NPs on 4T1 cells were assessed using a live/dead assay and the 3-(4,5-dimethyl-2-thiazolyl)−2,5-diphenyl-2-H-tetrazolium bromide (MTT) assay. The live/dead assay involved staining cells with calcein-AM (green, indicating live cells) and propidium iodide (red, indicating dead cells). As shown in Fig. 2A, treatment with IZA NPs followed by laser irradiation resulted in significantly higher cell death than with other treatments. This finding highlights the enhanced cytotoxicity of IZA NPs under photothermal conditions. The MTT assay unveiled that both free drugs and IZA NPs led to a dose-dependent decrease in cell viability with increasing concentrations (Fig. 2B). Notably, upon laser irradiation, IZA NPs demonstrated a remarkably stronger inhibitory effect on 4T1 cells than equivalent concentrations of free ZOL or ICG. These results underscore the superior phototoxicity of ICG when incorporated into NPs, suggesting that NP formulation enhances cellular uptake and bioactivity. To verify the cellular internalization of IZA NPs, 4T1 cells were separately incubated with free ICG and IZA NPs, and intracellular fluorescence was analyzed through flow cytometry. The data revealed a markedly stronger fluorescent signal in cells treated with IZA NPs compared to free ICG (Fig. 2C and Fig. S4 in Supporting information). This indicates that NP formulation significantly improves cellular uptake efficiency, thereby enhancing therapeutic efficacy. Subsequently, we investigated the intracellular distribution of IZA NPs in 4T1 cells by staining lysosomes with the LysoTracker probe. The results presented in Fig. S5 (Supporting information) indicated that IZA NPs were initially localized within lysosomes and gradually escaped into the cytoplasm. Moreover, the endocytic pathway of the IZA NPs was explored using various endocytosis inhibitors, including colchicine (Col), which inhibits both phagocytosis and micropinocytosis; dextran sulfate (Dex), an inhibitor of scavenger receptors; chlorpromazine (Chl), which inhibits the clathrin-mediated pathway of endocytosis; nystatin (Nys), an inhibitor of caveolae-mediated endocytosis; and amiloride (AMI), an inhibitor of the Na+/H+ exchanger that consequently impairs macrophage phagocytosis. As shown in Fig. S6 (Supporting information), the results indicated that the internalization of IZA NPs involves the clathrin pathway, scavenger receptor-mediated endocytosis, and phagocytosis. These findings collectively demonstrate the potent cytotoxicity and effective internalization of IZA NPs.
Figure 2
Figure 2.
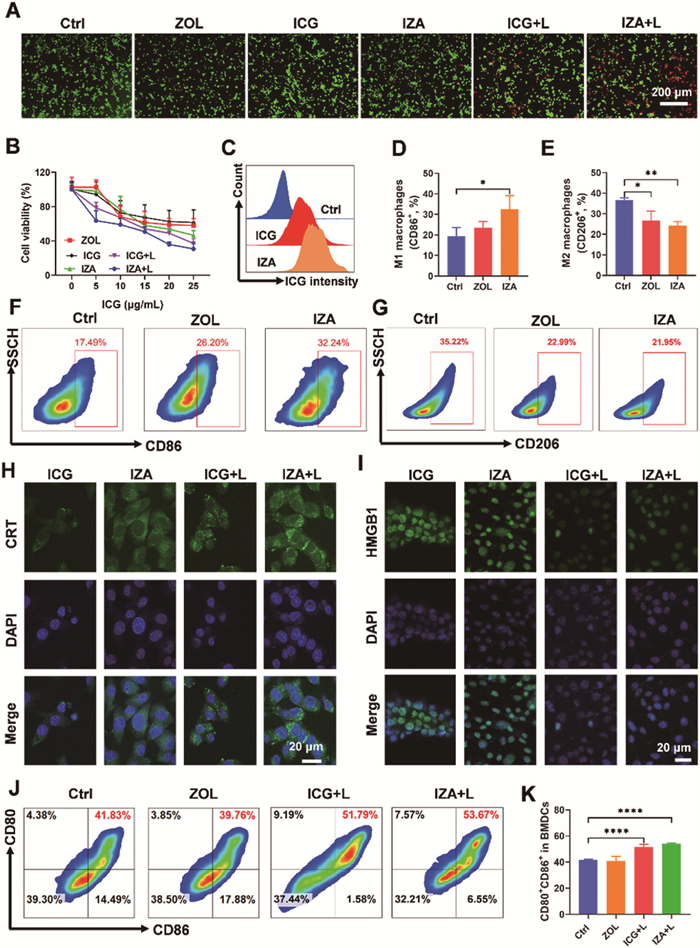
Cytotoxicity, cellular uptake, and immune activation effects of IZA NPs. (A) Live/dead analysis of 4T1 cells incubated with ZOL, ICG, and IZA NPs at various concentrations, without and with laser (+L) irradiation (808 nm, 1 W/cm2). Scale bar: 200 µm. (B) Cytotoxicity of 4T1 cells after different treatments. (C) Flow cytometry analysis of cellular uptake after treatment with ICG and IZA NPs. Flow cytometry analysis and statistical evaluation of M1 macrophage (D, F) and M2 macrophage (E, G) under different treatments. CLSM images showing (H) CRT (green) and (I) HMGB1 (green) secretion in 4T1 cells. Scale bar: 20 µm. (J) Flow cytometry graphs and (K) statistical analysis of DC maturation in BMDCs. Data are presented as mean ± SD (n = 3). *P < 0.05, **P < 0.01, ****P < 0.0001.
The ability to polarize macrophages from the immunosuppressive M2 phenotype to the pro-inflammatory M1 phenotype within the TME is a promising strategy to counteract immune suppression and modulate the TME [44,45]. To investigate the potential of ZOL IZA NPs in promoting macrophage polarization, RAW264.7 mouse macrophage cells (M0) were co-incubated with ZOL and IZA NPs for 24 h. The proportion of M1 macrophages (CD11b+F4/80+CD86+) was assessed through flow cytometry. As shown in Figs. 2D and F, ZOL treatment significantly increased the levels of M1 macrophage from 19% to 26% compared to the untreated control group. Notably, treatment with IZA NPs further enhanced this effect, resulting in an M1 macrophage population approximately 1.5 times greater than that induced by ZOL alone. Correspondingly, IZA NPs demonstrated the strongest ability to reduce M2 macrophage populations (CD11b+F4/80+CD206+) compared to the other treatment groups (Figs. 2E and G, Fig. S7 in Supporting information), suggesting the superior capacity of IZA NPs to repolarize macrophages, effectively reversing the immunosuppressive characteristics of the TME.
CRT and HMGB1 are hallmark indicators of ICD, which enhances tumor immunogenicity and stimulates antitumor immune responses [46]. To evaluate the induction of ICD, confocal laser scanning microscopy (CLSM) was employed to examine CRT and HMGB1 expression of 4T1 tumor cells treated with IZA NPs. As depicted in Fig. 2H and Fig. S8 (Supporting information), laser irradiation markedly increased CRT fluorescence in IZA NP-treated cells compared with the other treatment groups. Concurrently, a substantial decrease in nuclear HMGB1 expression was observed in the ICG and IZA NP groups following laser irradiation (Fig. 2I and Fig. S8). Additionally, enzyme-linked immunosorbent assay (ELISA) analysis of the cell culture supernatant revealed elevated HMGB1 levels in the IZA NPs group, indicating translocation of HMGB1 from the nucleus to the extracellular environment (Fig. S9 in Supporting information). This further substantiated that IZA NPs effectively induced ICD upon laser irradiation, a critical step for in situ vaccine formation.
As previously highlighted, the release of TAAs and DAMPs during PTT-induced ICD plays a pivotal role in enhancing DC maturation. To validate this mechanism, we initially treated 4T1 cells with various formulations and collected the resulting supernatant. This conditioned supernatant was subsequently incubated with bone marrow-derived DCs (BMDCs). After incubation, the expression levels of co-stimulatory molecules CD80 and CD86 were evaluated through flow cytometry. The results unveiled a significant enhancement in the expression of these molecules, with levels increasing by >10% in BMDCs treated with the supernatant from 4T1 cells pretreated with IZA NPs plus laser (IZA NPs + L) or ICG plus laser (ICG + L) (Figs. 2J and K). Conversely, no significant increase in these co-stimulatory molecules were observed in the ZOL-treated group compared with the control group. Meanwhile, the activation of IZA NPs in BMDCs extracted from BALB/c mice was also confirmed using a transwell assay, yielding results similar to those previously obtained (Fig. S10 in Supporting information). To further corroborate these observations, the concentrations of the cytokines interleukin-6 (IL-6) and tumor necrosis factor-α (TNF-α) in the BMDC supernatant were measured through ELISA. The cytokine profiles aligned closely with the BMDC maturation results observed through flow cytometry, showing significant upregulation in the IZA NPs + L group (Fig. S11 in Supporting information). These findings confirmed that the ICD effect triggered by PTT effectively promotes DC maturation, demonstrating strong vaccine-like effects.
A critical challenge in vaccination is ensuring the optimal accumulation of therapeutic agents at the targeted site to enhance treatment efficacy while minimizing systemic side effects [47]. To assess the tumor-targeting potential of IZA NPs, we conducted an in vivo imaging analysis of their distribution in 4T1 tumor-bearing BALB/c mice. All animal protocols adhered to the Guidelines for Care and Use of Laboratory Animals of Shandong First Medical University & Shandong Academy of Medical Sciences and were approved by the Animal Ethics Committee of Shandong First Medical University. As shown in Fig. 3A, pronounced fluorescent signals were observed at the tumor site within 4 h of intravenous administration of IZA NPs. These signals peaked at 8 h post-injection, remaining elevated for up to 24 h, indicating efficient accumulation at the tumor location (Fig. S12 in Supporting information). Following intravenous administration of phosphate buffered saline (PBS), ICG, or IZA NPs, the tumors were subjected to laser irradiation 8 h later. Photothermal imaging showed that the temperature at the tumor site did not change significantly after the injection of PBS. In contrast, the temperature at the tumor site increased rapidly after injection of ICG or IZA NPs, confirming the success of in vivo photothermal conversion (Fig. 3B and Fig. S13 in Supporting information). Notably, IZA NPs induced a greater temperature increase than free ICG, reinforcing the efficient tumor accumulation of the NPs at the tumor site (Fig. 3C).
Figure 3
Figure 3.In vivo antitumor effect of IZA NPs. (A) Distribution of ICG and IZA NPs in 4T1 tumor-bearing mice. (B) Infrared thermal images and (C) temperature change curves at the tumor site after laser irradiation. (D) Tumor volume curves in mice after various treatments. (E) Representative images and (F) weights of tumors after various treatments. (G) H&E, (H) Ki67, and (I) TUNEL staining images of tumors obtained from mice. Data are presented as mean ± SD (n = 5). *P < 0.05, **P < 0.01, ***P < 0.001.
To further evaluate the therapeutic efficacy of IZA NPs, we established a subcutaneous 4T1 tumor model in BALB/c mice. After intravenous injection of IZA NPs or other formulations, laser irradiation was applied to the tumors 8 h post-injection. This regimen was repeated three times at 2-day intervals. Throughout the treatment period, tumor size was monitored every 2 days by using the following formula: V = length × width2 × ½, where V is tumor volume. As illustrated in Fig. 3D and Fig. S14 (Supporting information), no notable reduction in tumor volume was noted in the groups that did not receive laser treatment. However, after laser irradiation, the IZA NP-treated group exhibited a marked decrease in tumor volume, with complete regression observed in 20% of the mice. At the end of the treatment cycle, tumors were harvested, photographed, and weighed, showing superior therapeutic outcomes for IZA NPs (Figs. 3E and F). Histological analysis via hematoxylin-eosin (H&E) staining revealed significant tumor cell damage and necrosis in the tumor sections of mice treated with IZA NPs and laser irradiation (IZA NPs + L), as evidenced by a marked reduction in the number of viable nuclei (Fig. 3G). Additionally, Ki67 staining indicated a notable increase in apoptosis in the tumor tissues of the IZA NPs + L group, highlighting the enhanced therapeutic effects of the combined treatment (Fig. 3H). Terminal deoxynucleotidyl transferase-mediated dUTP-biotin nick end labeling (TUNEL) staining further confirmed the substantial decrease in tumor cell proliferation in this group, with strong green fluorescence signals indicative of high levels of cell death (Fig. 3I). These findings collectively demonstrate the potent antitumor efficacy of IZA NPs in vivo.
For biosafety evaluation, H&E staining of the hearts, livers, lungs, and kidneys of the treated mice exhibited no obvious abnormalities or damage in these vital organs (Fig. 4A). Serum indicators of liver function, including alanine aminotransferase, aspartate aminotransferase, alkaline phosphatase, and albumin, along with kidney function indicators, such as blood urea nitrogen, uric acid, and creatinine, were similar across all groups of mice (Figs. S15 and S16 in Supporting information). Additionally, hemolysis assays confirmed minimal hemolytic activity, with all hemolysis rates remaining below 5%, further supporting the biocompatibility of IZA NPs (Fig. S17 in Supporting information). These findings underscore the favorable biosafety profile of IZA NPs, making them a promising candidate for cancer immunotherapy.
Figure 4
Figure 4.
Biosafety and immune activation effect of IZA NPs. (A) Pathological examination of organs from treated mice measured by H&E staining. Scale bar: 200 µm. (B) Distribution of CD8+ T cells (red) within tumor detected by immunofluorescence staining. Scale bar: 50 µm. Flow cytometry graphs of (C) CD8+ T cells and CD4+ T cells, along with (D) M1 macrophages and (E) M2 macrophages in tumors. Statistical analysis of (F) CD8+ T cells, (G) CD4+ T cells, (H) M1 macrophages, and (I) M2 macrophages in tumors. Data are presented as mean ± SD (n = 5). P < 0.05, ***P < 0.001.
The induction of ICD in tumor cells triggers a vaccine-like effect, subsequently activating DCs and T cells. To assess the immune-activating effects of IZA NPs in vivo, tumors, lymph nodes (LNs), and spleens from mice subjected to various treatments were harvested and analyzed. First, the infiltration of CD8+ T cells into tumor tissues was examined through immunofluorescence staining (Fig. 4B). Fluorescence imaging unveiled a marked increase in CD8+ T cell presence within the TME in the IZA NPs + L treatment group compared to other groups, reflecting enhanced T cell activation. Flow cytometry analysis further confirmed elevated levels of both CD8+ and CD4+ T cells in tumors, demonstrating that IZA NPs promoted effector T cell infiltration more effectively than the control treatments (Figs. 4C, F, and G). Next, macrophage polarization within the TME was evaluated through flow cytometry. While treatment with free ZOL alone did not significantly enhance M1 macrophage polarization (Figs. 4D and H), IZA NPs markedly increased the population of M1 macrophages at the tumor site. This increase was attributed to the NPs’ enhanced tumor-targeting ability. Additionally, upon laser irradiation, M1 macrophage levels further increased due to the synergistic effects of ICD induction and ZOL activity. Simultaneously, a corresponding decrease in the proportion of M2 macrophages was observed in the IZA NPs + L group (Figs. 4E and I), suggesting the reversal of immunosuppressive M2 macrophages into the pro-inflammatory M1 phenotype. This reversal contributed to the alleviation of the TME’s immunosuppressive state.
To further investigate immune activation in LNs, flow cytometry was performed. The results revealed that treatment with IZA NPs under laser irradiation significantly enhanced the levels of CD3+ T cells compared to other groups (Figs. 5A and D, Fig. S18 in Supporting information). Additionally, the percentages of CD8+ and CD4+ T cells in LNs were markedly higher in the IZA NPs + L group (Figs. 5B, E and F; Fig. S19 in Supporting information), indicating robust T cell activation in secondary lymphoid organs. The spleens of treated mice were also analyzed to evaluate systemic immune responses. Spleens were collected, weighed, and subjected to H&E staining. Mice treated with IZA NPs + L displayed significantly reduced spleen size compared with other groups (Fig. S20 in Supporting information), suggesting diminished immune suppression. Histological examination showed well-defined white pulp regions and an increased white-to-red pulp ratio in the spleens of the IZA NPs + L group (Fig. S21 in Supporting information), further corroborating enhanced immune activation. Furthermore, flow cytometry analyses of splenic T cells confirmed these findings, demonstrating increased T cell activation in the IZA NPs + L group (Figs. 5C and G). Collectively, these results suggested that treatment with IZA NPs + L effectively inhibited tumor growth by amplifying antitumor immune responses, including enhanced T cell activation and macrophage polarization, while mitigating immune suppression within the TME.
Figure 5
Figure 5.
Immune response of IZA NPs in LNs and spleens. Flow cytometry graphs of (A) CD3+, as well as (B) CD4+ and CD8+ T cells in LNs harvested from the treated mice. (C) Flow cytometry graphs of CD4+ and CD8+ T cells in the spleens. Statistical analysis of (D) CD3+, (E) CD4+, and (F) CD8+ T cells in LNs after various treatments. (G) Statistical analysis of CD4+ T cells in the spleens. Data are presented as mean ± SD (n = 5). *P < 0.05, **P < 0.01, ***P < 0.001, ****P < 0.0001.
In this study, in situ nanovaccines (IZA NPs) were synthesized using a self-assembly strategy, offering a novel solution to enhance tumor-targeted therapy. These NPs demonstrated efficient accumulation at tumor sites, significantly improving drug utilization while reducing systemic toxicity. Through PTT, the NPs induced tumor cell death and facilitated the release of TAAs, thereby promoting DC maturation and T-cell infiltration into tumor tissues. Simultaneously, the incorporation of ZOL contributed to TAM polarization, shifting the balance from the immunosuppressive M2 phenotype to the tumor-fighting M1 phenotype. This effectively reversed the immunosuppressive TME, further amplifying the immune response. Ultimately, the robust antitumor immunity elicited by the IZA NPs achieved significant tumor suppression in a subcutaneous mouse tumor model. The combination of a straightforward assembly method, high drug loading capacity, and superior therapeutic efficacy highlights this study’s potential to establish a promising paradigm for in situ carrier-free nanovaccines in cancer therapy.
Declaration of competing interests
The authors declare that they have no known competing financial interests or personal relationships that could have appeared to influence the work reported in this paper.
This work was supported by Natural Science Foundation of Shandong Province (Nos. ZR2023MB081, ZR2024QB346), and Shandong Traditional Chinese Medicine Technology Project (No. Q-2023127).
Supplementary materials
Supplementary material associated with this article can be found, in the online version, at doi:10.1016/j.cclet.2025.111031.
[1]
O.M. Feeney, G. Gracia, D.H.S. Brundel, et al., Adv. Drug Deliv. Rev. 160 (2020) 115–135. doi: 10.1016/j.addr.2020.10.002
[2]
M. Chang, Z. Hou, M. Wang, et al., Adv. Mater. 33 (2021) e2004788. doi: 10.1002/adma.202004788
Y.B. Liu, X.Y. Chen, B.X. Yu, et al., Small 20 (2024) e2309994. doi: 10.1002/smll.202309994
[47]
C. Feng, Y. Li, B.E. Ferdows, et al., Acta Pharm. Sin. B 12 (2022) 2206–2223. doi: 10.1016/j.apsb.2021.12.021
Scheme 1
Schematic illustration of IZA NPs for improved tumor immunotherapy. (A) Schematic representation of the preparation of IZA NPs. (B) After intravenous injection, IZA NPs effectively accumulated in the tumor to form an in situ vaccine through PTT-induced ICD, thereby triggering antitumor immunity. Meanwhile, the released ZOL promoted M1 macrophage polarization by working synergistically to inhibit tumor growth.
Figure 1
Characterization and photothermal effect of IZA NPs. (A) TEM images, (B) SEM images, (C) size distribution, (D) zeta potential, and (E) colloidal stability of IZA NPs. (F) UV–vis spectra of ZOL, ICG, and IZA NPs. (G) High-angle annular dark field (HAADF)-TEM and the elemental mapping images of IZA NPs. Scale bar: 100 nm. (H) Temperature elevation of PBS, ICG, and IZA NPs under laser irradiation. (I) Photothermal curves of ICG and IZA NPs (at equivalent to ICG concentration) during three irradiation cycles. (J) Temperature changes of IZA NPs at different concentrations after 5 min of laser irradiation. (K) Temperature elevation of IZA NPs at varying concentrations under laser irradiation. (L) Infrared thermal images of IZA NPs at different concentrations. Data are presented as mean ± standard deviation (SD) (n = 3).
Figure 2
Cytotoxicity, cellular uptake, and immune activation effects of IZA NPs. (A) Live/dead analysis of 4T1 cells incubated with ZOL, ICG, and IZA NPs at various concentrations, without and with laser (+L) irradiation (808 nm, 1 W/cm2). Scale bar: 200 µm. (B) Cytotoxicity of 4T1 cells after different treatments. (C) Flow cytometry analysis of cellular uptake after treatment with ICG and IZA NPs. Flow cytometry analysis and statistical evaluation of M1 macrophage (D, F) and M2 macrophage (E, G) under different treatments. CLSM images showing (H) CRT (green) and (I) HMGB1 (green) secretion in 4T1 cells. Scale bar: 20 µm. (J) Flow cytometry graphs and (K) statistical analysis of DC maturation in BMDCs. Data are presented as mean ± SD (n = 3). *P < 0.05, **P < 0.01, ****P < 0.0001.
Figure 3In vivo antitumor effect of IZA NPs. (A) Distribution of ICG and IZA NPs in 4T1 tumor-bearing mice. (B) Infrared thermal images and (C) temperature change curves at the tumor site after laser irradiation. (D) Tumor volume curves in mice after various treatments. (E) Representative images and (F) weights of tumors after various treatments. (G) H&E, (H) Ki67, and (I) TUNEL staining images of tumors obtained from mice. Data are presented as mean ± SD (n = 5). *P < 0.05, **P < 0.01, ***P < 0.001.
Figure 4
Biosafety and immune activation effect of IZA NPs. (A) Pathological examination of organs from treated mice measured by H&E staining. Scale bar: 200 µm. (B) Distribution of CD8+ T cells (red) within tumor detected by immunofluorescence staining. Scale bar: 50 µm. Flow cytometry graphs of (C) CD8+ T cells and CD4+ T cells, along with (D) M1 macrophages and (E) M2 macrophages in tumors. Statistical analysis of (F) CD8+ T cells, (G) CD4+ T cells, (H) M1 macrophages, and (I) M2 macrophages in tumors. Data are presented as mean ± SD (n = 5). P < 0.05, ***P < 0.001.
Figure 5
Immune response of IZA NPs in LNs and spleens. Flow cytometry graphs of (A) CD3+, as well as (B) CD4+ and CD8+ T cells in LNs harvested from the treated mice. (C) Flow cytometry graphs of CD4+ and CD8+ T cells in the spleens. Statistical analysis of (D) CD3+, (E) CD4+, and (F) CD8+ T cells in LNs after various treatments. (G) Statistical analysis of CD4+ T cells in the spleens. Data are presented as mean ± SD (n = 5). *P < 0.05, **P < 0.01, ***P < 0.001, ****P < 0.0001.


 DownLoad:


 下载:
下载:


