Citation:
Xiaoli Zhong, Liangsheng Chen, Hao Xu, Tianhang Jiang, Zhengyi Hua, Fancheng Tan, Xiaoya Mao, Ziquan Fan, Zhiwei Li, Jun Zeng, Shu-Hai Lin. Development of a comprehensive computational pipeline for cardiolipin atlas in an intermittent fasting model[J]. Chinese Chemical Letters,
2025, 36(12): 111027.
doi:
10.1016/j.cclet.2025.111027
Development of a comprehensive computational pipeline for cardiolipin atlas in an intermittent fasting model
English
Development of a comprehensive computational pipeline for cardiolipin atlas in an intermittent fasting model
State Key Laboratory of Cellular Stress Biology, Xiang'an Hospital, School of Life Sciences, XMU-HBN skin biomedical research center, Xiamen University, Xiamen 361102, China
b.
National Institute for Data Science in Health and Medicine, School of Medicine, Xiamen University, Xiamen 361102, China
c.
School of Pharmaceutical Sciences, Xiamen University, Xiamen 361102, China
d.
Thermo Fisher Scientific, Shanghai 201206, China
e.
HBN Research Institute and Biological Laboratory, Shenzhen Hujia Technology Co., Ltd., Shenzhen 518000, China
f.
College of Ocean Food and Biological Engineering, Jimei University, Xiamen 361021, China
g.
Research Unit Analytical BioGeoChemistry, Helmholtz Munich, Neuherberg 85764, Germany
shuhai@xmu.edu.cn (S.-H. Lin). 1 These authors contributed equally to this work.
Received Date:
14 October 2024 Accepted Date:
02 March 2025 Revised Date:
21 February 2025 Available Online:
15 December 2025
Abstract:
Cardiolipins (CLs), the mitochondria-specific class of phospholipids, are crucial to energy metabolism, cristae structure, and cell apoptosis. CLs present significant challenges in lipidomics analysis due to their structural diversity with up to four fatty acyl side chains. In this study, we developed CLAN (CardioLipin ANalysis), a comprehensive computational pipeline designed to improve the accuracy and coverage of cardiolipin identification. CLAN integrates three innovative modules: A cardiolipin identification module that utilizes specific fragmentation rules for precise characterization of CLs and their acyl side chains; a false positives detection module that employs retention time (RT) criteria to reduce false positives; and a prediction module that constructs regression models to identify CLs lacking authentic MS/MS spectra. CLAN achieved better identification accuracy and the highest recall rate for potential CL identification compared to the existing lipid identification tools. Furthermore, we applied CLAN program to an intermittent fasting mouse model, delineating tissue-specific CL alterations across 10 tissues. Every-other-day fasting (EODF) can partially counteract the disruption of the CL atlas across multiple tissues caused by high-fat-high-sugar diet feeding, providing novel insights into mitochondrial lipid metabolism under dietary interventions. Taken together, this work not only advances CL identification methodology but also underscores CLAN's potential in comprehensive analysis of CL atlas in the EODF animal model. CLAN is freely accessible on GitHub.
In healthy mitochondria, cardiolipin (CL) is localized to the inner mitochondrial membrane (IMM) [1,2], where it interacts with proteins to support cristae, playing a crucial role in cellular energy metabolism by participating in the composition of respiratory chain supercomplexes and ATP synthase [3–5]. In addition to supporting energy metabolism, CL facilitates the formation of mitochondrial cristae membranes and provides protection to mitochondrial DNA (mtDNA) [6–8]. These functions underscore its significance as an essential mitochondrial lipid, with its structural properties being key to its functional capabilities.
As the tetra-acylated diglycerophosphatidyl glycerol lipid, CL is characterized by the presence of four potential fatty acid acyl side chains, which allows for a wide range of combinatorial variations [9–12]. Unlike other dimer phospholipids, CL contains two 1, 2-diacyl-sn-glycerol-3-phosphoryl moieties that are linked via a glycerol bridge [9,13]. It has been demonstrated that the composition of CL, characterized by different acyl side chains, varies across various mouse tissues and organs [14]. Specifically, CL in adipose tissue plays a crucial role in maintaining organismal energy homeostasis by influencing thermogenic fat bioenergetics [15]. Additionally, the relative abundance of longer-chain cardiolipin species is significantly reduced in tumor tissues compared to normal cortex [16]. The diversity of CL is also correlated with histological patterns observed in the tumor microenvironment, including tumor cell invasion and viability.
High-performance liquid chromatography-mass spectrometry (HPLC-MS) is extensively employed for the analysis of biological components [17,18] and serves as a primary technique for lipidomics research [19]. Due to the structural similarities among molecules within lipid subclasses, theoretical predictions of MS/MS spectral patterns can be generated by analyzing fragmentation relationships. As a result, in current liquid chromatography-mass spectrometry (LC-MS)-based lipidomics study, automated lipid annotation primarily relies on matching experimental mass spectra to established spectral libraries, such as MS-DIAL [20], LipidSearch [21], and LipidMatch [22]. However, several challenges exist in the accurate annotation of CL molecules. The significant molecular diversity of CL presents considerable difficulties for accurate annotation. Given the critical importance of accurately characterizing CL isomers, the development of a specialized database for the rapid identification of CL and its isomers is particularly essential. Additionally, the absence of definitive structural information from low-abundance CL signals further complicates the annotation process. Classic matching algorithms like the dot-product (cosine), overlook actual significance of feature peaks and their fragmentation relationships, leading to feature redundancy [11]. Furthermore, while MS2 spectra provides critical information about molecular substructures through recorded fragments and their intensities, retention time (RT) data (or retention orders, RO), which is also closely linked to lipid structure, remains underutilized in automated spectral matching-based lipid annotation workflows. Given that RT information is readily available in all LC-MS/MS-based lipidomics studies, integrating MS2 and RT-based scores could enhance information utilization and significantly improve annotation performance in LC-MS/MS experiments.
In this work, we sought to delineate the cardiolipin atlas of multi-tissue of mice fed with high-fat-high-sugar (HFHS) diet with or without every-other-day fasting (EODF) as the dietary intervention. EODF, recognized as an effective strategy for managing overweight, has been shown to reduce glycolytic and mitochondrial energy production in the brains and livers of young mice, thereby preventing memory impairment associated with a high-fat diet [23–25]. As the crucial lipids in mitochondrial energy metabolism, the synthesis of cardiolipins in brown and beige fat mitochondria is vital for maintaining systemic energy homeostasis [15]. However, the specific changes in the acyl side chains of CLs during this process remain elusive. In this regard, we first developed an in-depth repository for cardiolipin identification, CLAN (CardioLipin ANalysis), aiming to improve the accuracy and coverage of CL annotation. Performance testing demonstrated that, compared to existing lipid identification methods, this tool effectively detects CL with higher accuracy and coverage. Therefore, this study not only advances CL identification methodologies but also underscores CLAN's potential in broader lipidomic research. CLAN is freely accessible on GitHub (https://github.com/LinShuhailab/CLAN).
Cardiolipin identification remains a significant challenge in LC-MS/MS analysis due to the molecular diversity and absence of definitive MS/MS information from low-abundance signals. To address this issue, we developed CLAN program, an in-depth repository designed to improve the accuracy and coverage of cardiolipin identification. The CLAN program, a rule-driven cardiolipin identification system, is based on LC-HRMS/MS system. Utilizing both MS1 and MS/MS spectra, the CLAN program encompassing an in-house developed theoretical database, facilitates high-confidence identification of CLs, monolysocardiolipins (MLCLs) and dilysocardiolipins (DLCLs).
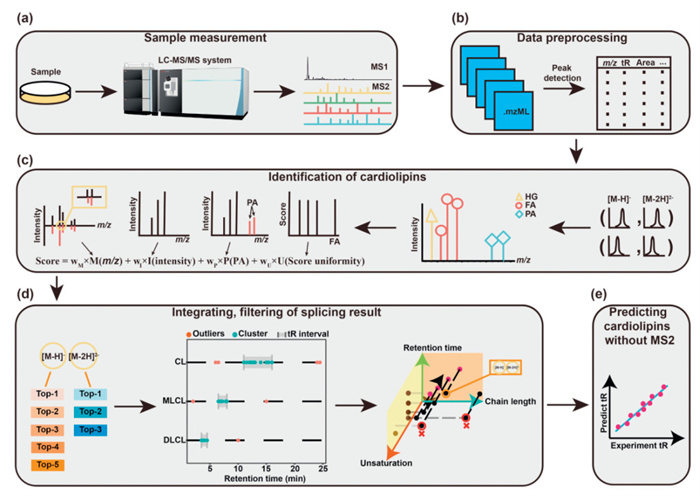
Informed by prior research on the structural characterization of CLs [13], our in-house developed database was generated by calculating all possible precursor deprotonated ions ([M-H]- and [M-2H]2-), corresponding fragment ions, and unsaturated levels. The workflow of the CLAN program is illustrated in Fig. 1. Briefly, lipids extracted from biological samples using our protocol with minor modifications were subjected to LC-HRMS/MS analysis for CL measurement [11,26]. MS1 and MS2 peaks, along with retention times, were extracted by MZmine 3 software to generate a peak list (Figs. 1a and b) [27]. The deprotonated ions ([M-H]- and [M-2H]2-) were reorganized and scored to identify potential CL species (Fig. 1c). Key considerations in the development of the scoring algorithm included the deviation values of the mass-to-charge ratios of FA and PA in the secondary ions, the ion intensities of FA and PA, the consistency among the four FA ion intensities, and the presence of PA. The identification was further refined by merging fragment ions from [M-H]- and/or [M-2H]2-, followed by the removal of false positives using an outlier detection algorithm and application of retention time rule (Fig. 1d). For those lacking MS2 fragments in LC-MS/MS analysis, CL species were predicted using a retention time model (Fig. 1e). In each MS/MS spectrum, retention time and precursor ions m/z values were evaluated to confirm co-elution with CL MS1 peak. In summary, the CLAN program integrates precursor deprotonated ions and their associated PA and FA chains to comprehensively identify CL, MLCL and DLCL structures.
Figure 1
Figure 1.
Overview of the CLAN Program Workflow. (a, b) A graphical summary of the non-targeted LC-MS workflow, beginning with LC-MS analysis, followed by peak extraction using MZmine to generate a candidate peak list. (c) MS/MS spectra matching the MS1 peak table are linked to corresponding MS1 features. The combined results are then scored using our scoring algorithm (HG, Head Group). (d) MS/MS identification results and different additive forms derived from the same cardiolipin are merged by a merging algorithm to eliminate redundancy, and false positives are filtered out using a retention time-based method. (e) Precise qualitative results with MS/MS are utilized to train a regression model, which predicts the reliability of cardiolipin candidates that lack MS/MS spectra.
Notably, while CLAN program integrates MS1 and MS2 spectrum to match peaks corresponding to potential CL molecules, it is crucial to eliminate false positives to achieve high-confidence identification. To address this, we implemented an outlier detection algorithm based on retention time (RT) and the equivalent carbon number model to remove CLs with retention time discrepancies (Fig. 1d). The outlier detection algorithm calculates the median and quartiles for all data corresponding to the same subclass of CL, identifying values outside this range as outliers. The equivalent carbon number model is presumed that for molecules with the same unsaturated level, longer chain lengths generally cause the longer retention times on one hand; on the other hand, for molecules with the same chain length, higher unsaturated levels correspond to shorter RT values [19,28,29]. These rules have also been statistically analyzed and defined using published datasets (Datasets 1 and 2 in Table S1, Fig. S1 in Supporting information) [30,31]. Herein, we developed a computational model to meet the RT-rule's set of CL, MLCL and DLCL molecules.
For potential CL molecules lacking MS/MS information in LC-HRMS/MS analysis conducted through data-dependent MS/MS acquisition, we developed an RT model, as aforementioned, to minimize the occurrence of false positive MS1 peaks (Fig. 1d). Given that MLCLs and DLCLs are typically present in much lower concentrations than CLs under physiological conditions, we incorporated an additional dimension, i.e., the number of acyl side chains, to integrate CLs, MLCLs and DLCLs into the model. This approach allows us to predict the theoretical RT values for potential CL molecules. By comparing these predicted RT values with experimental data, and considering RT tolerance, we can more accurately identify CL molecules including CLs, MLCLs and DLCLs.
As aforementioned above, the RT rule model, which combines an outlier detection algorithm based on RT and the equivalent carbon number model, was utilized to remove CLs with retention time discrepancies and reduce false positives. Considering the polarity of cardiolipin in relation to total chain length and unsaturation levels, we applied a globally optimal RT algorithm to the datasets. This algorithm iteratively filtered outliers until the global optimum was reached, thereby effectively reducing false positives to obtain high-confidence CL molecules (Fig. S2a in Supporting information).
To evaluate its effectiveness, we first tested the model using three published datasets (Datasets 3–5 in Table S1 in Supporting information) [32–34]. After applying the RT rule model, CLAN achieved a remaining rate for the identification results ranging from 95% to 100% (Fig. S2b in Supporting information). Further, a pooled cell sample consisting of human lung cancer cell lines (A549 and H1299), hepatocellular carcinoma cell lines (HCCLM3 and MHCC 97H), and embryonic kidney cells (HEK 293T) were utilized to acquire and evaluate lipid profiling. To ensure the accuracy and reliability of the comparison, the identification of cardiolipin (CL) within the dataset was independently verified by two experts with high qualifications. As a result of this global optimization process, CLAN effectively eliminates interfering features while retaining high-confidence CL molecules within the datasets (Fig. S2c in Supporting information). Moreover, random noise was added to the pooled sample dataset to assess the performance of CLAN in reducing false positives. The results indicate that CLAN effectively removes the majority of noisy data while preserving accurate results in both internal pooled cell sample datasets and published datasets (Figs. S2d and S3 in Supporting information).
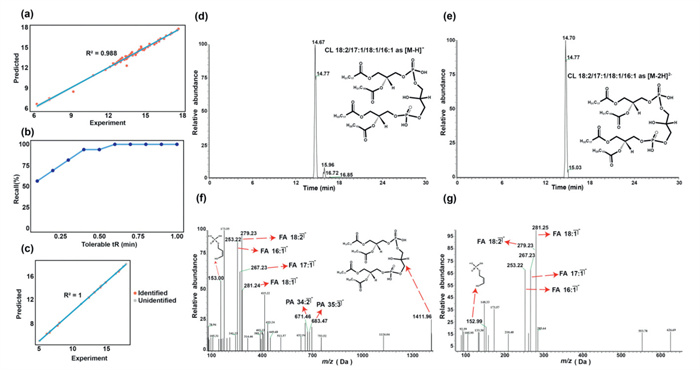
As previously discussed, these CL datasets obtained from LC-MS/MS were utilized for subsequent training and prediction, with 70% of the data allocated for training and 30% for prediction validation. An R2 of 0.988 and a robust recall could be achieved based on the prediction module (Figs. 2a and b).
Figure 2
Figure 2.
Performance of the CLAN Prediction Model. (a) Model fitting degree evaluated on 30% of the pooled cell sample dataset. (b) Model recall rate evaluated on the same 30% of the dataset. (c) Verification performance in ID-X mode. (d-g) Examples demonstrating validation in ID-X mode.
In traditional data-dependent MS2 analysis, definitive MS2 spectra for low-abundance analytes are often absent. To improve validation, we employed LC coupled with a novel Orbitrap ID-X Tribrid mass spectrometric system to verify low-abundance analytes in complex samples. Based on the results of the above pooled cell sample, 10 out of the 19 CL molecules predicted by CLAN with an R2 of 1 were confirmed via ID-X mass spectrometric measurement (Table S2 in Supporting information). The MS/MS fragmentation for the remaining 9 CLs could not be obtained due to low ion intensity. Among those validated by ID-X MS experiments, the prediction accuracy reached 100% (Fig. 2c). An example of the validation process using ID-X mass spectrometric measurement was presented in Figs. 2d-g. Additional CL molecules predicted by CLAN and validated by ID-X mass spectrometric measurement were shown in Figs. S4 and S5 (Supporting information). Together, these findings indicate that CLAN could efficiently predict CLs by using an in-house developed database and the retention time rule for potential CL molecules lacking MS/MS fragment ions in traditional data-dependent MS2 analysis.
We used the above pooled sample dataset for the evaluation of CLAN program in CL identification. Firstly, we extracted MS1 peaks corresponding to potential CL molecules (Fig. S6a in Supporting information). Secondly, we used this dataset to evaluate the number of potential CL molecules identified based on MS/MS spectra throughout the process, including the head group, the PA/FA, and the remaining results after retention time filtering (Figs. S6b-e in Supporting information). Our findings indicate that the CLAN program achieves the highest number of cardiolipin annotations compared to other software tools (Fig. S6f in Supporting information). Thirdly, the CLAN prediction model was utilized to cover those CLs lacking MS/MS fragmentation. Compared to MS-DIAL, LipidSearch, and LipidMatch, the CLAN program tentatively identified 88 potential CL molecules, while MS-DIAL identified 55, LipidSearch identified 72, and LipidMatch identified 60 CL molecules from the same datasets (Table S3 in Supporting information). A comparison of the annotation accuracy between the CLAN program and these software tools revealed that CLAN achieved the highest identification accuracy rates (Fig. S7a in Supporting information). Additionally, CLAN demonstrated the highest recall rate for potential CL identification among the four methods in the dataset (Fig. S7a).
Further, the external data set with published CL identification results (Dataset 5 in Table S1) was utilized to evaluate performance [34]. As demonstrated in Fig. S7b (Supporting information), CLAN achieved the highest identification accuracy and the highest recall rate for potential CL identification, in comparison with the published identification results (Table S4 in Supporting information) [34].
To apply CLAN program for delineating CL atlas in multi-tissue of mice, we extracted CL molecules from 10 tissues of wildtype healthy mice: brown adipose tissue (BAT), brain, heart, kidney, liver, lung, pancreas, soleus muscle, spleen and testis based on LC-HRMS/MS (Table S5 in Supporting information). The analysis demonstrated that the relative standard deviations for most CL identification across all tissues were below 20%, indicating the robustness of CL measurements.
Comprehensive mapping of CL profiles across tissues, coupled with principal components analysis (PCA), highlighted metabolic heterogeneity among the 10 tissues. Notably, the fatty acyl chain profiles of CL molecules, ranging from C12:0 to C22:5, were characterized, revealing that C18:1 and C18:2 fatty acid chains serve as signature biomarkers that differ among different organs, consistent with previous findings [14]. Of note, C18:2 was found to be the most abundant acyl chain in CLs (Fig. 3 and Fig. S8 in Supporting information). In addition, the number of C=C double bonds and the carbon chain length in CL profiles across the 10 tissues were elucidated by CLAN (Fig. 3 and Fig. S9 in Supporting information). Intriguingly, the C18:2 to C18:1 ratio in BAT, heart, kidney, liver, lung, pancreas tissues are much higher, suggesting that the CL C18:2/C18:1 ratio serves as a characteristic marker of mitochondrial biogenesis in these tissues. Therefore, CLAN was successfully employed to generate a CL atlas across multi-tissue in male wildtype healthy mice, providing insights into the molecular phenotypes of mitochondria in different tissues.
Figure 3
Figure 3.
Abundance of acyl side chains in cardiolipin across different organs of normal mice. (a-j) The bar graph displays the relative abundance of various acyl side chains, represented by different colors. The height of each bar indicates the abundance of the corresponding acyl side chain. In all organs except the brain and testis, FA 18:2 is the predominant acyl side chain, whereas in the brain and testis, the abundances of FA 18:1 and FA 18:2 are similar. (k-m) Comparison of mean unsaturation (left panel) and total chain length (middle panel) across tissues, normalized to soleus muscle (Sole). The right panel describes the diversity of the CL spectrum, quantified as the number of species constituting 95% of the total cardiolipin content (n-CL95%). (n) FA 18:2 (orange) and other essential fatty acid content (green). (o) Tissue-specific CL 18:2/18:1 ratio.
Dietary patterns and intermittent fasting might affect metabolic remodeling and mitochondrial bioenergetics [24]. Given that CLs are the mitochondria-specific phospholipids that might be influenced by diet and/or intermittent fasting, we applied CLAN program to map the CL atlas in response to EODF across 10 tissues in mice subjected to HFHS diet and a standard chow diet, respectively (Table S5). The animal experiments were divided into four groups: standard chow diet (C group), chow diet with EODF (CE group), HFHS diet (H group), and HFHS diet with EODF (HE group). Blood glucose tolerance, insulin tolerance, and body weights were measured, revealing that the HFHS diet evaluates blood glucose levels and body weight, whereas EODF mitigates these pathological impacts to some degree (Fig. S10 in Supporting information).
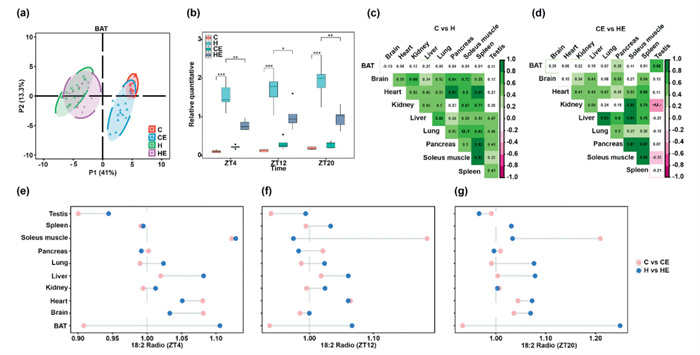
Activation of energy expenditure in thermogenic fat is a promising strategy to improve metabolic health. This study specifically focuses on cardiolipin metabolism in BAT under intermittent fasting conditions, aiming to uncover novel pathways for improving metabolism and to provide valuable insights for future research. Here, brown adipose tissue is used as a representative example. A clear separation is observed between the HFHS diet group and the chow diet group, with a notable trend of separation between the C group and CE group (Fig. 4a). Subsequently, cardiolipins that exhibited significant changes in the HFHS diet group, followed by a reversal upon intermittent feeding, were identified. In brown adipose tissue, the cardiolipin of interest was CL 70:5 (Fig. 4b).
Figure 4
Figure 4.
Diversity of cardiolipin composition in mouse tissues. (a, b) PCA dimensionality reduction plots for different groups in brown fat and metabolic trajectory plots across different rhythms. (c, d) Correlation analysis of various organs under different rhythms during intermittent fasting. (e-g) Comparison charts illustrating different acyl side chains across various organs.
Considering that animals are exposed to controlled light-dark cycles (12 h light: 12 h dark) to simulate a day-night rhythm, we mapped the dynamic changes in fatty acyl chains and unsaturated levels and conducted multi-tissue correlation analysis of CL molecules at different Zeitgeber time points (ZT4, ZT12 and ZT20, corresponding to 0:00, 8:00 and 16:00, respectively). We identified and quantified the cardiolipins that significantly altered by the HFHS diet, noting that these changes were partially counteracted by EODF (Fig. 4b). At the same time, the changes in acyl side chain composition of mice on a chow diet and HFHS diet were analyzed (Fig. S11 in Supporting information). Given the highest abundance of CL molecules and the highest C18:2 to C18:1 ratio observed in BAT (Fig. 3o), we focused our initial analysis on BAT [24]. Interestingly, the HFHS diet significantly increased the level of CL 70:5, identified as a potential biomarker in BAT through statistical screening, whereas EODF resulted in a significant reduction in this cardiolipin across all three time points (Fig. 4b). These findings suggest that the HFHS diet may promote pathologic changes through alterations in mitochondrial long-chain CL biosynthesis, whereas EODF exerts protective effects associated with CL remodeling.
In the correlation analysis of different tissues affected by the HFHS diet and EODF at different time points (ZT4, ZT12 and ZT20), we found that the CL profiles in mice fed with the HFHS diet remained relatively consistent across different time points, suggesting that the HFHS diet exerts a more dominant influence on CL profiling than circadian rhythm changes (Fig. 4b). Nevertheless, significant correlations were noted between the heart and spleen, heart and pancreas, spleen and pancreas, and soleus muscle and spleen, indicating that metabolic crosstalk between different tissues still warrants attention in the context of HFHS diet and/or the circadian rhythm influence (Figs. 4c and d). Additionally, when considering the combined effects of EODF and dietary factors, a great number of cardiolipin molecules were reversed by EODF in mice fed with HFHS diet compared to those on a standard chow diet.
As aforementioned above (Fig. 3), fatty acyl C18:2 chains are consistently present in CL molecules across all tissues. We investigated the impact of EODF on CL profiling at different time points in mice fed either a HFHS diet or a standard chow diet (Figs. 4e-g). In the testis of male mice, EODF consistently reduced CL levels across all time points, regardless of diet. Conversely, in BAT, EODF reduced CL C18:2 levels in mice on a standard chow diet but increased them in those on an HFHS diet across all time points. Notably, other tissues, such as the soleus muscle, exhibited different patterns of EODF effects at different time points. These findings suggest that CL profiling in mitochondria could be altered by both dietary interventions and intermittent fasting, with potential variations depending on the time of day. The CLAN program was applied to comprehensively map the CL atlas, providing novel insights into these effects and the related dynamic changes.
Given the molecular diversity of CLs and the absence of definitive MS/MS information from low-abundance signals in routine lipidomics analysis, developing a comprehensive repository for in-depth CL annotation is necessary. In this work, we demonstrated that in-house developed CLAN program facilitates automated and robust identification of CLs. CLAN employs a rule-based approach to enhance the accuracy of cardiolipin identification, incorporating redundant identification structures to improve confidence in the results. To minimize false positives, we implemented a retention time-based rule model to detect CLs with abnormal RT values, further improving the identification accuracy. Additionally, CLAN predicts CL molecules without MS/MS fragmentation, thereby increasing the coverage of identified CL molecules. Therefore, CLAN would facilitate the comprehensive mapping of CL atlas, providing a novel understanding of mitochondria-related diseases.
In addition, CLAN was also employed to profile CLs in multi-tissue of mice fed with or without HFHS diet/EODF at different time points, revealing the mitochondrial CL heterogeneity atlas across 10 tissues with circadian rhythm as well as dietary intervention. In particular, BAT is rich in mitochondria, as reflected by the dynamics and elasticity of CL atlas upon EODF effect. Indeed, to our best knowledge, this would be the first report in CL atlas of intermittent fasting, although the underlying mechanism still needs to be explored in the future.
The CLAN software, as presented in this study, has the following limitations: (1) The software is designed for comprehensive analysis of cardiolipins, but due to the limited availability of MLCL and DLCL samples from experimental and open-source datasets, targeted validation and analysis cannot be fully conducted. (2) Current detection technologies have limited ability to differentiate isomers based on retention time. The scarcity of isomeric samples with distinct retention times and insufficient software training may affect outlier detection and retention time prediction. (3) The method is currently optimized for reverse-phase liquid chromatography, as it offers superior differentiation of phospholipid structures. Adapting the software to other methods, such as ion mobility, will require further advancements in targeted training.
Ethical statement
The animals were obtained from Laboratory of Animal Center in Xiamen University and the Animal Ethics Committee of Xiamen University approved all the animal experiments (Approval Number XMULAC20220133).
Declaration of competing interest
Dr. Ziquan Fan is an Application Engineer of Thermo Fisher Scientific (Shanghai), China. Dr. Zhiwei Li is a Biotechnology R&D Scientist of Shenzhen Hujia Technology Co., Ltd. The other authors declare no competing interests.
This work was supported by grants from the National Key Research and Development Program of China (No. 2022YFE0205800), the National Natural Science Foundation of China (No. 21974114), Major Science and Technology Special Project of Fujian Province (No. 2022YZ036012), the Fundamental Research Funds for the Central Universities (No. 20720220003) and Project "111" sponsored by the State Bureau of Foreign Experts and Ministry of Education of China (No. BP0618017) to S.-H. Lin. Natural Science Foundation of Fujian Province of China (No. 2022J01330), Natural Science Foundation of Xiamen City of China (No. 3502Z20227208) and the China Scholarship Council (No. 202308350047) to J. Zeng.
Supplementary materials
Supplementary material associated with this article can be found, in the online version, at doi:10.1016/j.cclet.2025.111027
.
[1]
G. Paradies, V. Paradies, F.M. Ruggiero, G. Petrosillo, Cells 8 (2019) 728. doi: 10.3390/cells8070728
J. Zeng, J.L. Li, S.S.Y. Liu, et al., Sci. Total Environ. 753 (2021) 10. doi: 10.1007/s12204-021-2255-y
[32]
Z. Chen, Y. Wu, Y.S. Ma, et al., Anal. Bioanal. Chem. 409 (2017) 5735–5745. doi: 10.1007/s00216-017-0515-3
[33]
P.O. Helmer, A. Korf, H. Hayen, Rapid Commun. Mass Spectrom. 34 (2020) e8566. doi: 10.1002/rcm.8566
[34]
J. Zeng, J. Hao, Z. Yang, et al., Metabolites 13 (2023) 1118. doi: 10.3390/metabo13111118
Figure 1
Overview of the CLAN Program Workflow. (a, b) A graphical summary of the non-targeted LC-MS workflow, beginning with LC-MS analysis, followed by peak extraction using MZmine to generate a candidate peak list. (c) MS/MS spectra matching the MS1 peak table are linked to corresponding MS1 features. The combined results are then scored using our scoring algorithm (HG, Head Group). (d) MS/MS identification results and different additive forms derived from the same cardiolipin are merged by a merging algorithm to eliminate redundancy, and false positives are filtered out using a retention time-based method. (e) Precise qualitative results with MS/MS are utilized to train a regression model, which predicts the reliability of cardiolipin candidates that lack MS/MS spectra.
Figure 2
Performance of the CLAN Prediction Model. (a) Model fitting degree evaluated on 30% of the pooled cell sample dataset. (b) Model recall rate evaluated on the same 30% of the dataset. (c) Verification performance in ID-X mode. (d-g) Examples demonstrating validation in ID-X mode.
Figure 3
Abundance of acyl side chains in cardiolipin across different organs of normal mice. (a-j) The bar graph displays the relative abundance of various acyl side chains, represented by different colors. The height of each bar indicates the abundance of the corresponding acyl side chain. In all organs except the brain and testis, FA 18:2 is the predominant acyl side chain, whereas in the brain and testis, the abundances of FA 18:1 and FA 18:2 are similar. (k-m) Comparison of mean unsaturation (left panel) and total chain length (middle panel) across tissues, normalized to soleus muscle (Sole). The right panel describes the diversity of the CL spectrum, quantified as the number of species constituting 95% of the total cardiolipin content (n-CL95%). (n) FA 18:2 (orange) and other essential fatty acid content (green). (o) Tissue-specific CL 18:2/18:1 ratio.
Figure 4
Diversity of cardiolipin composition in mouse tissues. (a, b) PCA dimensionality reduction plots for different groups in brown fat and metabolic trajectory plots across different rhythms. (c, d) Correlation analysis of various organs under different rhythms during intermittent fasting. (e-g) Comparison charts illustrating different acyl side chains across various organs.

 DownLoad:


 下载:
下载:


