Scheme 1.
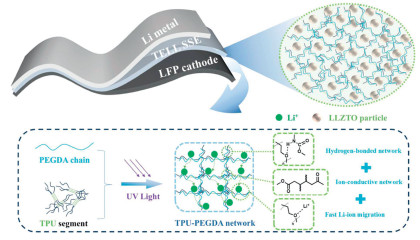
The interaction mechanism between TPU and PEGDA in the matrix of CSSE.
A designed flexible solid-state electrolyte with rich hydrogen-bonded networks from TPU-PEGDA/LLZTO for Li metal batteries
Haowen Li , Hongying Hou , Dai-Huo Liu , Bao Li , Dongmei Dai , Bao Wang , Mengmin Jia , Zhuangzhuang Zhang , Liang Wang , Yaru Qiao , Canhui Wu , Huihui Zhu , Pengyao Yan

The development of lithium-ion batteries is getting more and more attention with the current demand for portable devices and electric vehicles [1,2]. In the pursuit of higher energy density, the use of lithium metal anodes instead of the existing widely used graphite anodes is considered a viable option [3,4]. However, batteries using lithium metal as the anode produce lithium dendrites derived from the uneven deposition of lithium during electrochemical cycling [5,6]. In batteries using liquid organic electrolytes, dendrites can penetrate the polypropylene diaphragm causing the battery to short-circuit, which can lead to a fire or even an explosion [7,8]. Concerns about the safety of lithium metal anodes limit the prospects for large-scale application of lithium metal anode in today [9,10].
To overcome the safety issues caused by reactive lithium metal, the utilization of solid-state electrolytes instead of liquid-state electrolytes containing flammable organic solvents are viewed as an attractive option [11,12]. Solid-state electrolytes with ideal mechanical properties and free of flammable organic solvents can batter resist the puncture of Li dendrites, addressing concerns about the safety of lithium batteries [13,14]. The development of solid-state electrolytes can be mainly divided into two parts: Li+ conductive polymers and Li+ conductive ceramics [15,16]. Ceramic solid-state electrolytes offer high Li-ion conductivity, high electrochemical stability, and resistance to dendrite puncture, but they are fragile and have poor interphase contact with the electrodes [17,18]. Polymer SSEs have good formability and allow good interphase contact with the electrodes, but the low ionic conductivity at room temperature (RT) limits their application [19,20]. Composite solid-state electrolytes (CSSE) inherit the advantages and disadvantages of both polymer electrolytes and ceramic electrolytes [21,22]. The development of polymer materials with high RT ionic conductivity is necessary to obtain CSSE with favorable ionic transportation [23]. The RT ionic conductivity of the polymer portion in CSSE can be significantly enhanced by optimizing strategies such as structural design of polymers, multiple polymer composite, and the polymer in salt [24,25].
Thermoplastic polyurethane (TPU) is an engineering plastic with good flexibility, physical properties and chemical stability. TPU usually have a two-phase structure: A hard segment consisting of diisocyanates or polyisocyanates and a soft segment consisting of long-chain glycols [26]. Hard segments provide mechanical properties and thermal stability, soft segments provide limited ionic conductivity. TPU-based CSSEs for lithium-metal batteries (LMB) have received a lot of attention due to the various advantages of TPU. As an example, Tao et al. [27] prepared a solid polymer electrolyte (SPE) containing poly(ethylene oxide) (PEO), thermoplastic polyurethane (TPU), and lithium bis(trifluoromethanesulfonimide) (LiTFSI). The results show that the blending of TPU and PEO in SPE matrix significantly reduces the crystallinity and promotes the dissolution of lithium salt. The introduction of TPU also improves the mechanical and electrochemical stability of SPEs. Among the obtained SPEs based on TPU/PEO = 1:3 ratio exhibits desirable ionic conductivity (5.3×10⁻⁴ cm−1) and electrochemical stability (higher than 5 V related to Li+/Li) at 60 ℃. Zou et al. [28] introduced TPU as an ion-conducting framework in flexible electrodes and electrolyte materials. The application of this all-from-one strategy can effectively reduce the interfacial impedance in lithium metal batteries. Studies have shown that the functional groups of TPUs (-C=O, -NH and -C-O-C- groups) contribute to lithium-ion transport. The obtained TPU-based solid electrolytes have excellent flexibility and high ionic conductivity, and the ionic conductivity can reach 1.20×10⁻⁴ S/cm at room temperature.
Herein, we presented a strategy for the modification of the TPU-PEGDA CSSEs which contained LLZTO ion conductor and LiTFSI (denoted as TELL, and the contrast sample without PEGDA denoted as TLL). First, we introduced PEGDA into the TPU-NMP solution. The results of static potential and molecular dynamics simulations indicate that PEGDA at this point are adsorbed around the hard domain of TPU through hydrogen bonding interaction. Further, the UV irradiation (λ = 365 nm) was employed to make individual PEGDA molecular to form cross-linked PEGDA networks in situ. As shown in Scheme 1, cross-linked PEGDA networks remain adsorbed around TPU via hydrogen bonding interaction. The PEGDA network adsorbed on the TPU chains via hydrogen bonding can improve the ionic transport of the TPU matrix, it also can weaken the interactions between TPU chains and enhance the flexibility of the CSSE, and obtain better interfacial contacts. Thus, an optimized solid-state electrolyte (denoted as TELL) containing TPU, PEGDA, LiTFSI and Li6.5La3Zr1.2Ta0.5O12 (LLZTO) was well designed as shown in Scheme 1. The optimized TELL electrolyte was assembled into a lithium symmetric battery that could be stably cycled for 1400 h at 0.1 mA/cm2, its ionic conductivity was 0.718 mS/cm and Li+ transference number was 0.85. In situ generated PEGDA ionic conductive network in TPU-based CSSE provides a new approach for solving the poor ion-conductivity and flexibility of TPU in SSLMBs.
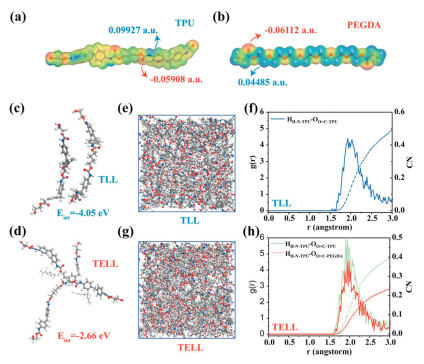
The mechanism of interaction between TPU and PEGDA molecules was first elucidated by analyzing the static potential. The magnitude of its value reflects the charge distribution of molecule and electrostatic potential in the molecule [29]. The calculation of the electrostatic potential of the molecules was carried out by DMol3 module [30]. The maximum positive potential (0.09927 a.u.) for the TPU molecule was located by the H atoms connected with the N atoms in hard segment, and the maximum negative potential was located around the O atoms in the C=O of the hard segment of TPU (Figs. 1a and b). In the PEGDA molecule, the maximum negative potential was distributed around C=O groups, which was larger than that of TPU. The static potential difference between molecules lead to the difference of intermolecular interaction. Thus, the interaction between the PEGDA and TPU molecules may be realized through the formation of hydrogen bonds. In addition, density functional theory (DFT) calculations were also performed to estimate the interactions between TPU molecules in TLL and TELL. As shown in Figs. 1c and d, the calculated results showed that the interaction between two TPU chains in TELL (Eint = −4.05 eV) was significantly weaker than that in TLL (Eint = −2.66 eV). This suggested that the interactions between TPUs in the matrix are weakened after the introduction of PEGDA molecules. To further explore the hydrogen bonding interaction between PEGDA network and TPU in electrolyte matrix, the solution environment of polymer precursor was investigated by molecular dynamics simulations (MDS). MDS snapshots of TELL and TLL precursors are shown in Figs. 1e and g, which provide insights into the hydrogen bonding interaction between PEGDA and TPU network. The radial distribution function (RDF) is used to compute statistical average structural properties of molecules in these systems. In the control TLL system, a strong intensity of the OO=C-TPU and HH-N-TPU peak (Fig. 1f) suggests the tight hydrogen binding between the hard domains of TPU. In contrast, the peak for OO=C-TPU and HH-N-TPU exhibits an enhanced peak intensity within TELL (Fig. 1h), and another peak for OO=C-PEGDA and HH-N-TPU shows up accompanied by decreasing coordination number between OO=C-TPU and HH-N-TPU (0.4), suggesting the addition of PEGDA promotes more hard domains of TPU to generate hydrogen bonds with both TPU and PEGDA network. This enhanced hydrogen bonding interaction can provide both upgraded mechanical properties and exceptional ionic transference performance.
Fourier transform infrared spectroscopy (FTIR) was used to prove the polymerization of PEGDA in TELL electrolytes. As shown in Fig. 2a, the absorption bands due to the stretching vibration of C=C at 1637 cm−1 disappeared in the cross-linked polymer matrix of TELL, indicating that vinyl groups from PEGDA have reacted mostly during UV-initiated polymerization. More importantly, the peak shift of the -NH group was more significant in TELL electrolyte (from 3322.19 cm−1 to 3320.39 cm−1) than in TLL electrolyte (from 3322.19 cm−1 to 3321.25 cm−1), which suggests that PEGDA produces more hydrogen-bonding interactions with the TPU (Fig. 2b) [31]. A nuclear magnetic resonance hydrogen spectroscopy (1H NMR) has been added to determine the conversion of PEGDA after UV-irradiation. As exhibited in Fig. S1 (Supporting information), peak a of 5.83 ppm and 6.42 ppm and peak b of 6.15 ppm are the hydrogen in the C=C bond environment of PEGDA [32]. After UV irradiation, the intensity of peaks of hydrogen in the C=C bond environment was significantly reduced, proving the successful polymerization of PEGDA in the TELL matrix after UV irradiation.
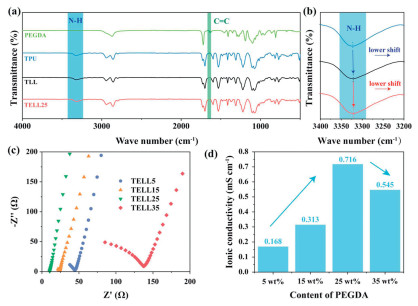
To analyze the effect of PEGDA on the ion-conduction behavior of composite solid-state electrolytes (CSSE), the ionic conductivity of CSSE with different PEGDA content (denoted as TELLX, where X present the weight ratio of PEGDA to TPU) were obtained by electrochemical impedance spectroscopy (EIS) test. The EIS curves of TELL0, TELL5, TELL15, TELL 25 and TELL35 (the mass of PEGDA is 0, 5, 15, 25, 35 wt% of the mass of TPU, respectively) are presented in Fig. 2c, and the calculated results are shown in Fig. 2d, corresponding circuit model applied in impedance in fitting is shown in Fig. S2 (Supporting information). It is obvious that the ionic conductivities of CSSE are obviously influenced through the introduction of PEGDA. Specifically, TLL exhibits a significantly lower ionic conductivity of 0.312 mS/cm than TELL25, which exhibits the highest ionic conductivity of 0.718 mS/cm comparing to other CSSEs. When the content of PEGDA was added to 35 wt%, TELL35 shows a reduced ionic conductivity. To further optimize the ion-conduction behavior of CSSE, the ionic conductivity of CSSE with different LLZTO fillers were also obtained. As shown in Fig. S3 (Supporting information), TELL SSE with 25 wt% LLZTO inorganic filler shows a higher ionic conductivity of 0.704 mS/cm. Slight differences in ionic conductivity test results can be attributed to systematic errors. When added in smaller amounts, inorganic fillers do not provide significant assistance for ion transport. Instead, the inorganic filler agglomerates, reducing the amount of inorganic filler that can effectively participate in ion transport. In this case, the prepared CSSE without PEGDA and the CSSE with optimized PEGDA component was chosen for the further investigation.
The effect of the introduction of PEGDA on the microstructures of CSSEs were also studied by the comparison between TLL and TELL electrolytes. The surface and cross-sectional morphology of TLL and TELL were observed using scanning electron microscopy (SEM). As shown in Figs. 3a and b, the TLL membranes reveal a porous structure while the TELL membranes show a flat surface without obvious hole structures. This indicates that the agglomeration of hard segments inside the TPU matrix after PEGDA modification is improved. The cross-section EDS mappings in Fig. 3c demonstrate that the C, N, O, F, S, La, Zr and Ta elements are uniformly distributed in TELL membranes, indicating the successful preparation of a uniform solid-state electrolyte. Atomic force microscope (AFM) was utilized to investigate the effect of PEGDA network on the polymer matrix of CSSEs. As shown in Figs. 3d and e, the TELL membranes have a lower surface roughness (115 nm) than that of TLL (232 nm). The flat and smooth surface is considered to be the prerequisite of the excellent interface contact.
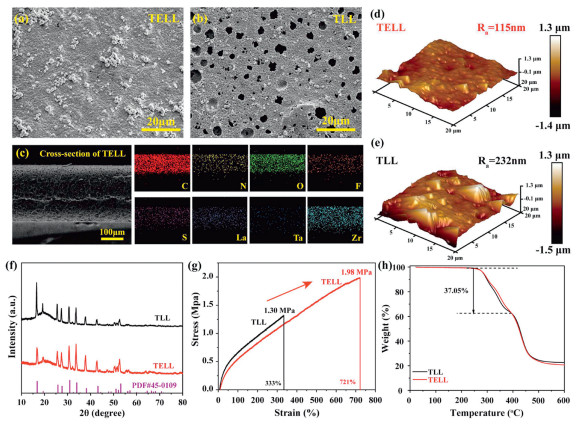
Considering the abovementioned results, the interaction between the cross-linked PEGDA network and TPU could promote the interfacial compatibility between CSSE and lithium metal cathode. X-ray diffraction (XRD) was employed to further study the successful composite between LLZTO ceramic particles and polymer matrix. As shown in Fig. 3f, XRD spectra of TELL and TLL exhibit the diffraction peaks, which are consistent with Li5La3Nb2O12 (PDF #45–0109), showcasing that the LLZTO ceramic particles are successfully composited in the electrolyte polymer matrix. The stress-strain curves of TELL demonstrate a tensile strength of 1.96 MPa (which higher than 1.30 MPa of TLL) and superior stretch-ability (maximum strain of 721%, which higher than 333% of TLL), insuring intimate contact between electrolyte and electrode for assembly LMBs. According to differential scanning calorimetry (DSC) curves, the glass transportation temperature (Tg) of TELL is about −38.87 ℃, lower than that of TLL (−34.34 ℃), demonstrating TELL clearly has a lower Tg, corresponding to lower crystallinity, which could benefit lithium-ion migration in CSSEs. Thermogravimetric (TG) indicates the good thermal stability of TELL electrolyte (Fig. S4 in Supporting information).
The EIS curves ranging from 30 ℃ to 80 ℃ were collected and are shown in Figs. 4a and b to obtain the diffusion data of Li+ in SSE, respectively. The ionic conductivity of TLL and TELL with the temperatures ranging from 30 ℃ to 80 ℃ was calculated according to formular 1 and the results were shown in Table S2 (Supporting information). Notably, the ionic conductivity increases with increasing temperatures correspondingly, and TELL can maintain higher conductivity in a wider temperature range comparing to TLL. As shown in Fig. 4c, ionic conductivities of TLL and TELL were 0.32 and 0.71 mS/cm at a temperature of 30 ℃, respectively. The correlation both temperature and ionic conductivity were calculated via the Arrhenius equation (Fig. 4d). The activation energy (Ea) of TELL (0.21 eV) is smaller than that of TLL (0.24 eV), showing the enhanced transport of lithium ions in TELL, which is consistent with the trend of the above ion conductivities. Li+ transference number (tLi+) is an important parameter of battery performance, and a higher tLi+ reduces interfacial polarization and promotes even lithium-ion deposition [31]. The tLi+ of TELL electrolyte was calculated to be 0.85, while that of TLL was 0.82 (Figs. 4e and f). The improved tLi+ in TELL is benefited from the introduction of the PEGDA network, which improves the aggregation of polymer chains in the matrix. The improved matrix is more homogeneous and better bonded to the fillers, allowing LLZTO fillers to participate more efficiently in Li+ transport. Thus, TELL electrolyte exhibits a low energy barrier for ion migration. While the Li+ in the TLL mainly travel through the pathway composed of dispersed and discontinuous -[EO]- unit on the soft domain of TPU and dispersed LLZTO fillers, thus resulting in a high activation energy.

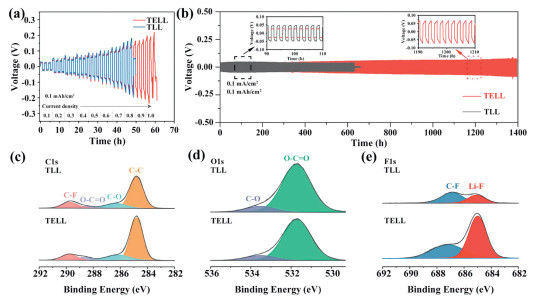
The effect of PEGDA network on the interphase stability as Li stripping/plating was investigated in Li symmetrical batteries. EIS test was conducted to examine the interface stability between TLL/TELL and lithium anode. The corresponding impendence fitting results and the circuit model are shown in Figs. S5, S6 and Table S1 (Supporting information), which exhibits that Li|TELL|Li cell have an interfacial impedance of 216.8 Ω, which is significantly lower than that of Li|TLL|Li cell (299.3 Ω). This result may be attributed to the introduction of PEGDA, which improve the interphase contact in both electrolyte and the Li anode. The critical current densities of symmetric lithium cells were tested from 0.1 mA/cm2 to 1.0 mA/cm2 and the time is 1 h for each plating and stripping (Fig. 5a). The TLL electrolyte exhibits a sharp potential decrease at 0.8 mA/cm2. In comparison, the TELL does not appear a potential drop until 1.0 mA/cm2, indicating that the enhanced ionic conductivity and mechanical strength contribute to the deposition of Li+. The symmetric Li|TLL|Li cell exhibits an overpotential of 39.7 mV under a current density of 0.1 mA/cm2 and occurs a short-circuit after 634 h cycling, which is probably caused by the low ionic conductivity of TPU matrix (Fig. 5b). With the introduction of PEGDA, the initial overpotential decreases to 17.7 mV and gradually increases to 62.9 mV after 1400 h, indicating that the addition of PEGDA decreases the overpotential and improves the cycle stability. SEM images of TLL and TELL from symmetric Li batteries are shown in Figs. S7a and b (Supporting information). It is worth noticing that the electrolyte from Li|TLL|Li after cycling for 100 h shows a rough and shattered surface, suggesting the serious side reaction as cycling. In contrast, for the TELL CSSEs from Li||Li cells, the electrolytes maintain a smooth surface. This could be concluded that the continuous TPU-PEGDA networks provide a fast Li+ transport route and promote the uniform deposition of Li+. X-ray photoelectron spectroscopy (XPS) tests were utilized to analyze the composition of the Li metal anode surface in Li||Li symmetric cells after 100 h cycling. The C 1s spectra consist of same species such as C-C/C-H (~284.8 eV), C-O (~286.8 eV), O-C=O (~288.6.0 eV) and C-F (~289.7 eV) in both cell with TLL and TELL electrolytes. And the O 1s spectra consist of same species such as C-O (~532.2 eV) and O-C=O (~533.9 eV) [33]. The organic components found on the surface of lithium metal electrodes indicate that the electrolyte forms a good interfacial contact with the lithium metal clicks during the cycling process. Furthermore, the peak assigned to LiF in the F 1s spectrum of Li metal anode cycled with TELL electrolyte revealed a higher intensity compared to that with TLL electrolyte, suggesting that stable and conductive organic-inorganic composite SEI generated at the surface between lithium anode and TELL electrolyte. This result explains why Li symmetrical batteries with TELL electrolyte possess a longer cycle life.
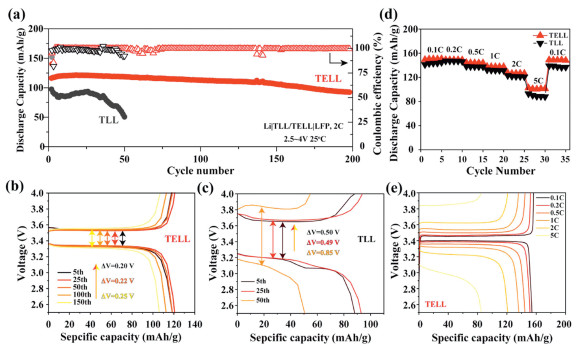
To assess the utility of TLL and TELL, Li|CSSE|LFP (LFP is LiFePO4) cells were assembled adding ~5 µL liquid electrolyte and electrochemically tested at 2 C (1 C = 170 mAh/g) at 25 ℃ (Fig. 6a). The Li|TELL|LFP cell was first activated with one cycle at 0.1 C, and the discharge-specific capacity maintained at 97.38 mAh/g at 2 C after 200 cycles, yielding a capacity retention of 78.93%. However, the capacity of the Li|TLL|LFP has significantly dropped to 50.6 mAh/g after 50 cycles and retained capacity only 51.9% due to an unstable Coulombic efficiency. In addition, a stable potential curves are achieved during cycling with a low increase of overpotential from 0.20 V to 0.25 V (Fig. 6b), which suggests the superior cycling stability of TELL over the TLL (large overpotential of 0.50 V to 0.85 V) in Li|CSSE|LFP (Fig. 6c). And we also tested the cycle and rate performance of the cells without liquid electrolyte under RT and 60 ℃. As shown in Figs. S8 and S9 (Supporting information), all cells could not be charged and discharged properly, this could be caused by poor interfacial contact between the electrodes and electrolyte. Furthermore, Fig. 6d reveals that the Li|TELL|LFP enabled specific capacities of 150.4, 148.9, 143.9, 137.5, 126.5 and 100.4 mAh/g at 0.1, 0.2, 0.5, 1.0, 2.0 and 5.0 C, respectively. Notably, when the current density was recovered to 0.1 C, the specific capacity values were close to the original capacity at 0.1 C, indicating that the Li|TELL|LFP cell has an excellent reversibility. An obvious plateau with low polarization is observed in Fig. 6e, which could be attributed to the high ionic conductivity of TELL SSE.
In conclusion, a superior TPU-based CSSE with fast ionic conductive and electrochemistry performances are successful designed via UV irradiated cross-linked PEGDA network. TPU has an excellent mechanical property, which can effectively resist lithium dendrites. PEGDA has a good interfacial contact with Li. PEGDA molecules are in situ adsorbed around the TPU molecules with hard segments through hydrogen bonding interactions, the PEGDA network is in situ generated by UV light treatment. The introduction of PEGDA weakened the hydrogen-bonded coordination between TPU and embedded into the periphery of the TPU molecules, providing a fast pathway for lithium-ion migration. So, the designed TELL CSSE displayed a high ionic conductivity of 0.718 mS/cm and a high ionic transference number of 0.85. Li|TELL|Li symmetric cell exhibited a stable charge-discharge cycling over 1400 h, LFP|TELL|Li cell exhibited decent rate performance and stable cycling performance.
The authors declare that they have no known competing financial interests or personal relationships that could have appeared to influence the work reported in this paper.
Haowen Li: Writing – original draft, Visualization, Validation, Methodology, Investigation, Formal analysis, Data curation, Conceptualization. Hongying Hou: Writing – review & editing, Supervision, Resources, Project administration, Methodology, Funding acquisition, Conceptualization. Dai-Huo Liu: Writing – review & editing, Supervision, Resources, Project administration, Methodology, Funding acquisition. Bao Li: Writing – review & editing, Supervision, Resources, Project administration, Methodology, Funding acquisition. Dongmei Dai: Resources, Project administration, Funding acquisition. Bao Wang: Resources, Funding acquisition. Mengmin Jia: Supervision. Zhuangzhuang Zhang: Supervision. Liang Wang: Resources. Yaru Qiao: Validation. Canhui Wu: Validation. Huihui Zhu: Validation. Pengyao Yan: Validation.
This work was financially supported by the National Natural Science Foundation of China (Nos. 52263010 and 52372188), 2023 Introduction of studying abroad talent program, Henan Provincial Key Scientific Research Project of Colleges and Universities (No. 23A150038), Key Scientific Research Project of Education Department of Henan Province (No. 22A150042), the National students' platform for innovation and entrepreneurship training program (No. 201910476010).
Supplementary material associated with this article can be found, in the online version, at doi:10.1016/j.cclet.2025.111020.
W.D. Li, E.M. Erickson, A. Manthiram, Nat. Energy 5 (2020) 26–34. doi: 10.1038/s41560-019-0513-0
W. Jia, J. Zhang, L. Zheng, et al., eScience 4 (2024) 100266. doi: 10.1016/j.esci.2024.100266
J.X. Wang, J. Ma, Z.F. Zhuang, et al., Chem. Rev. 124 (2024) 2839–2887. doi: 10.1021/acs.chemrev.3c00884
Z.Z. Dong, J.H. Zhang, L. Zhu, et al., Chin. Chem. Lett. 36 (2025) 109773. doi: 10.1016/j.cclet.2024.109773
D.H. Liu, Z. Bai, M. Li, et al., Chem. Soc. Rev. 15 (2020) 5407–5445. doi: 10.1039/c9cs00636b
J. Yang, X. Zhang, M. Hou, et al., Carbon Neutral. 4 (2025) e188.
H. Hou, Y. Wang, X. Liu, et al., J. Energy Storage 89 (2024) 111737. doi: 10.1016/j.est.2024.111737
H. Hou, B. Huang, X. Yu, et al., J. Energy Storage 68 (2023) 107680. doi: 10.1016/j.est.2023.107680
A. Kwade, W. Haselrieder, R. Leithoff, et al., Nat. Energy 3 (2018) 290–300. doi: 10.1038/s41560-018-0130-3
Z. Luo, Y. Cao, G. Xu, et al., Carbon Neutral. 3 (2024) 647–672. doi: 10.1002/cnl2.147
A. Manthiram, X.W. Yu, S.F. Wang, Nat. Rev. Mater. 2 (2017) 16103. doi: 10.1038/natrevmats.2016.103
D. Sui, J. Liu, Chin. Chem. Lett. 36 (2025) 110417. doi: 10.1016/j.cclet.2024.110417
X.W. Yu, A. Manthiram, Energy Environ. Sci. 11 (2018) 527–543. doi: 10.1039/c7ee02555f
C. Sun, J. Liu, Y. Gong, et al., Nano Energy 33 (2017) 363–386. doi: 10.1016/j.nanoen.2017.01.028
M. Forsyth, L. Porcarelli, X. Wang, et al., Acc. Chem. Res. 52 (2019) 686–694. doi: 10.1021/acs.accounts.8b00566
V. Thangadurai, S. Narayanan, D. Pinzaru, Chem. Soc. Rev. 43 (2014) 4714–4727. doi: 10.1039/c4cs00020j
R.S. Chen, Q.H. Li, X.Q. Yu, et al., Chem. Rev. 120 (2020) 6820–6877. doi: 10.1021/acs.chemrev.9b00268
S.F. Wang, H.H. Xu, W.D. Li, et al., J. Am. Chem. Soc. 140 (2018) 250–257. doi: 10.1021/jacs.7b09531
L.Z. Long, S.J. Wang, M. Xiao, et al., J. Mater. Chem. A 4 (2016) 10038–10069. doi: 10.1039/C6TA02621D
K.S. Ngai, S. Ramesh, K. Ramesh, et al., Ionics 22 (2016) 1259–1279 (Kiel). doi: 10.1007/s11581-016-1756-4
A.J. Li, X.B. Liao, H.R. Zhang, et al., Adv. Mater. 32 (2020) 1905517. doi: 10.1002/adma.201905517
D. Dai, P. Yan, X. Zhou, et al., Green Carbon 2 (2024) 310–315. doi: 10.1016/j.greenca.2024.06.002
W. Yu, N. Deng, Y. Feng, et al., eScience 5 (2025) 100278. doi: 10.1016/j.esci.2024.100278
D. Dai, X. Zhou, P. Yan, et al., ACS Appl. Mater. Interfaces 16 (2023) 2428–2437.
Y. Wang, C.J. Zanelotti, X. Wang, et al., Nat. Mater. 20 (2021) 1255–1263. doi: 10.1038/s41563-021-00995-4
K. Ramanjaneyulu, N. Bar, M.S. Arif Sher Shah, et al., J. Power Sources 217 (2012) 29–36. doi: 10.1016/j.jpowsour.2012.05.075
C. Tao, M.H. Gao, B.H. Yin, et al., Electrochim. Acta 257 (2017) 31–39. doi: 10.1016/j.electacta.2017.10.037
J. Zou, J. Zhang, L. Wang, et al., Sci. China Mater. 67 (2024) 1445–1454. doi: 10.1007/s40843-024-2913-8
X. An, Y. Kang, G. Li, Chem. Phys. 520 (2019) 100–107. doi: 10.1016/j.chemphys.2018.12.009
L. Tabari, D. Farmanzadeh, Appl. Surf. Sci. 500 (2020) 144029. doi: 10.1016/j.apsusc.2019.144029
H. Peng, T.R. Long, J. Peng, et al., Adv. Energy Mater. 14 (2024) 2400428. doi: 10.1002/aenm.202400428
F. Gao, Q. Wang, X. Yang, Colloid Polym. Sci. 298 (2020) 303–312. doi: 10.1007/s00396-020-04606-7
A.I. Boronin, S.V. Koscheev, G.M. Zhidomirov, J. Electron. Spectros. Relat. Phenom. (1998) 43–51.

Figure 1 Electrostatic potential spectra of (a) TPU molecule and (b) PEGDA molecule. Optimized DFT structure and intermolecular interaction energies for TPU/TPU in (c) TLL and (d) TELL. Snapshots of MDS trajectories of (e) TLL and (g) TELL. Radial distribution functions and coordination numbers of MDS trajectories of (f) TLL and (h) TELL.

Figure 2 (a) FT-IR spectra of pristine PEGDA, pristine TPU, TLL and TELL with the wavenumber range of 500–4000 cm−1, and (b) 3400–3200 cm−1 region of infrared spectra of TPU, TLL and TELL samples. (c) EIS profiles of TELL with different PEGDA content and (d) Columnar comparison of ionic conductivity.

Figure 3 SEM images of the surfaces of (a) TELL and (b) TLL electrolyte. (c) Scanning electron microscope image of the cross section of TELL CSSE and EDS mapping image. AFM images of (d) TELL and (e) TLL CSSE. (f) XRD patterns of TLL and TELL electrolyte. (g) Stress-strain curve images of TELL and TLL CSSE. (h) Differential thermal analysis images of TLL and TELL electrolyte.

Figure 4 EIS profiles of (a) TELL and (b) TLL under different temperature. (c) Columnar comparison of Rct and ionic conductivity of TLL vs. TELL. (d) Arrhenius plots of the ionic conductivities of the solid polymer electrolytes from 30 ℃ to 80 ℃. The chronoamperometry profiles of Li symmetric cells with (e) TELL and (f) TLL. Inset shows the Nyquist plots before and after polarization.

Figure 5 (a) Galvanostatic cycling curve and (b) cycling performances of Li||Li symmetric cell with TELL and TLL. XPS spectra of (c) C 1s (d) O 1s and (e) F 1s in Li metal anode cycled with TLL and TELL after 100 h.

Figure 6 (a) Cycling performance of Li||LFP cells at 2 C with TLL and TELL electrolytes. (b) Rate performance of Li|TLL|LFP and Li|TELL|LFP cells. Galvanostatic discharge/charge voltage profiles of (c) Li|TELL|LFP cell and (d) Li|TLL|LFP cell. (e) Galvanostatic discharge/charge voltage profiles of Li|TELL|LFP cell at different rates.

 扫一扫看文章

扫一扫关注我们
 DownLoad:

 下载:
下载: