Citation:
Yeqi Huang, Yue Gao, Yuxin Lin, Yihao Li, Si Xiong, Xia Guo, Chuanbin Wu, Xin Pan, Wenhao Wang, Ziyu Zhao, Zhengwei Huang. “Connect” or “drag”? The impact of physiologically relevant inorganic ion pairs on the protein corona adsorption onto liposomes[J]. Chinese Chemical Letters,
2026, 37(2): 111014.
doi:
10.1016/j.cclet.2025.111014
“Connect” or “drag”? The impact of physiologically relevant inorganic ion pairs on the protein corona adsorption onto liposomes
English
“Connect” or “drag”? The impact of physiologically relevant inorganic ion pairs on the protein corona adsorption onto liposomes
Department of Pharmacy, College of Pharmacy, Jinan University, Guangzhou 511436, China
b.
State Key Laboratory of Bioactive Molecules and Druggability Assessment, Guangdong Basic Research Center of Excellence for Natural Bioactive Molecules and Discovery of Innovative Drugs, College of Pharmacy, Jinan University, Guangzhou 511436, China
c.
Jiangmen Wuyi Hospital of Traditional Chinese Medicine, Affiliated Jiangmen Traditional Chinese Medicine Hospital of Jinan University, Jiangmen 529031, China
d.
School of Pharmaceutical Sciences, Sun Yat-sen University, Guangzhou 510006, China
Received Date:
02 November 2024 Accepted Date:
27 February 2025 Revised Date:
26 February 2025 Available Online:
15 February 2026
Abstract:
The protein corona formation has been reported to influence the liposomes’ behavioral performance in vivo. Accordingly, the effect of physiologically relevant inorganic ion pairs (sodium chloride, sodium sulfate, magnesium chloride, and magnesium sulfate) was investigated. Bovine serum albumin (BSA) was selected as the model protein. Parameters including particle size and zeta potential were assessed, while various spectroscopic techniques were utilized to elucidate the changes in BSA during its interaction with liposomes. The particle size and light intensity distribution changes indicated that the introduction of inorganic pairs, especially the metal cations, could significantly influence both the adsorption of BSA and the aggregation of particles. Furthermore, spectral characterization elucidated that BSA exhibited more extended peptide chains with enhanced exposure to hydrophobic acid amino residues upon adding ion pairs. Electrostatic adsorption and chelation insertion were proposed as metal ion binding modes and the corresponding BSA corona formation. In the electrostatic adsorption mode, sodium ions can enhance the electrostatic interactions, facilitating the “connection” between BSA and liposomes. Magnesium ions can induce stronger hydrophobic interactions through chelation, effectively “drag” BSA segments into the lipid bilayer. This work highlighted important physiological factors for protein-liposome interaction and provided rational model constructions to lay the foundation for further relevant studies.
Upon entry into the biological environment, many biomolecules in bodily fluids will adhere to the nanoparticle surface. The copious proteins frequently envelop the nanoparticle, giving rise to a protein shell called the protein corona [1,2], which can impact cellular uptake [3], biological distribution [4,5], immunogenicity [6], and blood circulation [7] of nanoparticles.
Metal cations, such as sodium (Na+) and magnesium (Mg2+) ions, are essential components of biological fluids, often forming inorganic ion pairs with cations such as chlorides (Cl−) and sulfates (SO42−). These ion pairs play a pivotal role in modulating the membrane potential, osmotic balance, acid-base equilibrium within cells, structural stability, and functional activation of biomacromolecules, such as proteins and membrane lipids [8]. However, previous research has insufficiently addressed the significance of ion pairs in liposome-protein interactions [9-13].
Herein, four inorganic ion pairs, sodium chloride (NaCl), sodium sulfate (Na2SO4), magnesium chloride (MgCl2), and magnesium sulfate (MgSO4), were employed as the reaction media. Bovine serum albumin (BSA) was selected as the mode protein. The variations in BSA adsorption behaviors onto liposomes were examined. Based on the results, two modes of metal cation binding and the corresponding protein corona formation mode were construed: charge adsorption mode and chelation insertion mode. By electrostatic attraction, Na+ can mediate stronger electrostatic interaction forces to "connect" BSA and liposomes. By ligand chelation, Mg2+ can mediate stronger hydrophobic interaction forces to "drag" BSA segments into the lipid bilayer.
Firstly, the homogeneous and stable liposomes were obtained (Figs. S1 and S2 in Supporting information). The size was 105.17 ± 0.09 nm, the zeta potential was −35.90 ± 1.30 mV, and the particle concentration was 1.19 × 10¹⁵ particles/mL. BSA (1500 µg/mL) was chosen for incubation concentration due to its optimal adsorption capacity (Fig. S3 in Supporting information). At this concentration, a dark protein coronated layer of a certain thickness was observed by transmission electron microscope (TEM) (Fig. S4A in Supporting information), and the conspicuous adsorption of BSA characterized by sodium dodecyl sulfate polyacrylamide gel electrophoresis (SDS-PAGE) (Fig. S4B in Supporting information) affirmed the formation of BSA corona. Noteworthy, individual ions did not influence the results in all subsequent experiments (Figs. S5, S6, S9 and S10 in Supporting information).
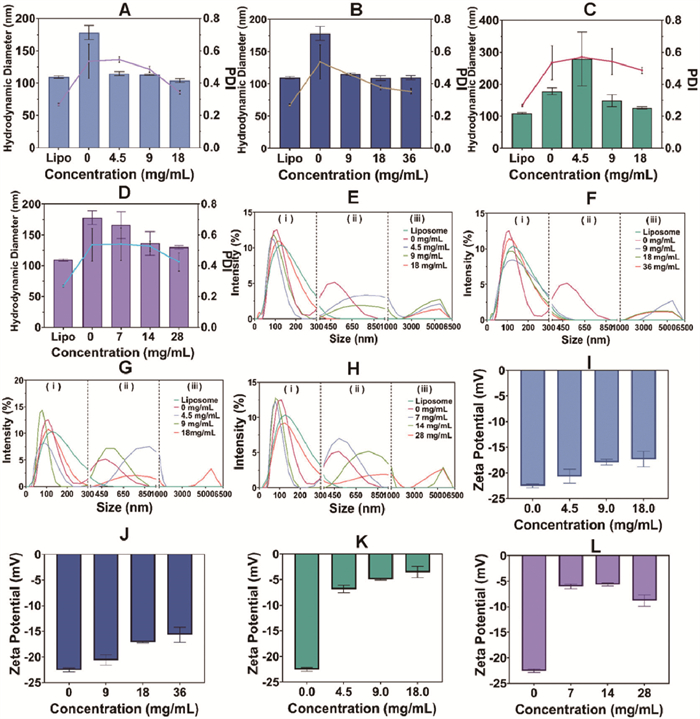
The particle sizes and particle distribution intensity (PDI) were studied and found to be primarily associated with the specific types of metal cations (e.g., Na+ or Mg2+) in the ion pairs solution (Figs. 1A–D). Three populations of particles were further identified (Figs. 1E–H): (ⅰ) <300 nm, well-dispersed liposomes and liposome-protein complexes; (ⅱ) 300–1000 nm, a moderate particle aggregation emerged following the incubation. Protein-induced aggregation [14] and the alteration of lipid bilayer stability in liposomes were likely contributing factors [15]; (ⅲ) >1000 nm, a micron-level particle population following the addition of electrolyte. Lower negative charge density due to metal cations probably reduced particle repulsion, leading to agglomeration. Region (ⅰ) of the four ion pair solutions showed minimal differences, while the distributions in regions (ⅱ) and (ⅲ) were associated with cation species. Na+ reduced moderate aggregation, while all concentrations resulted in micron-level particle aggregation clusters (Figs. 1E and F). In contrast, Mg2+ primarily promoted mild aggregation and only led to significant particle aggregation at high concentrations (Figs. 1G and H). This should be attributed to the supplementary effect of Mg2+ beyond charge neutralization, as the Mg2+ groups showed lower zeta potential than the Na+ groups (Figs. 1I–L).
Figure 1
Figure 1.
The hydrodynamic diameter (column) and PDI (line) of liposomes (Lipo) incubated with BSA in (A) NaCl solution, (B) Na2SO4 solution (C) MgCl2 solution, and (D) MgSO4 solution. The light intensity distribution of liposomes incubated with BSA in (E) NaCl solution, (F) Na2SO4 solution, (G) MgCl2 solution, and (H) MgSO4 solution. Three main particle populations were defined: (ⅰ) <300 nm, well-dispersed particles, (ⅱ) 300–1000 nm, moderate aggregate particles, and (ⅲ) >1000 nm, strong aggregate particles. And the zeta potential of liposomes incubated with (I) NaCl, (J) Na2SO4, (K) MgCl2, and (L) MgSO4. Data are presented as mean ± standard deviation (SD) (n = 3).
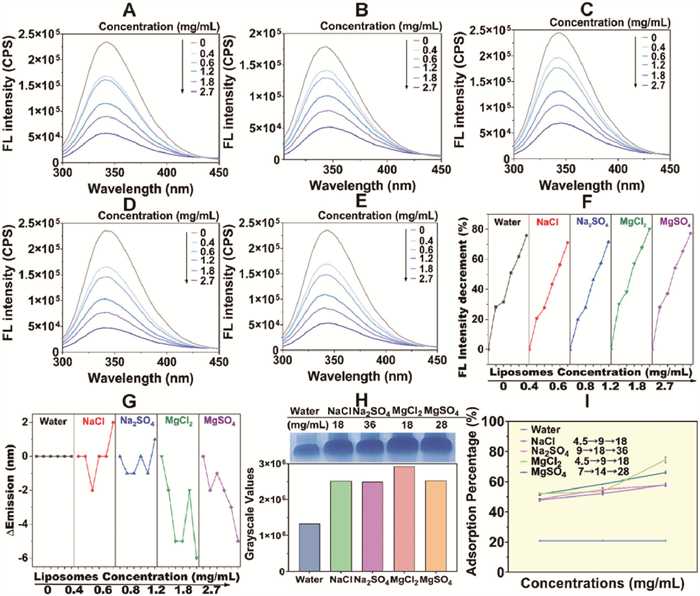
Subsequently, fluorescence quenching spectra were examined (Figs. 2A–E). Consistent with the above results, Mg2+ caused more evident fluorescence quenching intensity (MgCl2 80.19% and MgSO4 77.38% vs. NaCl 71.15% and Na2SO4 71.69%). Meanwhile, no significant alteration in the maximum emission wavelength was observed in the aqueous solution (342 nm). A slight red shift was observed in NaCl (344–346 nm, ∆emission (∆em) = 2 nm) and Na2SO4 (344–345 nm, ∆em = 1 nm). Conversely, with MgCl2 (345–339 nm, ∆em = 6 nm) and MgSO4 (343–338 nm, ∆em = 5 nm), a more pronounced blue shift emerged (Fig. 2G). This indicated the reduced polar microenvironment around chromophore amino acids (AAs) such as tryptophan (Trp), tyrosine (Tyr), and phenylalanine (Phe) within the Mg2+ groups, while the polarity in Na+ groups resembled that of the aqueous solution. The alteration in AAs microenvironmental distribution was supposed to indicate different protein corona formation modes [16], which would be discussed later.
Figure 2
Figure 2.
The fluorescence quenching spectra of BSA incubated with liposomes in (A) water solution, (B) NaCl solution, (C) Na2SO4 solution, (D) MgCl2 solution, and (E) MgSO4 solution. The maximum emission wavelength was around 342 nm. (F) The fluorescence intensity reduction in 280 nm of BSA in aqueous and ion pairs solutions. (G) The ∆wavelength of BSA in aqueous and ion pairs solutions. (H) The SDS-PAGE characterization and grayscale values. (I) BCA assay characterization of BSA adsorption percentage. Data are presented as mean ± SD (n = 3).
Based on the fluorescence spectrum, the quenching mode was studied using the Stern-Volmer equation. The Stern-Volmer plots for each group were illustrated (Fig. S7A in Supporting information), and the corresponding equation and Ksv summary were provided in Table 1. The typical fluorescence lifetime (τ) is approximately 10−8 s [17]. The Kq values of each group exceeded the maximum scattering collision constant of 2.0 × 10¹⁰ L mol−1 s−1, suggesting a static quenching mechanism for intrinsic fluorescence [18], confirming a “hard” protein corona preferred to form. The Scatchard plot was also studied (Fig. S7B in Supporting information) to determine the binding constant Kass and the number of binding sites n, as detailed in Table S1 (Supporting information). Ion pairs significantly increased values for both n and Kass, promoting BSA corona formation. Furthermore, in the presence of identical metal cations, the Stern-Volmer and Scatchard plots exhibited higher similarity in the fitted regression curve. The results of ion-facilitated protein-liposome interaction characterized by fluorescence spectra were further validated. The quantitative analysis of SDS-PAGE supported the cation-led enhancement at each maximum ion concentration (Fig. 2H). BCA analysis proved this result to be concentration-dependent, and Mg2+ exhibited a stronger effect overall (Fig. 2I).
The above results showed that metal cation types mainly decided BSA adsorption capacities and patterns. Negatively charged ions were believed to primarily stabilize the system by forming a pseudo-double layer outside the phospholipid membrane rather than actively participating in the interaction between BSA and liposomes [19,20]. As for the metal cations, the different influences of Na+ and Mg2+ stemmed from variations except for charge variations. On the one hand, the liposomes and BSA at pH 7.4 (experimental condition) were negatively charged (Fig. S8A in Supporting information). The predominant force is unlikely to be the adverse electrostatic repulsion. On the other hand, the electrostatic interaction between alkali metal cations and PC head was weak [21]. However, our fluorescence spectrum analysis suggested the formation of a stable “hard” protein corona, where weak electrostatic forces were unlikely to create a strong and lasting bond.
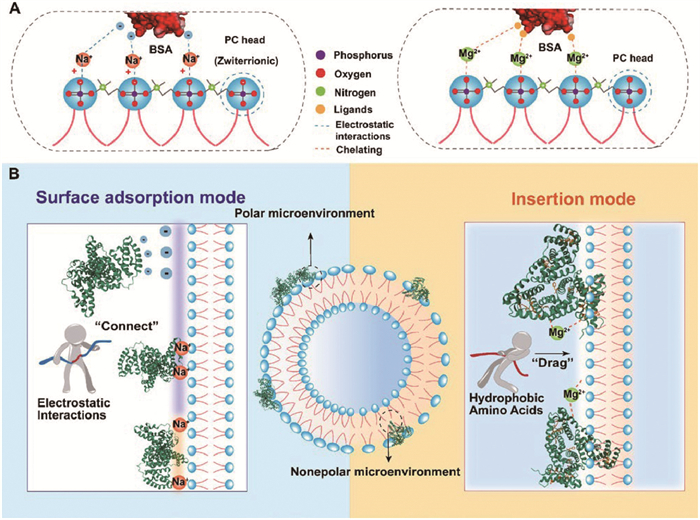
Inspired by the interaction mode in physiology, we hereby formulated two hypotheses for metal ion binding mechanisms (Fig. 3A): (1) Na+-mediated charge adsorption, and (2) Mg2+-mediated ligand chelation.
Figure 3
Figure 3.
(A) The mechanisms of metal-binding modes. (B) The mechanisms of protein corona formation.
Na+, a soft Lewis acid with difficulty forming stable coordination shells despite its theoretical capability of up to 8 ligands, often exhibits weak binding to biomolecules [22]. Na+ is supposed to follow the well-known charge adsorption mechanism. In short, based on electrostatic attraction, the negatively charged phosphatidylcholine (PC) portion of the lipid head in liposomes and the negatively charged AA residues on the surface of BSA provide adsorption sites for Na+. Then, the hydrogen bond network on the protein surface can rearrange from the “Na+-unbridged” state to the “Na+-bridged” state [23]. Thus, Na+ can “connect” the BSA and liposomes by electrostatic interactions.
Mg2+ can coordinate with six ligands, exhibiting a higher affinity than Na+ (≈102–105 L/mol) [16]. It is hypothesized that Mg2+ can coordinate and bind with liposomes and BSA to promote the interaction. On the one hand, the phosphate (PO43−) in the lipid head provides an oxygen ligand favored by Mg2+, which typically interacts with 1–2 PO43− groups [20,24]. The divalent metal ion was reported to bind to the liposome and tend to induce deprotonation of the PO43− [25], indicating the potential for Mg2+ to increase oxygen ligand content. On the other hand, BSA contains abundant oxygenated AAs, such as aspartic acid (Asp), glutamic acid (Glu), and serine (Ser) (Fig. S8B in Supporting information). Majorek et al. [26] identified three ligand binding sites on BSA occupied by Ca2+, which the mentioned AA provided: (ⅰ) Asp248, Glu251 and Glu243; (ⅱ) Asp13, Asp254 and Asp258; (ⅲ) Asp 107, Asp111 and Ser109. The same binding sites for Ca2+ are also likely for Mg2+, due to the similar charge yet larger radius [27].
The process of Mg2+ chelation could be specifically delineated as follows: Firstly, in the entropy-driven binding process between liposomes and BSA, the interaction provides the driving force and an effective binding site. Because in the absence of liposomes, Mg2+ does not significantly bind to BSA under the incubation conditions (room temperature (RT), 24 h), as demonstrated by Fig. S5 (minimal variation of BSA fluorescence quenching). When the complex is formed, subsequently, Mg2+ permeates the head region of the liposome and coordinates with Lewis base PO43− while simultaneously forming coordination bonds with oxygen-containing AA residues (Glu, Asp, Ser) of BSA. This resembles how Mg2+ functions in most ATPase-catalyzed processes in human physiology [28].
Furthermore, the polarity of the AAs microenvironment was changed. In the fluorescence spectrum, the maximum emission wavelength of the Mg2+ groups demonstrated a significant blue shift relative to that of the Na+ groups, indicating a substantial reduction in polarity. Combined with our previous research [48], it could be inferred that there were two protein corona formation modes in this case: surface adsorption mode (Na+) and insertion mode (Mg2+) (Fig. 3B). Noticeably, the AAs (Tyr, Trp, and Phe) are hydrophobic and primarily situated within the hydrophobic cavities of BSA. Specifically, BSA comprises two Trp residues: Trp-134 is situated near the surface, whereas Trp212 resides within an internal hydrophobic cavity, both positioned within nonpolar microenvironments (Fig. S8C in Supporting information). The exposure of these hydrophobic AAs is considered a significant potential factor that can result in different formation modes. In the classical charge adsorption induced by Na+, with minor conformational changes, BSA tends to bind to the polar surface of the liposome, where a bond affinity network formed by the binding water can stabilize the protein corona [29]. The Mg2+-mediated chelation mode relies more on specific binding sites, exerting greater pressure on AA residues and leading to evident conformational changes and exposure of internal hydrophobic AAs, which the following characterization would confirm. Subsequently, under the hydrophobic interactions, hydrophobic AA residues, unstable in a polar environment, “drag” the partial peptide chain into the liposome’s hydrophobic lipid bilayer. This led to, in the presence of Mg2+, a reduction in AA microenvironment polarity.
To further substantiate the proposed hypothesis, ultraviolet-visible (UV–vis) spectroscopy, circular dichroism (CD), and Fourier transform infrared spectroscopy (FTIR) techniques were used to evaluate the structural changes of BSA. Compared to aqueous solutions, the absorbance at 278 nm of BSA was significantly enhanced in ion pairs solutions (Figs. 4A–D), indicating increased exposure of the chromophore AAs. Under chelate insertion pressure, the peptide chain is more likely to undergo reorganization, and AAs experience increased compression. As expected, the Mg2+ groups showed the most prominent enhancement in absorbance (Fig. 4E). Additionally, the wavelength remained largely unchanged in the solution containing Na+, but a slight blue shift was observed in the Mg2+ groups (Fig. 4F), the latter one indicating an enhanced nonpolar microenvironment for the hydrophobic chromophore AAs. This further confirmed that differential exposure of hydrophobic AAs contributes to BSA’s distinct selectivity for the polar surface of liposomes and the hydrophobic lipid layer. Interestingly, in the presence of SO42−, absorbance decreased as concentration increased. It was reported that PO43−, which exhibited high chemical similarity to SO42−, could potentially compete with biomolecules for binding to nanoparticles [30,31]. These results suggested that while metal cations had a stronger impact on protein corona formation, certain oxygenated anions, serving as a stabilizing component of the system, may also directly participate in the interaction between liposomes and proteins.
Figure 4
Figure 4.
The UV–vis spectra of BSA incubated with liposomes in (A) NaCl solution, (B) Na2SO4 solution, (C) MgCl2 solution, and (D) MgSO4 solution. The absorbance peak for BSA was recorded at a wavelength of 278 nm. (E) The ∆Absorbance at 278 nm of BSA in different ion pairs solutions. (F) The ∆Wavelength of the characteristic absorption peak of BSA in different ion pairs solutions.
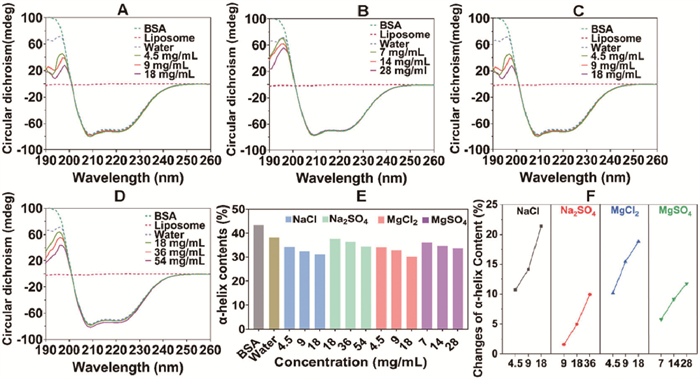
CD spectra further confirmed the differences in BSA conformation. As shown in Figs. 5A–D, the incubation with liposomes slightly reduced the α-helix level of BSA, revealed by a decrease in θ value at 190 nm and an increase in θ value at both 208 nm and 222 nm [32]. The specific proportion for the α-helix structure was summarized in Fig. 5E through the SELCON3 algorithm. Inorganic ion pairs further loosen α-helix (raw BSA 43.3%; BSA in water 38.3%, in NaCl 30.1%, in Na2SO4 34.5%, in MgCl2 31.1% and in MgSO4 33.8%), promoting its binding to liposomes due to the elongated peptide chain. Notably, compared with Na+, the Mg2+ groups exhibited a lower α-helix content and a more significant change range (Fig. 5F), aligning perfectly with our expectations.
Figure 5
Figure 5.
The CD spectra of BSA incubated with liposomes in (A) NaCl solution, (B) Na2SO4 solution, (C) MgCl2 solution, and (D) MgSO4 solution. The positive peak at 190 nm and the two negative peaks at 208 nm and 220 nm reflected the protein’s α-helix structure. (E) The α-helix structure percentage of BSA incubated with liposomes in aqueous and ion pairs solutions. (F) The change of BSA α-helix structure percentage in different ion pairs solutions.
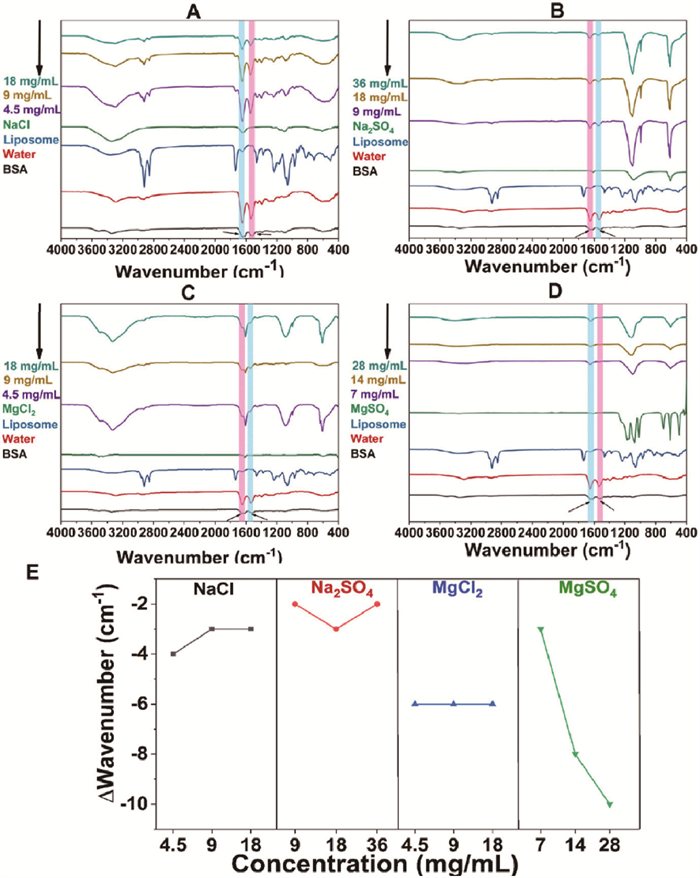
Finally, FTIR was used. BSA possesses an amide Ⅰ band between 1700 cm−1 and 1600 cm−1 and an amide Ⅱ band between 1600 cm−1 and 1500 cm−1 [33]. In Figs. 6A–D, BSA showed two characteristic peaks at 1651 and 1532 cm−1, corresponding to the amide Ⅰ and Ⅱ bands, respectively. No significant interference peaks in this range were observed for liposomes and the various ions. The characteristic peaks of the amide Ⅰ band were summarized in Fig. 6E. In each ion pairs solution, there was no discernible concentration-dependent shift. However, the Mg2+ groups showed a greater shift than the Na+ groups, consistent with UV–vis and CD characterization. Noticeably, significant differences in amide peak shape and intensity changes were observed in the Mg2+ groups. According to our chelation insertion mechanism hypothesis, a portion of BSA’s structure may be inserted into liposomes’ hydrophobic lipid layer, potentially leading to wrapping and concealment of AA residues or partial peptide chain structures.
Figure 6
Figure 6.
The FTIR spectra of BSA incubated with liposomes in (A) NaCl solution, (B) Na2SO4 solution (C) MgCl2 solution, and (D) MgSO4 solution. The black arrow indicated the amide Ⅰ band (1700–1600 cm−1) and an amide Ⅱ band (1600–1500 cm−1). (E) The ∆wavelength of the BSA amide Ⅰ band in different ion pairs solutions.
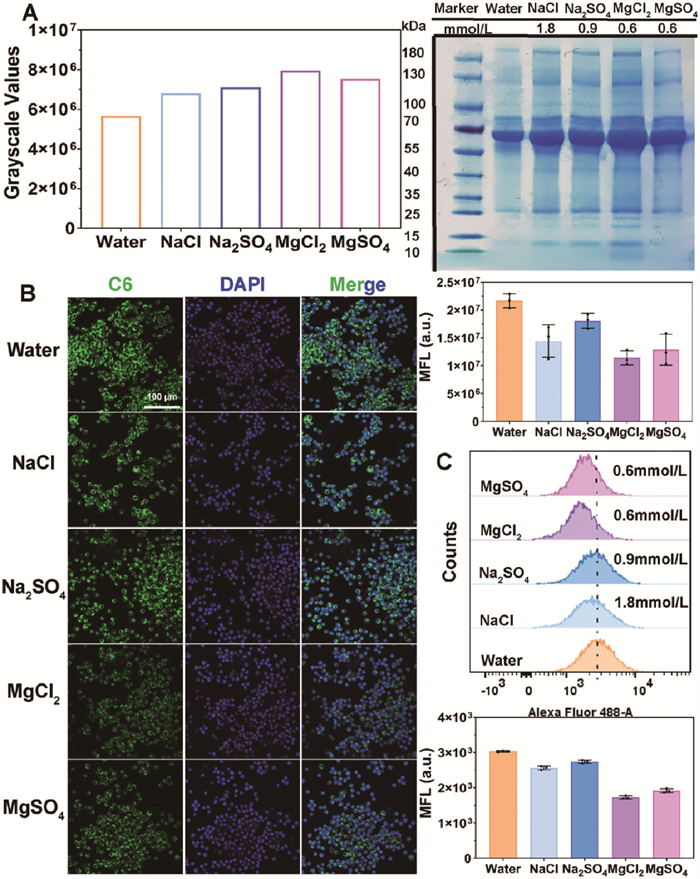
After verifying the rationality of the model construction, we explored how ions affect the interaction between liposomes and cells through protein corona formation as a proof-of-concept. Cell uptake, a necessary pathway for nanoparticle internalization, and RAW264.7, which performs immune surveillance functions, were selected. Four ion pair concentrations were set based on the 0.6 mmol/L Mg2+ (in vivo plasma concentration) [34], and Na+ at 1.8 mmol/L under the same ionic strength. SDS-PAGE was used to study the protein adsorption on liposomes incubated with 10% fetal bovine serum (FBS) in the presence of different ion pairs (Fig. 7A). Consistent with the results when incubated with BSA, the cation concentration dominated the adsorption difference. Compared to Na+, Mg2+ at a lower concentration maintained its dominant effect. Under the same incubation conditions, the uptake efficiency of RAW264.7 for liposomes with protein corona was further characterized by confocal laser scanning microscope (CLSM) and flow cytometry (FCM) (Figs. 7B and C). With the increase in FBS adsorption, the uptake of liposomes by RAW264.7 decreased. This might result from protein adsorption increasing the hydrophilicity of the liposome surface and interfering with the receptor-protein coupling on the cell membrane surface [35]. This was consistent with the previous report that macrophage uptake of liposomes grafted with proteins decreased [36]. The results of cell uptake initially reveal that trace amounts of ions could change the interaction between nanoparticles and cells, and further comprehensive experiments are of great significance.
Figure 7
Figure 7.
(A) The SDS-PAGE characterization and grayscale values of liposomes incubated with 10% FBS under different ion pair concentrations. (B) The CLSM image of RAW264.7 uptake and the semi-quantitative analysis conducted by Image J (the first image on the right of the CLSM image) (n = 3). Scale bar: 100 µm. (C) The quantitative analysis of RAW264.7 uptake efficiency conducted by FCM (the last two images on the right column). Data are presented as mean ± SD (n = 3).
In summary, this study investigated the impact of four physiological inorganic ion pairs (NaCl, Na2SO4, MgCl2, and MgSO4) on protein adsorption onto liposomes. The various indicators were systematically evaluated to explore the underlying common laws. Eventually, we arrived at the cognition that cations in ion pairs assumed a dominant role and further constructed the corresponding model theory. Based on the cations’ differing coordination abilities, charge adsorption and chelation insertion modes were proposed as the binding and protein corona formation mechanisms for Na+ and Mg2+, aligning well with our experimental results. In the Mg2+-mediated chelation insertion mode, lipid bilayer instability from BSA insertion led to an increased population of moderately aggregated particles detected by us. The Na+-mediated charge adsorption mode resulted in a rise in micron-sized aggregated particles due to reduced surface electrostatic repulsion. Additionally, spectroscopic analyses revealed that Mg2+ promoted a more extended conformation of BSA’s peptide chain, enhancing the exposure of hydrophobic aromatic AAs and creating a more nonpolar microenvironment around them. These phenomena can be attributed to the greater spatial structural requirements of Mg2+ for specific ligand binding sites and a segment of the BSA peptide chain inserted into the hydrophobic lipid bilayer. When liposomes generate complex effects upon entering the body, these model theories constructed based on definite elements are anticipated to facilitate the comprehension of the complex network from simplicity to complexity.
Declaration of competing interest
The authors declare that they have no known competing financial interests or personal relationships that could have appeared to influence the work reported in this paper.
This work was financially supported by the National Natural Science Foundation of China (No. 82373800), Guangdong Basic and Applied Basic Research Foundation (No. 2024A1515011236), and Continuation" Project of Excellent Doctors, Guangzhou Basic and Applied Basic Research Foundation (No. 2025A04J5082).
Supplementary materials
Supplementary material associated with this article can be found, in the online version, at doi:10.1016/j.cclet.2025.111014.
[1]
B. Kharazian, N.L. Hadipour, M.R. Ejtehadi, Int. J. Biochem. Cell Biol. 75 (2016) 162–174. doi: 10.1016/j.biocel.2016.02.008
[2]
F. Fu, D. Crespy, K. Landfester, S. Jiang, Chem. Soc. Rev. 53 (2024) 10827–10851. doi: 10.1039/d4cs00507d
[3]
M.P. Monopoli, C. Aberg, A. Salvati, K.A. Dawson, Nat. Nanotechnol. 7 (2012) 779–786. doi: 10.1038/nnano.2012.207
[4]
I. Kuschnerus, K. Giri, J. Ruan, et al., J. Colloid Interface Sci. 612 (2022) 467–478. doi: 10.1016/j.jcis.2021.12.161
K.A. Majorek, P.J. Porebski, A. Dayal, et al., Mol. Immunol. 52 (2012) 174–182. doi: 10.1016/j.molimm.2012.05.011
[27]
S. Tang, J.J. Yang, Magnesium binding sites in proteins, in: R.H. Kretsinger, V.N. Uversky, E.A. Permyakov (Eds.), Encyclopedia of Metalloproteins, Springer, New York, 2013, pp. 1243–1250.
Figure 1
The hydrodynamic diameter (column) and PDI (line) of liposomes (Lipo) incubated with BSA in (A) NaCl solution, (B) Na2SO4 solution (C) MgCl2 solution, and (D) MgSO4 solution. The light intensity distribution of liposomes incubated with BSA in (E) NaCl solution, (F) Na2SO4 solution, (G) MgCl2 solution, and (H) MgSO4 solution. Three main particle populations were defined: (ⅰ) <300 nm, well-dispersed particles, (ⅱ) 300–1000 nm, moderate aggregate particles, and (ⅲ) >1000 nm, strong aggregate particles. And the zeta potential of liposomes incubated with (I) NaCl, (J) Na2SO4, (K) MgCl2, and (L) MgSO4. Data are presented as mean ± standard deviation (SD) (n = 3).
Figure 2
The fluorescence quenching spectra of BSA incubated with liposomes in (A) water solution, (B) NaCl solution, (C) Na2SO4 solution, (D) MgCl2 solution, and (E) MgSO4 solution. The maximum emission wavelength was around 342 nm. (F) The fluorescence intensity reduction in 280 nm of BSA in aqueous and ion pairs solutions. (G) The ∆wavelength of BSA in aqueous and ion pairs solutions. (H) The SDS-PAGE characterization and grayscale values. (I) BCA assay characterization of BSA adsorption percentage. Data are presented as mean ± SD (n = 3).
Figure 4
The UV–vis spectra of BSA incubated with liposomes in (A) NaCl solution, (B) Na2SO4 solution, (C) MgCl2 solution, and (D) MgSO4 solution. The absorbance peak for BSA was recorded at a wavelength of 278 nm. (E) The ∆Absorbance at 278 nm of BSA in different ion pairs solutions. (F) The ∆Wavelength of the characteristic absorption peak of BSA in different ion pairs solutions.
Figure 5
The CD spectra of BSA incubated with liposomes in (A) NaCl solution, (B) Na2SO4 solution, (C) MgCl2 solution, and (D) MgSO4 solution. The positive peak at 190 nm and the two negative peaks at 208 nm and 220 nm reflected the protein’s α-helix structure. (E) The α-helix structure percentage of BSA incubated with liposomes in aqueous and ion pairs solutions. (F) The change of BSA α-helix structure percentage in different ion pairs solutions.
Figure 6
The FTIR spectra of BSA incubated with liposomes in (A) NaCl solution, (B) Na2SO4 solution (C) MgCl2 solution, and (D) MgSO4 solution. The black arrow indicated the amide Ⅰ band (1700–1600 cm−1) and an amide Ⅱ band (1600–1500 cm−1). (E) The ∆wavelength of the BSA amide Ⅰ band in different ion pairs solutions.
Figure 7
(A) The SDS-PAGE characterization and grayscale values of liposomes incubated with 10% FBS under different ion pair concentrations. (B) The CLSM image of RAW264.7 uptake and the semi-quantitative analysis conducted by Image J (the first image on the right of the CLSM image) (n = 3). Scale bar: 100 µm. (C) The quantitative analysis of RAW264.7 uptake efficiency conducted by FCM (the last two images on the right column). Data are presented as mean ± SD (n = 3).

 DownLoad:


 下载:
下载:


