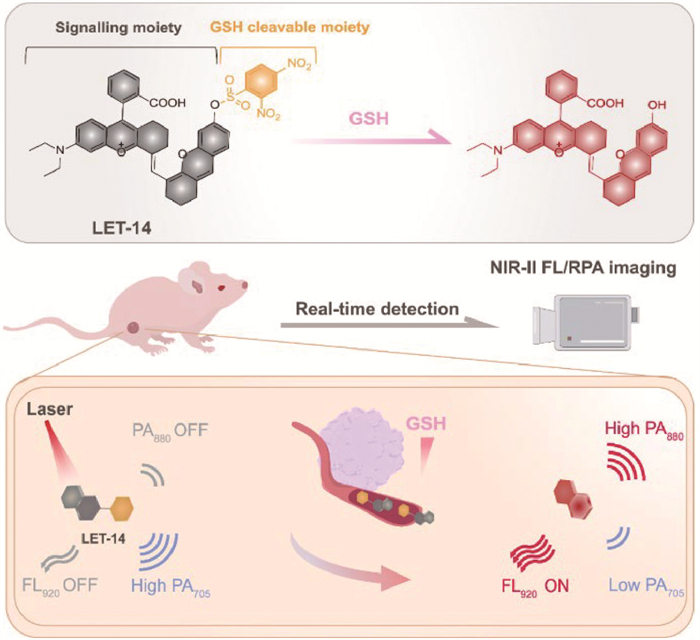
Scheme 1.
Schematic illustration of an activatable NIR-Ⅱ FL and RPA dual-modality probe (LET-14) for in vivo GSH imaging.
In vivo second near-infrared fluorescence and ratiometric photoacoustic dual-modality imaging of glutathione
Yu Zhang , Shan Lei , Yuantao Pan , Chao Zhao , Qiang Liu , Yumeng Wu , Yurong Liu , Meng Li , Peng Huang , Jing Lin

Glutathione (GSH), a tripeptide thiol, assumes a pivotal position in sustaining cellular redox homeostasis and safeguarding cells against oxidative stress [1]. The level of GSH is significantly associated with numerous pathological processes, including cancers, Alzheimer’s disease, neurodegenerative disorders and a plethora of other diseases [2-5]. GSH is regarded as an important biomolecule for diagnosis of various diseases. For instance, the GSH content in tumor tissues is no less than fourfold higher compared to that in normal tissues [6-9]. Consequently, real-time detection of GSH levels is important for the early diagnosis of GSH-associated diseases, especially for cancers.
Currently, visualization of in vivo GSH is based on fluorescence (FL) probes in visible or first near-infrared (NIR-Ⅰ) window [10-20]. However, FL imaging in these windows is circumscribed by factors like insufficient tissue penetration depth and photon scattering, which conspicuously hinders its employment in highly sensitive imaging of GSH in vivo. Noticeably, FL imaging in second NIR (NIR-Ⅱ) window possesses the capability to markedly alleviate the impact of light scattering phenomena and autofluorescence effects, thereby allowing for deeper tissue penetration depths and enhanced spatial resolution [21-28]. The advancement of NIR-Ⅱ FL probe for in vivo GSH imaging is a hotspot [23,29]. Nonetheless, single imaging modality usually suffers deficient accuracy or quantification [30-33]. On account of this, photoacoustic (PA) imaging serves as a robust complement to NIR-Ⅱ FL imaging for the detection of GSH, offering more comprehensive and precise detection outcomes. The PA imaging offers exceptional deep tissue penetration, reaching depths of several centimeters, along with high 3-dimensional (3D) spatial resolution imaging capabilities for living subjects. However, to date, the applications of most reported PA probes for GSH detection have been significantly constrained by various endogenous biomolecules. Furthermore, this type of probes was dependent on the single-channel signal variation of PA imaging and was prone to the influence of multiple environmental factors, for instance, microenvironmental disparities and diverse photobleaching rates [34,35]. By contrast, the ratiometric photoacoustic (RPA) probe effectively surmounts the numerous constraints of single-channel imaging probes through the introduction of self-calibration properties, thereby enabling more accurate detection of GSH [36-43]. Taken together, the development of NIR-Ⅱ FL/RPA imaging with self-calibration capabilities is urgently required for the accurate diagnosis of GSH in vivo.
Herein, we developed in vivo NIR-Ⅱ FL/RPA dual-modality imaging of GSH using a GSH-activatable probe (denoted as LET-14) (Scheme 1). LET-14 consisted of a rhodamine hybrid xanthene skeleton bridged with a shielding 2,4-dinitrobenzene sulfonyl (DNBS) group, which could be specifically cleaved by GSH, resulting in a markedly bathochromic-shift absorption, a 6.5-fold increase in NIR-Ⅱ FL intensity (FL920) and a 13-fold increase in RPA signal (PA880/PA705). In vitro and in vivo experiments demonstrated that LET-14 could selectively and sensitively identify GSH using NIR-Ⅱ FL/RPA dual-modality imaging, which is a promising diagnostic tool.
LET-14 was synthesized by an aldol condensation reaction of rhodamine-type fluorophore with xanthene derivative (Fig. S1 in Supporting information). The structures of LET-14 and intermediates have been characterized by nuclear magnetic resonance (NMR) and electrospray ionization mass spectra (ESI-MS) (Figs. S2–S10 in Supporting information). LET-14 is ensconced in a "fluorescence caged" status, due to the shielding impact of DNBS on the intramolecular charge transfer (ICT) process. In the presence of GSH, a thiol-promoted cleavage reaction takes place between GSH and DNBS, leading to the liberation of LET-14 from the caged moiety, thereby simultaneously turning on the NIR-Ⅱ FL and RPA signals for imaging of GSH (Scheme 1). The mechanism of the cleavage reaction between LET-14 and GSH was further validated by time-dependent 1H NMR and ESI-MS (Figs. S11 and S12 in Supporting information).
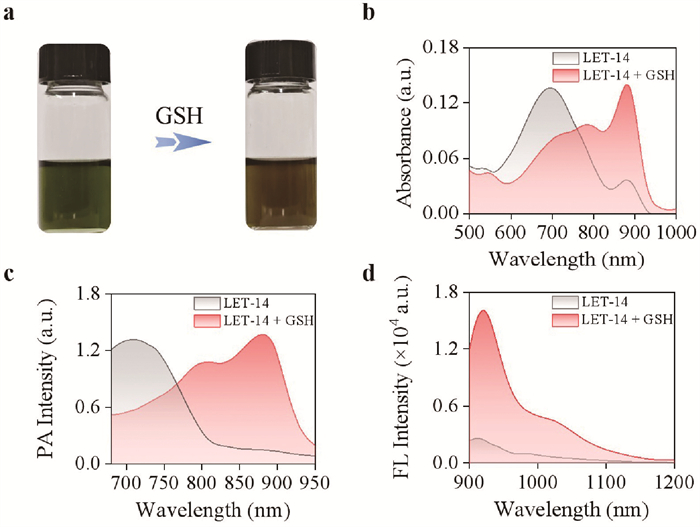
The photophysical properties of LET-14 were tested before and after addition of GSH. After incubating with GSH (50 µmol/L) for 30 min, the LET-14 (10 µmol/L) showed a noticeable color change from green to brown, visible by the naked eye (Fig. 1a). At the same time, the absorption band of LET-14 manifested red-shift ranging from 695 (Abs695) to 880 nm (Abs880) (Fig. 1b). The properties of the ultraviolet-visible-near infrared (UV–vis-NIR) absorption spectroscopy impelled us to further explore its PA property. As shown in Fig. 1c, upon the addition of GSH, the PA signal shifted from 705 nm to 880 nm, and this change was in accordance with the results of the UV–vis-NIR absorption spectra. Concurrently, a significant enhancement of NIR-Ⅱ FL emission at 920 nm (FL920) was observed after incubation with GSH (Fig. 1d), which demonstrated that LET-14 exhibited an excellent response to GSH.
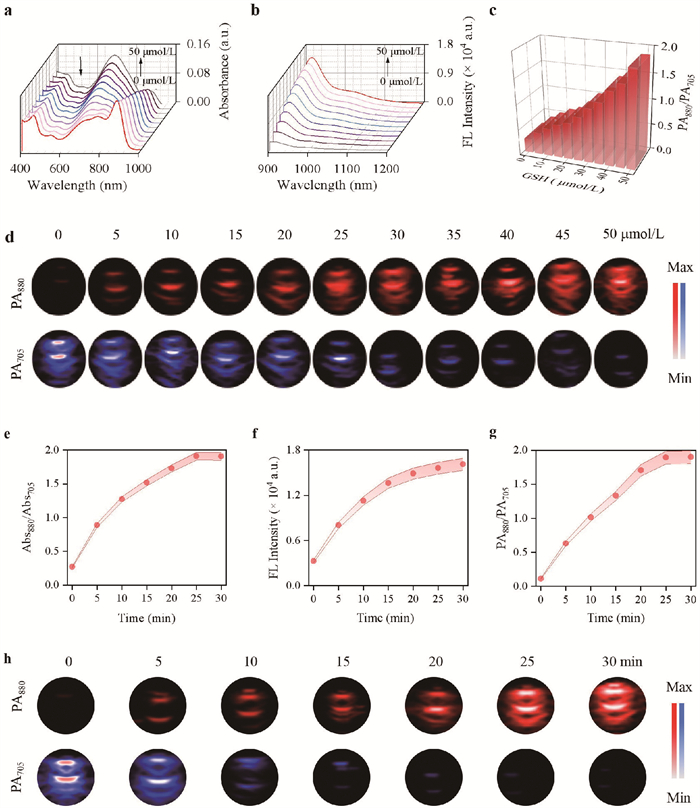
Next, the concentration and response time-dependent spectral variations were demonstrated for the assessment of sensitivity of LET-14 to GSH. The Abs880 intensity of LET-14 exhibited a gradual increase, while that of the Abs695 demonstrated a decrease as various concentrations of GSH addition (0–50 µmol/L) (Fig. 2a). The FL920 intensity gradually intensified and reached its peak value at 50 µmol/L, with a nearly 6.5-fold signal enhancement (Fig. 2b). Furthermore, a significant linear correlation (R2 = 0.9958) was observed between the FL920 intensity and GSH concentration (Fig. S13 in Supporting information), and the detection limit was ascertained to be 0.32 µmol/L. Inspired by the property of the absorption spectrum in the response process between LET-14 and GSH, the PA signal of LET-14 to GSH was also examined. After addition of GSH, the PA880 signal exhibited significant enhancement, whereas PA705 signal was decreased, thus the signal ratio of PA880/PA705 received a 13-fold increase (Figs. 2c and d). The above results indicated that LET-14 could detect GSH using both FL and RPA imaging. Besides, the kinetics reaction of LET-14 with GSH was investigated. Upon the addition of GSH (50 µmol/L) to LET-14 (10 µmol/L), the Abs880/Abs695 ratio displayed a gradual increment over time, attaining a plateau approximately 30 min (Fig. 2e and Fig. S14a in Supporting information). The FL920 displayed a similar trend (Fig. 2f and Fig. S14b in Supporting information). Additionally, the ratio of PA880/PA705 increased gradually over time, peaked within 30 min, and remained stable thereafter (Figs. 2g and h).
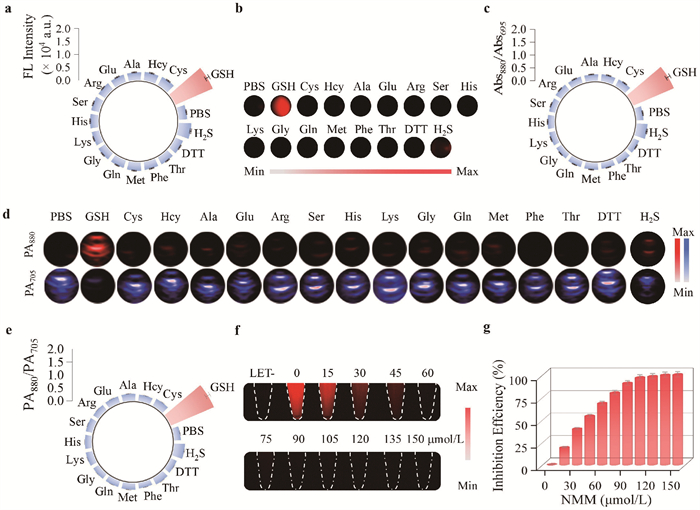
To assess specific response of LET-14 to GSH, we evaluated the reactivity of LET-14 with a variety of biological substances, including L-cysteine (Cys), L-homocysteine (Hcy), L-alanine (Ala), L-glutamic acid (Glu), L-arginine (Arg), L-serine (Ser), L-histidine(His), L-lysine hydrate (Lys), glycine (Gly), L-glutamine (GIn), L-methionine (Met), L-phenylalanine (Phe), L-threonine (Thr), L-dithiothreitol (DTT), hydrogen sulfide (H2S). As shown in Fig. 3a, GSH was the only species that induced a significant alteration in FL920 signal, whereas the other species scarcely brought about any alterations in FL emission of LET-14, which was in line with the outcomes of NIR-Ⅱ FL images (Fig. 3b). Meanwhile, upon the addition of GSH, a significant alteration in the ratios of Abs880/Abs695 (Fig. 3c) and PA880/PA705 (Figs. 3d and e) was observed in LET-14, whereas negligible variation in other substances. It is noteworthy that stability is one of the crucial indicators for assessing the quality of FL probes. LET-14 exhibited excellent chemical stability in the presence of reactive oxygen and nitrogen species (RONS), such as H2O2 and ONOO− (Fig. S15 in Supporting information). Additionally, GSH inhibition study was demonstrated by pretreatment with an inhibitor, N-methylmaleimide (NMM). As increase of NMM concentration, the inhibition efficiency of LET-14 by GSH was significantly increased, and reached to 100% at 150 µmol/L of NMM (Figs. 3f and g). These results demonstrated that LET-14 exhibited high selectivity and rapid responsiveness toward GSH.
After validating the outstanding FL and PA properties of LET-14 for detection of GSH, we conducted a systematic investigation into the biocompatibility for in vitro imaging. First, the biocompatibility of LET-14 was investigated on normal cell line (HEK293T cell) and mouse breast cancer cell line (4T1 cell). After 24 h of incubation with various concentrations of LET-14 (0–40 µmol/L), all cell viabilities were over 90%, indicating its good biocompatibility (Figs. 4a and b). Subsequently, cell imaging experiments were conducted by NIR-Ⅱ FL/PA imaging system (Fig. 4c). When 4T1 cells were incubated with LET-14, the NIR-Ⅱ FL signal of cells gradually intensified over time, ultimately reaching a stable state within 2 h. This observation suggested that LET-14 could be efficiently taken up by 4T1 cells and then triggered by endogenous GSH to generate NIR-Ⅱ FL signals in a time-dependent manner (Figs. 4d and e). By contrast, the NIR-Ⅱ FL intensity of the cells in NMM-pretreated group remained at a low level, owing to the suppressive impact of NMM on GSH activity. Meanwhile, the PA705 intensity of cells gradually decreased over time, while that of PA880 gradually increased, and finally RPA reached relative stability within 2 h, which was notably higher than that of NMM-pretreated 4T1 cells (2.2-fold) (Figs. 4f and g). These results indicated that LET-14 could be used to monitor intracellular GSH levels through NIR-Ⅱ FL and RPA dual-modality imaging.

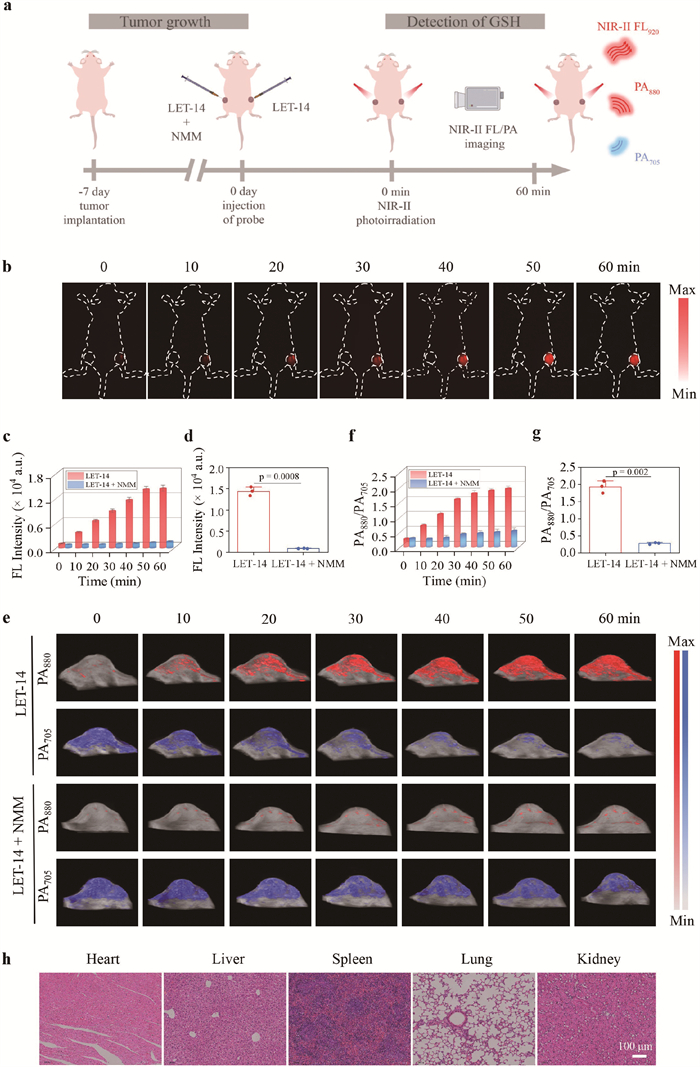
Finally, we further employed LET-14 for NIR-Ⅱ FL/RPA imaging of GSH in bilateral 4T1 tumor-bearing nude mice (Fig. 5a). All of the in vivo experiments were conducted in consistence with the approved protocol of Animal Ethics and Welfare Committee of Shenzhen University (AEWC-SZU). NMM was injected into the left tumor tissue, then LET-14 (0.5 mmol/L, 20 µL) was administered into the tumor tissues on both sides. The NIR-Ⅱ FL intensity of the tumor (right side) gradually augmented (Fig. 5b), reaching the maximum intensity within 1 h (Fig. 5c), exhibiting an 8-fold enhancement when compared to tumor (left side) pretreated with NMM (Fig. 5d). As shown in Fig. 5e, upon injection of LET-14 into tumor tissues, the PA705 exhibited a relatively strong intensity, whereas the PA880 was comparatively weak. Interestingly, with the extension of time, the PA705 gradually diminished and PA880 gradually intensified, ultimately generating a strong RPA signal within 1 h, which was 2.5-fold higher than that of tumor (left side) pretreated with NMM (Figs. 5f and g). Taken together, these results demonstrated LET-14 with high sensitivity for GSH detection in vivo through NIR-Ⅱ FL and RPA dual-modality imaging. Furthermore, the biocompatibility of LET-14 was also evaluated in vivo. As shown in Fig. 5h, the hematoxylin and eosin (H&E) stained images of major organs (heart, liver, spleen, lung, kidneys) showed no distinct organ damage or inflammation after LET-14 treatment for 14 days, indicating its good biocompatibility.
In summary, we have developed a GSH-activatable dual-modality probe (LET-14) that integrated NIR-Ⅱ FL and RPA imaging abilities for in vivo GSH detection. Experimental results demonstrated that LET-14 can be specifically and sensitively activated by GSH, leading to significant enhancement of NIR-Ⅱ FL and RPA signals, being capable of effectively differentiating between GSH and closely related biothiols like Cys and Hcy. Importantly, LET-14 showed good biocompatibility and achieved accurate and reliable in vivo GSH monitoring by leveraging the complementary advantages of NIR-Ⅱ FL/PA dual-modality imaging. Taken together, LET-14 showed substantial potential for in vivo detection of GSH-related diseases.
The authors declare that they have no known competing financial interests or personal relationships that could have appeared to influence the work reported in this paper.
Yu Zhang: Writing – original draft, Methodology, Investigation, Data curation. Shan Lei: Writing – review & editing, Formal analysis. Yuantao Pan: Investigation, Data curation. Chao Zhao: Writing – original draft, Data curation. Qiang Liu: Data curation. Yumeng Wu: Data curation. Yurong Liu: Data curation. Meng Li: Data curation. Peng Huang: Writing – review & editing. Jing Lin: Writing – review & editing, Supervision, Funding acquisition, Conceptualization.
This work was financially supported by the National Natural Science Foundation of China (Nos. 82372116, U23A2097), Guangdong Basic and Applied Basic Research Foundation (No. 2022A1515010620), Shenzhen Medical Research Fund (Nos. B2302047, A2302047), and Shenzhen Science and Technology Program (No. JCYJ20220818095806014) and Research Team Cultivation Program of Shenzhen University (No. 2023QNT019). The authors thank instrumental Analysis Center of Shenzhen University.
Supplementary material associated with this article can be found, in the online version, at doi:
K. Umezawa, M. Yoshida, M. Kamiya, T. Yamasoba, Y. Urano, Nat. Chem. 9 (2017) 279–286. doi: 10.1038/nchem.2648
J. Zhou, P. Jangili, S. Son, et al., Adv. Mater. 32 (2020) 2001945. doi: 10.1002/adma.202001945
Y. Xiong, C. Xiao, Z. Li, X. Yang, Chem. Soc. Rev. 50 (2021) 6013–6041. doi: 10.1039/d0cs00718h
B.D. Paul, Front. Aging Neurosci. 13 (2021) 659402. doi: 10.3389/fnagi.2021.659402
Y. Wang, H. Yan, Y. Yue, et al., Chem. Eng. J. 464 (2023) 142496. doi: 10.1016/j.cej.2023.142496
H. Fan, Z. Guo, Coordin. Chem. Rev. 480 (2023) 215027. doi: 10.1016/j.ccr.2023.215027
G.K. Balendiran, R. Dabur, D. Fraser, Cell Biochem. Funct. 22 (2004) 343–352. doi: 10.1002/cbf.1149
M.P. Gamcsik, M.S. Kasibhatla, S.D. Teeter, O.M. Colvin, Biomarkers 17 (2012) 671–691. doi: 10.3109/1354750X.2012.715672
B. Niu, K. Liao, Y. Zhou, et al., Biomaterials 277 (2021) 671–691. doi: 10.1080/10410236.2020.1712034
X. Jiang, J. Chen, A. Bajic, et al., Nat. Chem. 8 (2017) 16163.
S. Lee, J. Li, X. Zhou, J. Yin, J. Yoon, Coordin. Chem. Rev. 366 (2018) 29–68. doi: 10.1016/j.ccr.2018.03.021
S. Mo, X. Zhang, S. Hameed, Y. Zhou, Z. Dai, Theranostics 10 (2020) 2130–2140. doi: 10.7150/thno.39673
Q. Wu, W. Li, J. Zhao, et al., Biomed. Pharmacother. 137 (2021) 111308. doi: 10.1016/j.biopha.2021.111308
Y. Hu, Y. Wang, X. Wen, et al., Research 2020 (2020) 4087069.
N. Li, T. Wang, N. Wang, M. Fan, X. Cui, Angew. Chem. Int. Ed. 62 (2023) e202217326. doi: 10.1002/anie.202217326
Y. Zhang, Y. Zhang, Y. Yue, et al., Chin. Chem. Lett. 32 (2021) 2873–2876. doi: 10.1016/j.cclet.2021.05.016
W. Liu, J. Chen, Q. Qiao, X. Liu, Z. Xu, Chin. Chem. Lett. 33 (2022) 4943–4947. doi: 10.1016/j.cclet.2022.03.121
F. Wang, Y. Liu, B. Wang, et al., Dyes Pigm. 152 (2018) 29–35. doi: 10.1016/j.dyepig.2018.01.023
M. Tian, X. Liu, H. He, et al., Anal. Chem. 92 (2020) 10068–10075. doi: 10.1021/acs.analchem.0c01881
M. Tian, Y. Liu, F. Jiang, Anal. Chem. 92 (2020) 14285–14291. doi: 10.1021/acs.analchem.0c03418
Y. Su, B. Yu, S. Wang, H. Cong, Y. Shen, Biomaterials 271 (2021) 120717. doi: 10.1016/j.biomaterials.2021.120717
Y. Pan, S. Lei, J. Zhang, et al., Anal. Chem. 93 (2021) 17103–17109. doi: 10.1021/acs.analchem.1c04504
Y. Zhang, J. Fang, S. Ye, et al., Nat. Commun. 13 (2022) 1685. doi: 10.1007/s42765-022-00213-z
S. Lei, F. Zhao, J. Zhang, et al., Anal. Chem. 94 (2022) 8399–8408. doi: 10.1021/acs.analchem.2c00929
F. Zhao, X. Zhang, F. Bai, et al., Adv. Mater. 35 (2023) 2208097. doi: 10.1002/adma.202208097
Y. Guo, Z. Li, B. Guo, B. Wang, Y. Tu, Nano Biomed. Eng. 16 (2024) 135–151. doi: 10.26599/nbe.2024.9290061
Q. Lan, P. Yu, K. Yan, et al., J. Am. Chem. Soc. 144 (2022) 21010–21015. doi: 10.1021/jacs.2c10041
X. Zhang, Y. Chen, H. He, et al., Angew. Chem. Int. Ed. 60 (2021) 26337–26341. doi: 10.1002/anie.202109728
S. Bi, X. Wen, G. Sun, S. Zeng, Nano Today 53 (2023) 102027. doi: 10.1016/j.nantod.2023.102027
L. Nie, X. Chen, Chem. Soc. Rev. 43 (2014) 7132–7170. doi: 10.1039/C4CS00086B
X. Li, J. Kim, J. Yoon, X. Chen, Adv. Mater. 29 (2017) 1606854.
Y. Liu, L. Teng, B. Yin, et al., Chem. Rev. 122 (2022) 6850–6918. doi: 10.1021/acs.chemrev.1c00875
E.Y. Zhou, H.J. Knox, C.J. Reinhardt, et al., J. Am. Chem. Soc. 140 (2018) 11686–11697. doi: 10.1021/jacs.8b05514
Y. Cui, X. Wang, Z. Jiang, et al., Angew. Chem. Int. Ed. 135 (2023) e202214505. doi: 10.1002/ange.202214505
C. Moore, Y. Cheng, N. Tjokro, et al., Angew. Chem. Int. Ed. 61 (2022) e202201843. doi: 10.1002/anie.202201843
Q. Fu, R. Zhu, J. Song, H. Yang, X. Chen, Adv. Mater. 31 (2019) 1805875. doi: 10.1002/adma.201805875
X. Gao, G. Ma, C. Jiang, et al., Anal. Chem. 91 (2019) 7112–7117. doi: 10.1021/acs.analchem.9b00109
L. Yin, H. Sun, H. Zhang, et al., J. Am. Chem. Soc. 141 (2019) 3265–3273. doi: 10.1021/jacs.8b13628
L. Wu, Y. Ishigaki, W. Zeng, et al., Nat. Commun. 12 (2021) 6145. doi: 10.1038/s41467-021-26380-y
Z. Zeng, S.S. Liew, X. Wei, K. Pu, Angew. Chem. Int. Ed. 60 (2021) 26454–26475. doi: 10.1002/anie.202107877
Y. Ma, L. Xu, B. Yin, et al., Nano Lett. 21 (2021) 4484–4493. doi: 10.1021/acs.nanolett.1c01359
X. Zhang, K. Jiang, S. Jiang, et al., Anal. Chem. 94 (2022) 13770–13776. doi: 10.1021/acs.analchem.2c02153
Y. Zhang, S. He, C. Xu, et al., Angew. Chem. Int. Ed. 61 (2022) e202203184. doi: 10.1002/anie.202203184

Scheme 1 Schematic illustration of an activatable NIR-Ⅱ FL and RPA dual-modality probe (LET-14) for in vivo GSH imaging.

Figure 1 (a) Color change of LET-14 towards GSH. (b) UV–vis-NIR absorption, (c) PA spectra, and (d) NIR-Ⅱ FL (λex = 880 nm) of LET-14 (10 µmol/L) after incubation with/without GSH (50 µmol/L) for 30 min in dimethyl sulfoxide (DMSO)/phosphate buffered saline (PBS) (v/v = 2/3, pH 7.4).

Figure 2 (a) UV–vis-NIR absorption, (b) NIR-Ⅱ FL spectra (λex = 880 nm), (c) the ratio of PA880/PA705 intensity and (d) the corresponding PA images of LET-14 (10 µmol/L) with the addition of GSH (0–50 µmol/L) for 30 min in DMSO/PBS (v/v = 2/3, pH 7.4). Time-dependent (e) Abs880/Abs695 intensity, (f) NIR-Ⅱ FL920 intensity (λex = 880 nm), (g) PA880/PA705 intensity and (h) the corresponding PA images of LET-14 after incubation with GSH (50 µmol/L) for 30 min in DMSO/PBS (v/v = 2/3, pH 7.4).

Figure 3 (a) NIR-Ⅱ FL920 intensity, (b) NIR-Ⅱ FL images, (c) Abs880/Abs695, (d) PA880/PA705 ratio and (e) the corresponding PA images of LET-14 (10 µmol/L) after incubation with various amino acids and hydrogen sulfide for 30 min in DMSO/PBS (v/v = 2/3, pH 7.4). (f) NIR-Ⅱ FL images of LET-14 (10 µmol/L) with the addition of GSH (50 µmol/L) before incubation with different concentrations of NMM (0-150 µmol/L). (g) The corresponding NIR-Ⅱ FL920 inhibition efficiency. Data are presented as mean ± standard deviation (SD) (n = 3).

Figure 4 Cell viability estimated by MTT assay with HEK293T (a) and 4T1 (b) cells, which were cultured in the presence of LET-14 (0–40 µmol/L) for 24 h. (c) Schematic representation of NIR-Ⅱ FL and RPA imaging for 4T1 cells. (d) Time-dependent NIR-Ⅱ FL images of 4T1 cells with/without NMM pretreatment (0.5 mmol/L), respectively, then addition of LET-14 and (e) the corresponding quantitative FL intensity in (d). (f) Time-dependent PA images of 4T1 cells with/without NMM pretreatment (0.5 mmol/L), respectively, then addition of LET-14 and (g) the corresponding quantitative RPA intensity in (f). Data are presented as mean ± SD (n = 3).

Figure 5 (a) Schematic representation of NIR-Ⅱ FL and RPA imaging for 4T1 tumors. (b) Time-dependent NIR-Ⅱ FL images of 4T1 tumor-bearing nude mice with or without NMM (1 mmol/L, 50 µL), respectively, then injection of LET-14. (c) The relative FL intensity of tumors collected from (b). (d) Quantification of FL intensity of tumors at 60 min (P = 0.0008). (e) In vivo PA images of 4T1 tumor-bearing nude mice. (f) RPA signal of PA880/PA705 measured as a function of post-injection time. (g) Quantification of RPA signals of tumors at 60 min (P = 0.002). (h) H&E stained images of major organs (heart, liver, spleen, lung, and kidney) were obtained from mice 14 days post-injection of LET-14 (scale bar: 100 µm). Data are presented as mean ± SD (n = 3).

 扫一扫看文章

扫一扫关注我们
 DownLoad:
 下载:
下载: