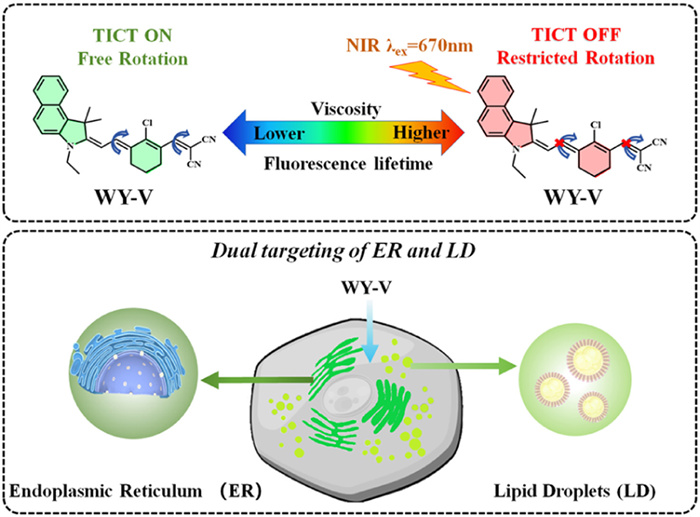
Scheme 1.
(A) Chemical structure and fluorescence lifetime response mechanism of WY-V. (B) Schematic of intracellular targeting of ER and LD of WY-V.

Rheumatoid arthritis, an autoimmune disease of the immune system, typically exerts severe impacts on the joints and the encompassing soft tissues [1]. The diagnosis of rheumatoid arthritis presently relies on X-ray or ultrasound imaging techniques [2,3]. The precise mechanisms of rheumatoid arthritis pathogenesis are complex, and little is known about the relationship between joint disease and other areas of disease [4–6]. The endoplasmic reticulum (ER) assumes a crucial role in the pathophysiology of arthritis [7]. The ER, a vital organelle within cells, plays an exceedingly significant role in protein synthesis, folding, lipid production, and other essential cellular functions [8–11]. Within the context of arthritis, injury or perturbation to the ER has the potential to induce ER stress, thereby instigating deleterious biological repercussions encompassing apoptosis, inflammatory cascades, and oxidative stress [7,12]. Being dynamic organelles, lipid droplets (LD) intricately participate in the orchestration of intracellular lipid metabolism and management of oxidative stress, phenomena intricately intertwined with the initiation and advancement of arthritis [13–20]. Consequently, a comprehensive investigation into the functions of ER and LD in the pathophysiology of arthritis is anticipated to yield pivotal insights into elucidating novel disease mechanisms and identifying innovative therapeutic targets. The viscosity of the cellular microenvironment is a critical biological parameter, and inflammation typically induces a rise in its viscosity, thereby directly impacting the migration and aggregation of inflammatory cells. This also leads to heterogeneity in the viscosity of arthritic tissue cells across various sites [21–23]. Accordingly, the precise identification of the viscosity of cellular structures in joint tissue represents a crucial yet challenging undertaking. Consequently, an efficient and straightforward approach for detecting viscosity heterogeneity of rheumatoid arthritis is urgently required. Presently, fluorescence lifetime imaging microscopy (FLIM) technology finds extensive application in cellular imaging, owing to its exceptional resolution and sensitivity, thus endowing it with broad prospects for various applications [24–28].
Fluorescence lifetime probes exhibit high sensitivity and enable highly selective detection of biomolecules, organelles, or biological processes [29–33]. Fluorescence lifetime imaging allows for real-time, non-destructive imaging of biological samples, rendering it suitable for studying living cells, tissues, and animal models [34–37]. As fluorescence lifetimes are solely associated with molecular structure and energy level distribution, unaffected by factors such as photobleaching and concentration, this guarantees that the fluorescence lifetimes of probes are only influenced by the factors under detection [24,38–41]. Despite the existence of numerous fluorescent probes designed for viscosity assessment, a shortage remains of near-infrared (NIR) fluorescence lifetime probes with the capability to target both intracellular LD and the ER, and to be utilized for both NIR optical imaging and FLIM imaging (Table S1 in Supporting information). Therefore, there is a critical need to develop a fluorescent lifetime probe capable of facilitating viscosity detection and cellular imaging to assess viscosity heterogeneity in arthritic tissue cells. Consequently, we developed a dual-targeting probe for the ER and LD that are suitable for both FLIM imaging and NIR imaging. This would significantly contribute to the clinical diagnosis of rheumatoid arthritis and enhance pathological studies.
In this study, a microviscosity dual-targeted near-infrared fluorescence lifetime probe (WY-V) was developed based on the twisted intramolecular charge transfer (TICT) principle, which is highly sensitive to viscosity (Scheme 1A). The WY-V probe possesses exposed hydrocarbon groups and chlorine atoms, rendering the molecule overall highly hydrophobic and lipophilic. Both the ER and LD exhibit a monolayer or bilayer phospholipid structure, facilitating the formation of van der Waals interactions between the probe and the hydrophobic tails of the phospholipid molecules, thereby promoting the probe's entry into the ER or LD. Simultaneously, the lipophilic small molecules are governed by chemical thermodynamics, driving the probe to migrate from the cytoplasm to low-polarity LD and the ER, thereby minimizing free energy. Therefore, within the cellular context, probe WY-V can be employed to quantify the distinct viscosities of the ER and LD through variations in their fluorescence lifetimes (Scheme 1B). This probe boasts notable advantages including robust immunity to interference, superior tissue penetration, and effective reduction of background signal interference within biological tissues. FLIM technology was employed for the imaging of cells and tissues, enabling an in-depth investigation into alterations in ER and LD viscosity post-cell stimulation. Subsequent to this, the probes were administered to arthritic mice, followed by the execution of FLIM imaging and NIR optical imaging on joint tissues, elucidating distinct variations in the viscosity of ER and LD between arthritic tissue cells and their normal counterparts. Furthermore, FLIM imaging and NIR optical imaging of the liver, spleen, lung, and kidney were conducted in both arthritic and normal mice. This comprehensive approach aimed to elucidate the impact of arthritis on internal organ dynamics.
The probe consists of a cyanine scaffold fluorophore, an indole fraction and an unsaturated α,β-acrylonitrile. Cyanine as the scaffold fluorophore has the advantages of good photostability and strong fluorescent signals [42–45]. We have introduced indole groups as well as acrylonitrile to give the molecule a longer conjugation system. This has resulted in longer emission wavelengths, reaching the near-infrared emission range. Both the indole and acrylonitrile portions can be used as rotor groups that rotate around C—C single bond. In low viscosity environments, the rotor moiety is free to rotate to form the TICT state, leading to fluorescence shorten and a shorter fluorescence lifetime. In contrast, in high viscosity media, these free rotations are restricted, and the entire molecule is in a planar conformation with an increased chance of decaying to the ground state under fluorescent radiation, leading to enhanced fluorescence emitted by the probe and an increase in fluorescence lifetime. Additionally, in order to assess the reasonableness of the probe design, we conducted density-functional theory (DFT) computations on the WY-V molecule utilizing Gaussian 09 software (B3LYP/6–31 G (d, p) level DFT). As shown in Figs. 1A and B, the ΔE of the highest occupied molecular orbital (HOMO) to the lowest unoccupied molecular orbital (LUMO) when the molecule is in torsion form 0.93 eV. Whereas the ΔE of the HOMO versus the LUMO when the molecule is in the planar conformation reaches 2.24 eV. It is shown that this probe WY-V has a typical TICT mechanism. Therefore, the molecular theory calculations described above demonstrate that the probe WY-V responds to viscosity and can be used to detect changes in viscosity.
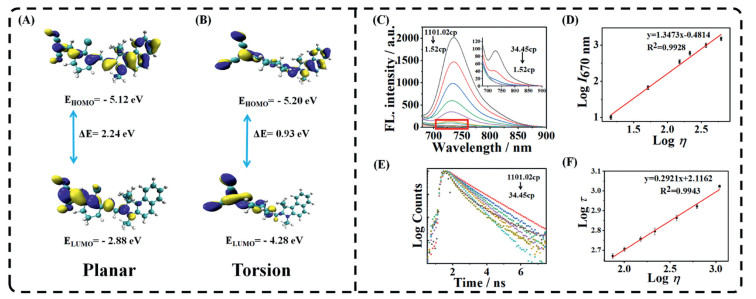
We examined the optical properties of WY-V in different viscosity resolutions. Initially, the ultraviolet (UV) absorption spectra of WY-V were evaluated in both pure phosphate buffer saline (PBS) and pure glycerol (Gly). Fig. S5 (Supporting information) illustrates the red shift of the absorption peak of the probe in pure Gly from 600 nm to 700 nm. This phenomenon may arise from the maximal overlap of molecular orbitals between the indole and α,β-unsaturated acrylonitrile segments of the probe molecule in Gly. This overlap extends the conjugation range of the entire molecule, consequently inducing redshift in the probe's absorption. On this basis we prepared a series of solutions with different viscosities using different ratios of PBS/Gly and measured the viscosity values of each solvent using a viscometer (Table S2 in Supporting information). Fluorescence spectroscopy of WY-V was tested with the above solution. As shown in Fig. 1C, when using 670 nm as the excitation light source, the emission peaks of WY-V are concentrated at 730–740 nm, which is in the near-infrared region. This gives the probe the advantage of a low fluorescence background and good penetration. Therefore, WY-V can be used for in vivo NIR optical imaging. The fluorescence intensity of the probe in PBS was weak at 8.12 a.u., while in Gly it grew to 2014 a.u. The fluorescence yield of WY-V increased 251-fold with increasing viscosity. At the same time, logI736 nm showed a good linear relationship with logviscosity (y = 1.3473x − 0.4814, R2 = 0.9928) (Fig. 1D), this allows WY-V to accurately quantify viscosity.
We then performed a photostability test, fluorescence emissions were collected over a period of 60 min in systems with different viscosities. As can be seen from Fig. S6 (Supporting information), the maximum emission wavelength and fluorescence intensity of the probe in both solutions hardly decayed within 1 h. This indicates that the probe possesses excellent photostability. Tests of probe selectivity were then continued. We used two viscosity system solutions: pure PBS and PBS:Gly = 9:1. The probe WY-V was added to achieve a final probe concentration of 10 mmol/L, next added metal ions such as Co2+, Cu2+, K+, Zn2+, anions such as SO32−, S2O32−, ClO−, SCN− and proteins such as glutamic acid, lysine, and serine, respectively. And the fluorescence intensity of the probe in solutions was measured after each substance was added. The results are shown in Fig. S7 (Supporting information). The fluorescence intensity of WY-V remained relatively stable in both low-viscosity PBS and high-viscosity Gly mixed solutions. Next, we measured the effect of different pH environments on the fluorescence intensity of the probe in both low and high viscosity systems (Fig. S8 in Supporting information). The fluorescence intensity of the probes did not change significantly in different pH environments. The above results demonstrate that the probes have good selectivity and anti-interference ability to perform viscosity response in complex intra-organismal environments and possess great potential for biological applications. Because the fluorescence lifetime of the probe is independent of concentration, photobleaching, and excitation intensity, determination of the fluorescence lifetime of the probe allows for a more accurate quantification of viscosity [46–50]. We measured the fluorescence lifetimes of the probes in different viscosity regimes (Fig. 1E). Consistent with our prediction, the fluorescence lifetime of the probe increased with increasing viscosity, which increased from 34.45 cp to 1101.2 cp, and fluorescence lifetime increased from 950 ps to 4334 ps. At the same time, logt showed a good linear relationship with logviscosity (y = 0.2921x + 2.1162, R2 = 0.9943) (Fig. 1F), this enables WY-V to accurately quantify viscosity within the cell. The WY-V probe demonstrated exceptional selectivity, resistance to interference, and photostability in vivo spectroscopic evaluations. Furthermore, both fluorescence intensity and fluorescence lifetime exhibited a robust linear correlation with viscosity, prompting us to proceed with its application in cellular imaging.
We first performed cytotoxicity tests on the WY-V using MTT. The results are shown in Fig. S9 (Supporting information), the cell survival rate of HepG2 was above 95% with negligible biotoxicity when the concentration of the probe was below the concentration of 50 µmol/L.
The co-localization experiment was then carried out. The cells were first incubated with ER dye (ER-Tracker Green) and WY-V, and the results were shown in Fig. S10 (Supporting information). The fluorescent region of WY-V overlapped with the fluorescent region of ER-Tracker Green over a large area of the cell with a Pearson' s coefficient of 0.84. We continued to incubate the cells with the LD commercial dye (Bodipy) and WY-V together, and the results are shown in Fig. S11 (Supporting information). The fluorescent regions of WY-V and Bodipy also overlap extensively within the cells with a Pearson's coefficient of 0.88. The above results indicate that the main target organelles of WY-V in cells are ER and LD. In addition, the in-situ absorption wavelengths and emission wavelengths of WY-V in cells were consistent with the in vivo NIR fluorescence detection data, indicating that the spectral profile of WY-V was stable and not affected by the intracellular environment. Furthermore, commercial dyes targeting mitochondria, lysosomes, cell membranes, and nuclei were employed for co-localization imaging with the probe WY-V. The results indicated that the co-localization coefficients between WY-V and these organelles were consistently low (0.12 for cell membrane, 0.44 for nucleus, 0.47 for mitochondria, 0.13 for lysosome). Therefore, it was demonstrated that the WY-V probe does not target cell membranes, nuclei, mitochondria, and lysosomes (Figs. S12–S15 in Supporting information).
Inspired by the above experimental results, we conducted cell FLIM imaging experiments using WY-V. Compared to confocal imaging (Fig. S16.a1 in Supporting information), distinguishing the ER from LD based on their distinct viscosities is feasible through pseudo-color representations of fluorescence lifetimes using FLIM imaging with WY-V (Fig. S16.a2 in Supporting information). A distinct reticular pattern characteristic of the ER (region of interest 1 (ROI 1)) and a granular morphology typical of LD (ROI 2) were discerned in the FLIM image. Subsequently, the FLIM images were segregated into red channels (higher fluorescence lifetime) and green channels (lower fluorescence lifetime) based on their fluorescence lifetimes, revealing the distinct presence of ER structures in the red channel and LD in the green channel (Figs. S16.a3 and a4 in Supporting information)
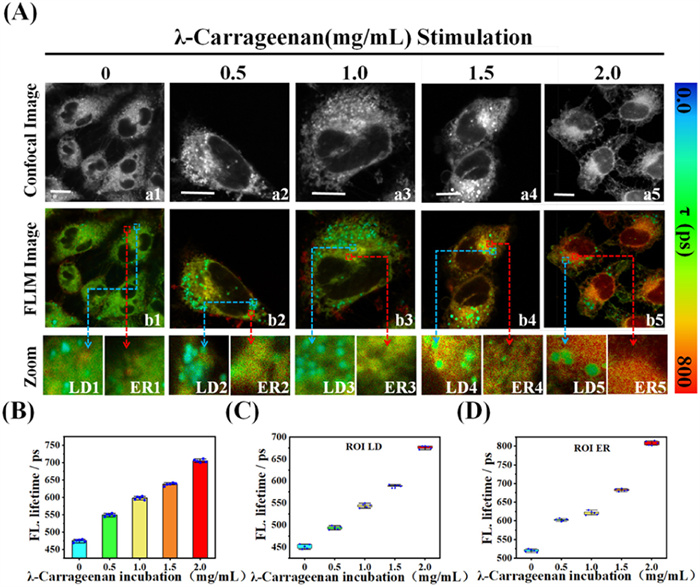
Lipopolysaccharide (LPS), a major component of the cell wall of Gram-negative bacteria, which proved to rupture ionic homeostasis and thus increase the viscosity of the intracellular microenvironment [51–54]. We first stimulated the HepG2 cells for 30 min using different concentrations of LPS (0, 2, 4, 6, 10 mmol/L) to enhanced the cell internal viscosity. The experimental and control groups were then co-incubated with WY-V for 30 min and subjected to FLIM imaging. As shown in Fig. S17 (Supporting information), the fluorescence lifetimes of both the ER and the LD increased with increasing LPS concentration. The overall average fluorescence lifetime of cells increased from 478 ps to 638 ps. The fluorescence lifetime pseudo-color of the LD was gradually changed from cyan blue to green, and the fluorescence lifetime increased from 452 ps to 551 ps. The ER pseudo-color gradually changed from green to red, and the fluorescence lifetime increased from 525 ps to 673 ps. The above results indicate that WY-V successfully detected changes in the viscosity of the cellular microenvironment induced by LPS stimulation. WY-V exhibited different fluorescence lifetimes in ER and LD, revealing respective viscosity changes. It has been reported in the literature that λ-carrageenan induces acute cellular inflammation, which causes an increase in tissue cell viscosity [55,56]. To verify whether λ-carrageenan induces cellular inflammation by increasing the viscosity of the ER and LD, we stimulated HepG2 cells using different concentrations of λ-carrageenan (0, 0.5, 1.0, 1.5, 2.0 mg/mL) for 30 min, followed by FLIM imaging after co-incubation with WY-V for 30 min (Fig. 2A). The fluorescence lifetimes of the ER and LD increased significantly with increasing concentrations of λ-carrageenan. In this case, the overall fluorescence lifetime of the cells increased from 470 ps to 700 ps (Fig. 2B). The fluorescence lifetime pseudo-color of the LD gradually changed from cyan blue to green, and the fluorescence lifetime increased from 452 ps to 680 ps (Fig. 2C). The ER pseudo-color gradually changed from green to red, and the fluorescence lifetime increase from 520 ps to 810 ps (Fig. 2D). We then performed the fluorescence intensity imaging of the above cells. The results, depicted in Fig. S18 (Supporting information), indicate that the fluorescence intensity of WY-V exhibited a pronounced response to variations in viscosity, displaying a notable enhancement. The change in fluorescence intensity is plotted for Fig. S19 (Supporting information). This result suggests that λ-carrageenan can cause acute inflammation of cells, and that WY-V can detect such inflammation by changes in fluorescence lifetime and fluorescence intensity. The above experiments illustrate that WY-V can accurately target the ER and LD of cells and exhibit different fluorescence lifetimes according to different viscosities for the purpose of detecting microenvironmental viscosity changes. Thus, WY-V can be used as a valuable instrument for detecting cellular microenvironmental nuances, enabling simultaneous monitoring of alterations in the ER and LD. This helps the detection and diagnosis of inflammation and lays the foundation for the next in vivo experiments on arthritis.
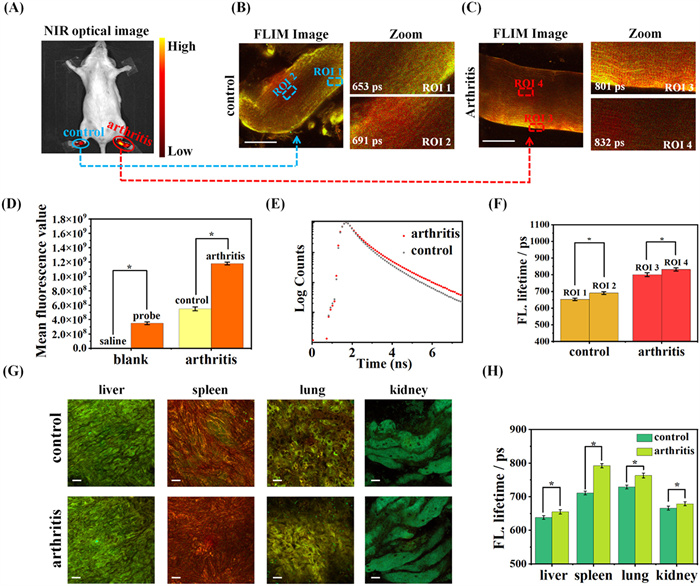
To further explore the imaging effect of WY-V, we performed in vivo NIR imaging of arthritic mice using NIR optical imaging. All mice were purchased from the School of Pharmaceutical Sciences, Guangxi Medical University, and the studies were approved by the Animal Ethical Experimentation Committee of Guangxi Medical University. All animals were kept during experiment according to the requirements of the National Act on the use of experimental animals (China). Initially, two experiments were performed to evaluate the in vivo toxicity of the probe. These experiments involved a NIR imaging study in mice over a period of 36 h, as well as a monitoring study on the body weight and general health status of mice for one-week post-injection. Observations revealed that 30 min after the probe injection, the probe was progressively absorbed by the mice, and fluorescence emission was detected. The fluorescence intensity in the upper abdomen of the mice reached its peak after 6 h. Subsequently, the fluorescence intensity in the mice gradually diminished until it was completely undetectable after 48 h (Fig. S21 in Supporting information). Data on the body weights of the mice at the corresponding time points are presented in (Table S3 in Supporting information). The results indicate no significant change in the mice's body weight following probe injection, and their body weight increased gradually as the mice grew (from 26.7 g to 29.7 g over 7 days). Based on the combined experimental data, including cytotoxicity assays, in vivo imaging, and body weight measurements, we conclude that the WY-V probe exhibits low bio-toxicity and has minimal effects on the mice. We then obtained arthritic mice by subcutaneous injection of λ-carrageenan. The process is shown in Fig. S20 (Supporting information), 50 µL of WY-V (10 µmol/L) was injected into both hind limbs of experimental and control mice, and NIR optical imaging was performed immediately. As shown in Fig. 3A, the fluorescence intensity of the left leg of arthritic mice was significantly higher than that of the right leg, increasing from 5.49 × 10⁸ to 17.9 × 10⁸. Fig. 3D shows the histogram of fluorescence intensity in control and arthritic mice. As shown in Fig. S22 (Supporting information), a low-intensity signal was detected in the left leg of the control mice, whereas no signal was detected in the right leg of the mice injected with saline (medicine). This indicates that the WY-V responds well to arthritic sites accurately differentiating the site of inflammation and can be applied to in situ imaging. Next, we dissected and imaged the livers, spleens, lungs, and kidneys of arthritic mice using NIR optical imaging. The viscera of arthritic mice and normal control mice were co-incubated with the probe for 30 min and imaged after washing off the surface probe with saline. As shown in Fig. S23 (Supporting information), the fluorescence intensity of lungs and livers of arthritic mice was higher than that of normal mice, while the fluorescence increase of the remaining organs was not obvious. This observation may be associated with the progression of inflammation, which likely contributed to an increase in the viscosity of cells within the internal organs of the mice. The increase in viscosity was particularly pronounced in the liver and lungs. We continued to perform FLIM imaging of joint and visceral tissues in both groups of mice. The results are shown in Figs. 3B and C, and it can be seen that the average fluorescence lifetime of the joint tissue cells increased significantly, with the average lifetime increasing from 665 ps to 823 ps. The fluorescence lifetime decay of WY-V in joint tissues of two groups of mice is plotted for Fig. 3E. Most notably, using the WY-V, viscosity heterogeneity in arthritis was clearly monitored via tissue fluorescence lifetime imaging. The fluorescence lifetime of WY-V in local ROI 2 (691 ps) was higher than that in ROI 1 (653 ps) at control joint tissue. Furthermore, arthritis tissues similarly exhibited higher fluorescence lifetimes of WY-V in local ROI 4 (832 ps) compared to ROI 3 (801 ps). The fluorescence lifetime histograms of localized regions in the four joint tissues are Fig. 3F. We next performed FLIM imaging of visceral tissue cells from control and arthritic mice. The fluorescence lifetime of the livers, spleens, lungs and kidneys of the arthritic mice showed a small increase over the control group (Fig. 3G). Fluorescence lifetime histograms for each organ are shown in Fig. 3H. This finding suggests that joint inflammation slightly affects the viscosity environment of systemic organs.
FLIM imaging of mouse joint tissue revealed a substantial elevation in the viscosity of arthritic histiocytes compared to normal joint cells, highlighting viscosity heterogeneity among joint histiocytes across distinct regions. This condition may be associated with the development and spread of arthritis. Visceral imaging of arthritic mice illustrated that the advancement of arthritis induces heightened viscosity levels in the liver, spleen, lungs, and kidneys due to inflammation. The aforementioned experimental outcomes elucidate the capability of WY-V to precisely gauge the viscosity of tissue cells in organisms by monitoring alterations in fluorescence lifetime. Hence, combining NIR optical and FLIM imaging techniques, WY-V holds promise as a potent biosensor for studying viscosity-related ailments such as inflammation.
In conclusion, a meticulously crafted dual-targeted near-infrared fluorescence lifetime probe, WY-V, has been designed. The WY-V boasts near-infrared emission, robust interference immunity, photostability, exceptional selectivity, biocompatibility, and low biotoxicity. The fluorescence lifetime and fluorescence intensity of WY-V exhibits a strong linear correlation with viscosity. Initially employed in HepG2 cells, WY-V effectively targeted the ER and LD, enabling quantification of viscosity alterations through fluctuations in fluorescence lifetime. Following stimulation with LPS and λ-carrageenan, an elevation in the fluorescence lifetime of intracellular WY-V was noted, indicating heightened viscosity within the ER and LD of HepG2 cells. Moreover, it was demonstrated that WY-V exhibited robust responsiveness to variations in the viscosity of both the ER and LD within the cellular environment. Crucially, WY-V was employed for tissue imaging in arthritic mice. NIR optical imaging was used to pinpoint the site of inflammation in arthritic mice. By FLIM imaging, WY-V exhibited precise responsiveness to the viscosity levels of the ER and LD within cells of arthritic tissues, facilitating a reliable assessment of viscosity heterogeneity. This notable capability enhances the evaluation of the arthritis progression and contributes positively to arthritis pathology research. Moreover, FLIM imaging of the liver, spleen, lung, and kidney were conducted in arthritic mice. Findings indicated a slight rise in viscosity across all internal organs in arthritic mice compared to controls, possibly associated with inflammation dissemination. In conclusion, through the integration of NIR optical and FLIM imaging techniques, WY-V can efficiently delineate inflammatory sites in arthritis and provide precise assessments of viscosity in ER and LD within joint tissue cells thus determining the viscous heterogeneity of articular tissues. Therefore, WY-V is poised to serve as a potent biological tool in bioimaging, particularly in the study of viscosity-related diseases. Additionally, WY-V is anticipated to introduce innovative methodologies and novel concepts for the clinical diagnosis of arthritis.
The authors declare that they have no known competing financial interests or personal relationships that could have appeared to influence the work reported in this paper.
Luolin Wang: Writing – original draft, Visualization, Methodology, Investigation. Xing Liang: Writing – original draft, Visualization, Methodology, Investigation, Conceptualization. Hanwen Chi: Visualization, Investigation. Weiying Lin: Writing – review & editing, Resources, Funding acquisition.
This work was financially supported by Guangxi Natural Science Foundation (Nos. AD21220061, 2021GXNSFDA075003), National Natural Science Foundation of China (Nos. 22277014, 22077048), and the startup fund of Guangxi University (No. A3040051003).
Supplementary material associated with this article can be found, in the online version, at doi:
J.S. Smolen, D. Aletaha, I.B. McInnes, Lancet 388 (2016) 2023–2038.
A. Di Matteo, J.M. Bathon, P. Emery, Lancet 402 (2023) 2019–2033.
M. Gravallese Ellen, S. Firestein Gary, N. Koscal, et al., N. Engl. J. Med. 390 (2024) e32.
D.J. Veale, U. Fearon, Lancet 391 (2018) 2273–2284.
S. Alivernini, G.S. Firestein, I.B. McInnes, Immunity. 55 (2022) 2255–2270.
I.B. McInnes, G. Schett, N. Engl. J. Med. 365 (2011) 2205–2219.
W.S. Lee, Y.J. Choi, Y.H. Cheon, et al., Ann. Rheum. Dis 74 (2015) 219-219.
T. Nguyen, W.C. Chin, P. Verdugo, Nature 395 (1998) 908–912.
S.J. Singer, G.L. Nicolson, Science 175 (1972) 720–731. doi: 10.1126/science.175.4023.720
T. Katayama, K. Imaizumi, N. Sato, et al., Nat. Cell Biol. 1 (1999) 479–485.
Y. Zhou, Z. Liu, G. Qiao, B. Tang, P. Li, Chin. Chem. Lett. 32 (2021) 3641–3645.
M. Rahmati, M.A. Moosavi, M.F. McDermott, Trends Pharmacol. Sci. 39 (2018) 610–623.
B. Dong, Y. Lu, N. Zhang, W. Song, W. Lin, Anal. Chem. 91 (2019) 5513–5516. doi: 10.1021/acs.analchem.9b01457
U. Özcan, Q. Cao, E. Yilmaz, et al., Science 306 (2004) 457–461.
Y. Wang, L. Vera, W.H. Fischer, M. Montminy, Nature 460 (2009) 534–537. doi: 10.1038/nature08111
W. Li, R. Li, R. Chen, et al., Anal. Chem. 94 (2022) 7996–8004. doi: 10.1021/acs.analchem.2c01048
L. Guo, M. Tian, Z. Zhang, et al., J. Am. Chem. Soc. 143 (2021) 3169–3179. doi: 10.1021/jacs.0c12323
Q. Gao, J. Goodman, Front. Cell Dev. Biol. 3 (2015) 00049.
J.A. Olzmann, P. Carvalho, Nat. Rev. Mol. Cell Biol. 20 (2019) 137–155. doi: 10.1038/s41580-018-0085-z
N. Ding, X. Liu, A. Meng, X. Zhao, G. Ma, et al., Chin. Chem. Lett. 34 (2023) 107745.
S. Wang, W.X. Ren, J.T. Hou, et al., Chem. Soc. Rev. 50 (2021) 8887–8902. doi: 10.1039/d1cs00083g
H. Wang, Y. Sun, X. Lin, et al., Chin. Chem. Lett. 34 (2023) 107626.
S. Wang, B. Zhou, N. Wang, et al., Chin. Chem. Lett. 31 (2020) 2897–2902.
L. Scipioni, A. Rossetta, G. Tedeschi, E. Gratton, Nat. Methods. 18 (2021) 542–550. doi: 10.1038/s41592-021-01108-4
A. Sharma, P. Verwilst, M. Li, et al., Chem. Rev. 124 (2024) 2699–2804. doi: 10.1021/acs.chemrev.3c00778
Z. Li, J. Cheng, P. Huang, G. Wu, W. Lin, Chin. Chem. Lett. 35 (2024) 109153.
R. Chen, W. Li, R. Li, S. Ai, H. Zhu, et al., Chin. Chem. Lett. 34 (2023) 107845.
C. Liu, L. Zhou, L. Xie, et al., Chin. Chem. Lett. 33 (2022) 2537–2540.
D. Cao, Z. Liu, P. Verwilst, S. Koo, P. Jangjili, et al., Chem. Rev. 119 (2019) 10403–10519. doi: 10.1021/acs.chemrev.9b00145
L. He, Y. Yang, W. Lin, Anal. Chem. 91 (2019) 15220–15228. doi: 10.1021/acs.analchem.9b04103
A.S. Klymchenko, Acc. Chem. Res. 50 (2017) 366–375. doi: 10.1021/acs.accounts.6b00517
J. Yan, X. Liang, Q. Zhang, L. Wang, W. Lin, Chin. Chem. Lett. 35 (2024) 108408.
H. Zhu, W. Li, S. Ai, Y. Wan, W. Lin, J. Hazard. Mater. 470 (2024) 134275.
G.Y. Chen, M.A. Lampson, Nat. Chem. Biol. 17 (2021) 632–640. doi: 10.1038/s41589-021-00798-3
J. Zhan, W. Song, E. Ge, L. Dai, W. Lin, Coord. Chem. Rev. 493 (2023) 215321.
Y. Zhao, H.S. Kim, X. Zou, et al., J. Am. Chem. Soc. 144 (2022) 20854–20865. doi: 10.1021/jacs.2c08966
P. Zhou, J. Shen, J. Liang, et al., Chin. Chem. Lett. 34 (2023) 107460.
R. Borlinghaus, L. Kuschel, Nat. Methods 3 (2006) 868-868.
M.K. Kuimova, G. Yahioglu, J.A. Levitt, K. Suhling, J. Am. Chem. Soc. 130 (2008) 6672–6673. doi: 10.1021/ja800570d
M.A. Haidekker, E.A. Theodorakis, Org. Biomol. Chem. 5 (2007) 1669–1678.
M. Zhang, M. Wen, Y. Xiong, L. Zhang, C. Tian, Chin. Chem. Lett. 29 (2018) 1509–1512.
Q.D. Wilson, E.M. Sletten, Nat. Chem. 16 (2024) 3–5. doi: 10.1038/s41557-023-01408-6
G. Fei, S. Ma, C. Wang, et al., Coord. Chem. Rev. 447 (2021) 214134.
Y. Liu, J. Zhou, L. Wang, et al., J. Am. Chem. Soc. 138 (2016) 12368–12374. doi: 10.1021/jacs.6b04048
J.B. Miller, D.E. Koshland, Nature 272 (1978) 83–84. doi: 10.1038/272083a0
M. Castello, G. Tortarolo, M. Buttafava, et al., Nat. Methods 16 (2019) 175–178. doi: 10.1038/s41592-018-0291-9
Y. Ouyang, Y. Liu, Z.M. Wang, Z. Liu, M. Wu, Nano-Micro Lett. 13 (2021) 133.
M. Barroso, M.G. Monaghan, R. Niesner, R.I. Dmitriev, Adv. Drug Delivery Rev. 201 (2023) 115081.
D. Dziuba, P. Jurkiewicz, M. Cebecauer, M. Hof, M. Hocek, Angew. Chem. Int. Ed. 55 (2016) 174–178. doi: 10.1002/anie.201507922
P. Zhou, P. Lv, L. Yu, et al., Chin. Chem. Lett. 30 (2019) 1067–1070.
S. Elmore, Toxicol. Pathol. 35 (2007) 495–516. doi: 10.1080/01926230701320337
X. Wang, Y. Zhang, Biochem. Biophys. Res. Commun. 501 (2018) 106–112.
L.J. Pallett, L. Swadling, M. Diniz, et al., Nature 614 (2023) 334–342. doi: 10.1038/s41586-022-05645-6
G. Xie, L. Zhu, Y. Song, et al., Chin. Chem. Lett. 32 (2021) 2164–2168.
B. Sur, S. Kang, M. Kim, S. Oh, Inflammation 42 (2019) 928–936. doi: 10.1007/s10753-018-0947-8
K.S. Kim, M.H. Kim, M. Yeom, et al., Rheumatol. Int. 32 (2012) 3875–3879. doi: 10.1007/s00296-011-2286-z

Scheme 1 (A) Chemical structure and fluorescence lifetime response mechanism of WY-V. (B) Schematic of intracellular targeting of ER and LD of WY-V.

Figure 1 (A, B) Spatial electron distribution B3LYP/6–31 G (d, p) levels of HOMOs and LUMOs of probes in the planar or torsion state. (C) Fluorescence spectra of WY-V in PBS/Gly system with solution viscosities from 1101.2 cp to 1.52 cp (λex = 670 nm). (D) Linear relationship between logI670 nm and logη. (E) Fluorescence lifetime decays of WY-V in PBS/Gly system at different viscosities from 1101.2 cp to 1.52 cp (λex = 670 nm, λem = 550–800 nm). (F) Linear relationship between logt and logη. t = time (ps), η = viscosity (cp). Data are presented as mean ± standard deviation (SD) (n = 3).

Figure 2 (A) FLIM image of WY-V in HepG2 cells stimulated with different concentrations of λ-carrageenan (0, 0.5, 1.0, 1.5, 2.0 mg/mL). (a1–a5) Bright field diagrams; (b1–b5) FLIM image of WY-V in HepG2 cells; (LD1–LD5) Partial view of LD; (ER1–ER5) Partial view of ER. (B) Mean fluorescence lifetime plotted against λ-carrageenan concentration. (C) Plot of LD average fluorescence lifetime as a function of λ-carrageenan concentration. (D) Plot of ER average fluorescence lifetime as a function of λ-carrageenan concentration. Scale bar: 10 µm.

Figure 3 (A) In situ NIR fluorescence imaging of WY-V in arthritic mice. (B) FLIM images of joint tissue from the uninflamed right leg (saline injected) of experimental mice. (C) FLIM images of joint tissue from the arthritic left leg (injected with λ-carrageenan) of experimental mice. (D) Columnar comparison of fluorescence intensity of WY-V in joints and viscera of arthritic and control mice. (E) Plot of fluorescence lifetime decay function of WY-V in mouse joints. (F) Plot of fluorescence lifetime changes of cells at different locations in mouse joints. (G) FLIM imaging of WY-V in different viscera of arthritic and control mice. (H) Columnar comparison of fluorescence lifetime of WY-V in different viscera of arthritic and control mice. Scale bar: 10 µm. Data are presented as mean ± SD (n = 3). Statistical calculation of experimental data was done using the one-way ANOVA statistical analysis. *P < 0.1.

 扫一扫看文章

扫一扫关注我们
 DownLoad:
 下载:
下载: