Scheme 1.
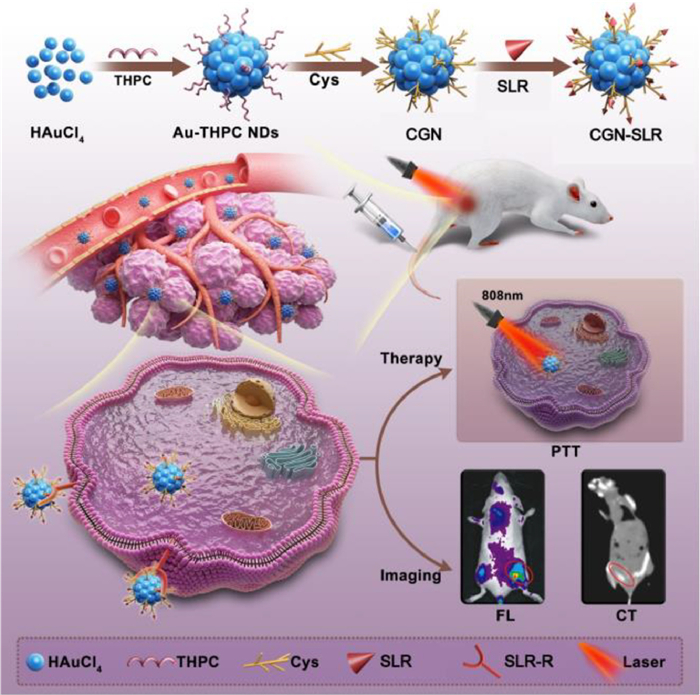
The preparation of CGN-SLR and utilized for target recognition and precise dual-mode imaging-guided PTT against TNBC. SLR-R: Sulfhydrated luteinizing releasing hormone receptor.
Advanced nanosystem for target recognition and precise dual-mode imaging-guided photothermal therapy against triple-negative breast cancer
Lei Li , Annan Liu , Gang Wei , Xingchen Li , Hao Liang , Maja D. Nešić , Ze Wang , Hui Guo , Quan Lin

Breast cancer is one of the most common malignancies in women, accounting for 11.7% of all cancer cases globally. Its incidence is rising, with new cases expected to increase to over 40% by 2040 [1,2]. Among its subtypes, triple-negative breast cancer (TNBC) accounts for 10%–15% of cases and is particularly aggressive. TNBC presents significant clinical challenges due to its high invasiveness and metastatic potential, leading to poor prognosis and increased recurrence risk. Traditional single-mode diagnosis methods struggle with accuracy in detecting TNBC, and there are no targeted therapies currently available, making the development of effective diagnostic and treatment strategies for TNBC an urgent clinical priority [3–6].
The development of nanomaterials offers new hope for the diagnosis and treatment of TNBC [7–10]. This approach involves the application of nano-drug delivery systems to facilitate immune activation, enhance drug accumulation, and integrate multimodal therapeutic strategies to improve therapeutic efficacy while minimizing side effects [11–13]. Among them, gold nanoparticles (GNPs) possess excellent fluorescent properties and X-ray attenuation ability, making them ideal for fluorescence and computed tomography (CT) imaging [14–16], significantly improving cancer detection [17,18]. GNPs also exhibit excellent photothermal properties, which are used in photothermal therapy (PTT), a non-invasive technique that converts light into heat to selectively destroy tumor cells [19,20]. Additionally, based on the easy surface functionalization of gold-based nanomaterials, they can be used as carriers to load drugs, peptides, antibodies, which can endow them with more functions, such as labeling, targeting, and intelligent release of drugs [20,21].
Target recognition is important for diagnosis and treatment [22]. Although TNBC lacks specific molecular targets, researchers are actively exploring and developing novel targeting strategies [23–27]. Luteinizing hormone releasing hormone is a polypeptide released in a pulsatile manner by the hypothalamus. Its main function for women is regulating the release of estrogen and progesterone and the formation of menstruation [28]. Luteinizing hormone releasing hormone receptors can be expressed in sex hormone-dependent tumors, such as prostate cancer, and ovarian cancer [29–31]. There have been reports indicating satisfactory outcomes in the diagnosis and treatment of prostate cancer through luteinizing hormone releasing hormone-modified nanoparticles [32]. At present, TNBC has limited effectiveness with targeted therapies due to the absence of key receptors commonly targeted in other breast cancer subtypes. Therefore, the high expression of luteinizing hormone releasing hormone receptors in TNBC presents a promising target for both diagnosis and treatment [33,34].
To address the challenges in diagnosing and treating TNBC, the targeted theranostic platform of cysteine (Cys)-modified gold nanodots-sulfhydrated luteinizing hormone releasing hormone (CNG-SLR) nanosystem was designed for target recognition and precise dual-mode imaging-guided PTT. First, we successfully developed Cys-modified gold nanodots (CGN), where Cys acts as both an etching ligand and a stabilizing agent. These fluorescent gold nanodots exhibited ultra-small size, excellent biocompatibility, robust fluorescence, favorable thermodynamic properties, and notable X-ray attenuation capabilities. Then, 1-ethyl-3-(3-dimethylaminopropyl)carbodiimide (EDC) and N-hydroxysuccinimide (NHS) were used to activate the carboxyl group of CGN, and subsequently, the activated carboxyl group formed an amide bond with the amino group of SLR, resulting in the successful development of CGN-SLR nanosystem with targeted recognition function. This multifunctional nanosystem demonstrated not only outstanding targeted dual-mode imaging capabilities (fluorescence and CT), offering a diagnostic reference for non-invasive preoperative diagnosis of TNBC but also achieved precise targeted PTT for TNBC (Scheme 1). This work offers a promising direction for combining TNBC diagnosis and treatment.
An advanced CGN-SLR nanosystem was designed for imaging-guided targeted PTT of TNBC. First, the Cys-stabilized fluorescent gold nanoclusters were synthesized by ligand-induced etching via a top-down approach. Large-sized but non-fluorescent Au-tetrakis(hydroxymethyl)phosphonium chloride (THPC) NPs were prepared by reducing chloroauric acid (HAuCl4) using THPC as a reducing agent and ligand. Then, to obtain CGN, Cys with excellent biocompatibility was used to etch Au-THPC NPs.
The morphology and structure of the CGN-SLR nanosystem were investigated. As shown in Figs. 1a and c, CGN and CGN-SLR prepared by this method spherical appearance under the transmission electron microscope (TEM). According to particle size analysis, the CGN particles exhibited uniform size, and an average size of approximately 2.99 ± 0.07 nm (Fig. 1b). The carboxyl group present on the surface of CGN is capable of forming an amide bond with the amino group on the surface of SLR. This allows SLR to be effectively attached to the surface of CGN. The chemical structure of SLR is shown in Fig. S1 (Supporting information). After modification, the morphology of CGN-SLR was almost unchanged, the particle size was still spherical, and the size was about 3.25 ± 0.05 nm (Fig. 1d). Particle size is a critical factor in the delivery and clearance of nanodots. Literature data indicates that nanoparticles with diameters smaller than 20 nm, penetrate tumor tissues more effectively and distribute drugs more uniformly across the tumor site due to their small size [35–37]. Moreover, it is shown that small-size nanoparticles, <10 nm, exhibit efficient renal clearance and low accumulation in reticuloendothelial system (RES) organs, thus reducing systemic toxicity [38]. As a result, nanodots with a size of 3.3 nm should be a good candidate for improved pharmacokinetics, enhanced therapeutic efficacy and reduced toxicity.
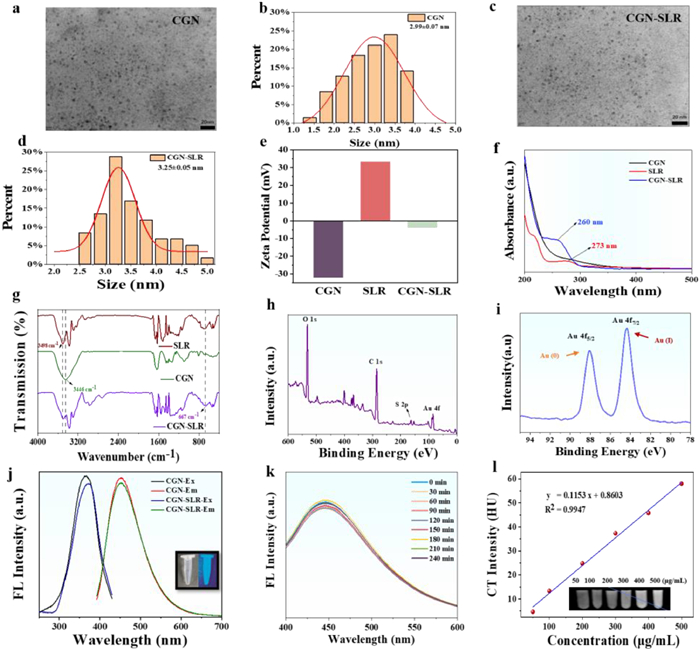
Due to the large number of carboxyl groups on the surface of Cys, CGN was negatively charged with zeta potential −32 mV. After connecting the SLR (zeta potential 33.3 mV), the CGN-SLR tended to be electrically neutral (zeta potential −3.7 mV) (Fig. 1e), which could be beneficial because neutral or slightly negatively charged nanodots could resist the protein adsorption for a longer time [39,40]. Thus reducing the non-specific interactions, enhancing their stability in the bloodstream, and improving the delivery efficiency to tumors. The ultraviolet absorption spectrum of CGN, SLR, and CGN-SLR are shown in Fig. 1f. SLR had a characteristic absorption peak at 273 nm, and CGN had a wide absorption in the test range. The characteristic absorption peak of CGN-SLR appeared at 260 nm with a slight blue shift compared with SLR. We further confirmed the successful conjugation between CGN and SLR using Fourier transform infrared spectroscopy (FTIR), as depicted in Fig. 1g. Both SLR and CGN-SLR exhibited a characteristic peak at 667 cm−1, corresponding to the benzene ring. Additionally, the presence of a peak near 3498 cm−1, indicative of the phenolic hydroxyl group, was observed in both samples, providing evidence of the successful connection between CGN and SLR. Interestingly, CGN displayed a characteristic carboxyl group peak at 3446 cm−1, which disappeared in CGN-SLR. The above results all suggest that the carboxyl group of CGN has formed an amide bond with the amino group of SLR, providing strong evidence for successful conjugation.
The composition and valence structure of CGN-SLR was analyzed by X-ray photoelectron spectroscopy (XPS). Fig. 1h shows the elemental composition of CGN-SLR, which includes Au, S, C, and O. The Au 4f orbital binding energy spectrum reveals two distinct peaks at 84.35 eV (Au(I)) and 88.10 eV (Au(0)) (Fig. 1i). The Au(0) facilitates the nucleation of nanodots, while Au(I) forms Au-S bonds, ensuring NPs stability and fluorescence [41]. The presence of Au-S bonds enhances structural integrity and fluorescence. The 2p orbital binding energy spectrum of S exhibits characteristic peaks at 163.3 and 167.85 eV, which are mainly attributed to the formation of Au-S bonds with Au(I) (Fig. S2 in Supporting information).
The optimal function of a fluorescent probe lies in its fluorescence stability, ensuring that the endosome environment is sufficiently complex to prevent fluorescence quenching. As depicted in Fig. 1j, CGN-SLR exhibits a vibrant blue fluorescence upon ultraviolet excitation. Post-conjugation with the targeting agent, the position and intensity of the fluorescence emission peak remain largely unaltered, which underscored the sustained robustness of CGN-SLR fluorescence characteristics. The prepared CGN and CGN-SLR exhibits remarkable fluorescence stability, with negligible fluctuations observed in both emission peak position and intensity over 21 days (Figs. S3a and b in Supporting information). We conducted a study on the photostability of CGN-SLR solution by exposing it to ultraviolet light for 4 h. As shown in Fig. 1k, the fluorescence intensity of CGN-SLR remained almost unchanged, and no fluorescence bleaching was observed, indicating that CGN-SLR possesses excellent photostability. Given the intricate physiological milieu within organisms, we systematically probed alterations in fluorescence characteristics across diverse pH ranges and the presence of varying ion species. As illustrated in Fig. S3c in Supporting information, CGN-SLR evinced sustained fluorescence stability despite high concentrations (200 mmol/L) of K+, Ca2+, Na+, and Mg2+ ions, and the fluorescence attributes of the specimen exhibited robust constancy within the pH spectrum of 4–10 (Fig. S3d in Supporting information). Notably, this compelling evidence underscores the prospective viability of the synthesized CGN-SLR for in vivo fluorescence tracing applications, benefiting from their resilience to physiological conditions and ionic environments. This exceptional fluorescence stability underscores the potential of these nanodots for fluorescence-based imaging technologies.
As we have already mentioned, gold nanomaterials are highly regarded as an optimal contrast agent in vivo studies, achieving effective tumor accumulation and longer circulation times than standard small-molecule agents for CT imaging in living mice, due to their excellent biocompatibility, stable physicochemical properties, facile chemical synthesis and functionalization [15]. Furthermore, gold nanomaterials possess exceptional X-ray attenuation capabilities [14,42,43]. The synthesized CGN-SLR also exhibited remarkable CT imaging performance. We conducted CT imaging at various concentrations (50, 100, 200, 300, 400, and 500 µg/mL) to observe the relationship between concentration and CT intensity, revealing a clear linear correlation (R2 = 0.9947, Fig. 1l). These findings further highlight the potential of the prepared CGN-SLR as an effective CT imaging enhancer.
In this study, we employed MDA-MB-231 cells, a widely recognized cell line representing TNBC [44]. Notably, the cell lines have demonstrated substantial luteinizing hormone releasing hormone receptor expression [31,45]. Human umbilical vein endothelial (HUVE) cells were chosen as the control group. To affirm the biocompatibility of CGN and CGN-SLR, they were cultured within HUVE cells (Figs. S4a and c in Supporting information) and MDA-MB-231 cells (Figs. S4b and d in Supporting information) for 24 and 48 h. Various concentration gradients of CGN and CGN-SLR were employed: 0, 100, 200, 300, 400, and 500 µg/mL. After 24 and 48 h of incubation, even at a concentration as high as 500 µg/mL. The survival rates of HUVE cells (Figs. S4a and c) and MDA-MB-231 cells (Figs. S4b and d) remained above 80%, suggesting that both CGN and CGN-SLR exhibit good biocompatibility. We chose 400 µg/mL for the following experiment. This robust viability indicates that the synthesized nanomaterials possess ideal biocompatibility.
The capacity of CGN-SLR to target TNBC cells is pivotal for realizing a multifunctional approach to diagnosing and treating TNBC. Cellular internalization was visualized using confocal laser scanning microscopy (CLSM). The intracellular cytoskeleton was fluorescently labeled with green fluorescence, while blue fluorescence indicated CGN and CGN-SLR. As illustrated in Fig. 2a, after a 2 h exposure period with CGN, MDA-MB-231 cells exhibited minimal blue fluorescence. The blue fluorescence signal corresponding to CGN-SLR in tumor cells was significantly higher than that observed in the non-targeted CGN group (Fig. 2b). Furthermore, at 4 and 6 h, the fluorescence intensity in MDA-MB-231 cells treated with CGN-SLR was markedly stronger compared to the CGN group. Quantitative analysis was performed using Image J software, revealing that after 2 h of the treatment period, the blue fluorescence area percentages for the CGN and CGN-SLR groups were 8.53% and 41.6%, respectively. This substantiates the expedited intracellular uptake of targeted nanomaterials. The targeted group maintained its superior intracellular delivery capability. At 4 and 6 h, the proportions of targeted nanomaterials entering tumor cells were 53.6% and 71.3%, respectively, whereas the non-targeted group exhibited values of 20.7% and 40.6% (Fig. 2d).
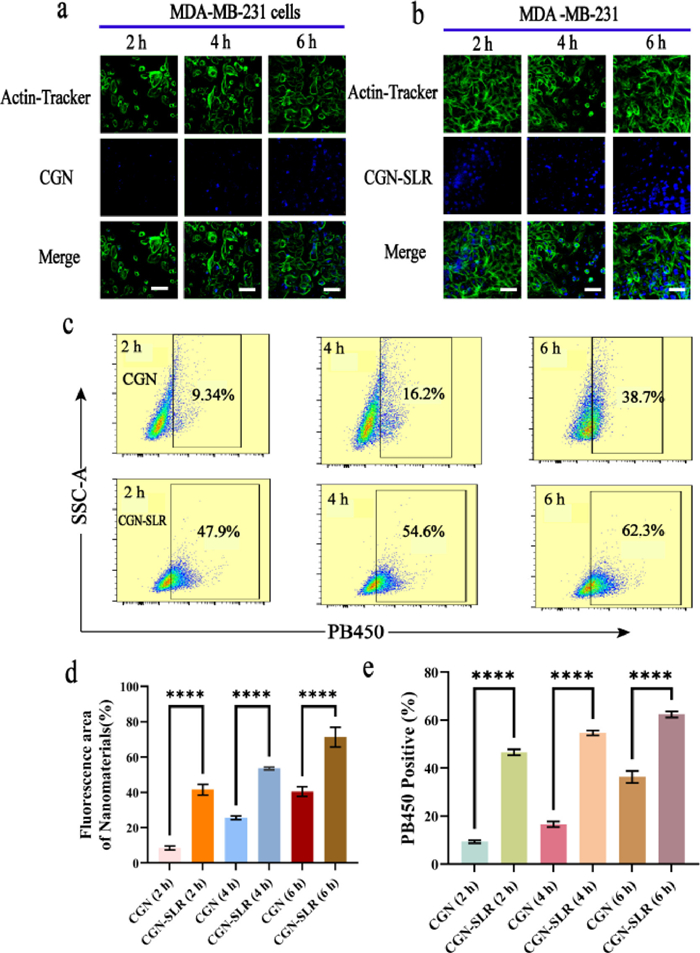
The synthesized CGN-SLR in this study exhibits remarkable fluorescence characteristics and can be efficiently detected using the fluorescence channel of flow cytometry. To further investigate cellular uptake, MDA-MB-231 cells were treated with CGN and CGN-SLR, and subjected to flow cytometry analysis in the PB 450 channel (excitation at 405 nm and emission at 450 nm). The corresponding results are presented in Fig. 2c. In the CGN group, the percentage of cells exhibiting positive PB 450 channels increased gradually over time, with values of 9.34%, 16.2%, and 38.7% after 2, 4, and 6 h of treatment duration, respectively. In contrast, the CGN-SLR group displayed significantly higher percentages of cells with positive PB 450 channels, reaching values of 47.9%, 54.6%, and 62.3% at the corresponding time points (Fig. 2e). Hence, owing to the targeted effectivity of SLR for luteinizing hormone releasing hormone receptors on the breast cancer cell membrane, CGN-SLR exhibited swifter and greater uptake by MDA-MB-231 cells than CGN [27]. CGN-SLR shows improved cellular uptake compared to CGN, highlighting its potential as a targeted delivery system. SLR guides CGN-SLR to the luteinizing hormone releasing hormone receptors, promoting quicker and more frequent entry into TNBC cells, which lays the groundwork for effective diagnosis and treatment of TNBC and offers valuable insights for future biomedical applications.
To clarify the differences in the uptake of CGN-SLR between TNBC cells and normal cells, we conducted additional studies focusing on the uptake by HUVE cells over the same time intervals as MDA-MB-231 cells using both CGN and CGN-SLR, assessed by CLSM and flow cytometry. CLSM images of HUVE cells treated with CGN and CGN-SLR showed no significant differences at any time point (Figs. S5a and b in Supporting information). This observation was further confirmed by quantitative analysis using Image J software (Figs. S5d in Supporting information). Flow cytometry results revealed that the percentages of CGN internalized by HUVE cells at 2, 4, and 6 h were 11.6%, 15.5%, and 31.3%, respectively. Similarly, the percentages of CGN-SLR uptake were 8.73%, 13.6%, and 30.6% at the corresponding time points, with no statistically significant differences between the two groups (Figs. S5c and e in Supporting information). Comparing TNBC tumor cells and HUVE cells, we observed significantly higher nanoparticle uptake by MDA-MB-231 cells over the same period. Notably, a statistically significant difference was evident as early as 2 h, highlighting the enhanced targeting ability of SLR, which promoted the rapid entry of CGN-SLR into tumor cells.
Studies indicate that the cell membrane is negatively charged, hence nanoparticles with positive charges are more likely to enter the cells [46]. However, CGN was negatively charged, and the zeta potential of CGN-SLR was close to 0 mV. So, was the ability of CGN to enter MDA-MB-231 cells more quickly and in greater numbers compared to CGN-SLR due to the difference in charge? To address this, Au-PEI NDs were synthesized using PEI as a ligand as a control, with a particle size of 1.96 ± 0.02 nm and a zeta potential of 19.43 mV (Figs. S6 and S7 in Supporting information). Cytotoxicity testing was then conducted for the Au-PEI NDs, followed by CLSM and flow cytometry assays (Fig. S8 in Supporting information). The results suggested that compared to CGN, Au-PEI indeed could enter tumor cells in greater numbers at the same time, nevertheless, the degree of cellular internalization was found to have been substantially lower in comparison to that achieved by CGN-SLR (Fig. S9 in Supporting information). Hence, our findings suggest that CGN-SLR can exhibit enhanced and faster cellular uptake in MDA-MB-231 cells due to the specific recognition of SLR for luteinizing hormone releasing hormone receptors [47,48]. The excellent targeting ability of CGN-SLR toward TNBC cells provides a strong foundation for multimodal imaging and PTT in TNBC.
Nanomaterials with targeting functions can selectively accumulate within tumor cells. By selectively irradiating these accumulated areas, highly targeted PTT of tumor cells can be achieved, reducing damage to the surrounding normal tissue [49]. PTT holds promise as a viable treatment approach for various tumor types, encompassing solid and invasive tumors, thereby presenting a viable option for patients afflicted by multiple tumors. Notably, in the case of breast cancer, its relatively superficial location compared to other solid tumors renders it an optimal candidate for PTT treatment [50,51].
Elevated temperatures exceeding 41 ℃ have been observed to lead to the denaturation of proteins and transient inactivation of cells, which could extend for several hours [52]. In the context of PTT, when temperatures surpass 48 ℃, thermal ablation initiates a cascade of effects, including profound and irreparable protein denaturation, DNA damage, and the disruption of cellular defenses [53]. In this research, we delved into the photothermal effects stemming from applying CGN-SLR. At an 808 nm near-infrared wavelength, CGN-SLR showed significantly higher absorption compared to PBS, providing a basis for PTT (Fig. S10 in Supporting information). We selected 808 nm irradiation at 2.0 W/cm2 for 10 min and compared the CGN-SLR group with the PBS group. The temperature in the CGN-SLR group increased by 15.2 ℃, while the PBS group showed a rise of <5 ℃ (Fig. 3a). Fig. 3d provides a clear visualization of the temperature increase in the CGN-SLR nano-system. As depicted in Fig. S11 (Supporting information) and Fig. 3b, upon exposure to an 808 nm laser at power levels ranging from 1 W/cm2 to 3 W/cm2 for 10 min with a concentration of 400 µg/mL, CGN and CGN-SLR solutions exhibited a positive correlation between temperature variations and laser power. As the concentration of CGN-SLR increases, the temperature elevation under 808 nm laser irradiation at a power density of 2.0 W/cm2 also shows a gradual upward trend (Fig. S12 in Supporting information). Remarkably, when subjected to a power of 2.0 W/cm2 for 10 min, the temperature in CGN and CGN-SLR groups surged by 13.6 and 15.2 ℃, respectively. With the human internal temperature estimated at 37 ℃, and the ability to attain temperatures exceeding 48 ℃, a critical threshold for complete tumor cell ablation becomes evident. To assess the photothermal durability of CGN-SLR, it was exposed to an 808 nm laser for 10 min and allowed to cool to room temperature. This process was repeated multiple times. The CGN-SLR maintained a consistent maximum temperature throughout these cycles, indicating its robust and sustained photothermal properties with minimal attenuation (Fig. 3c). This observation suggests that the material exhibits strong photothermal properties, indicating its potential for sustained and recurrent tumor treatments.
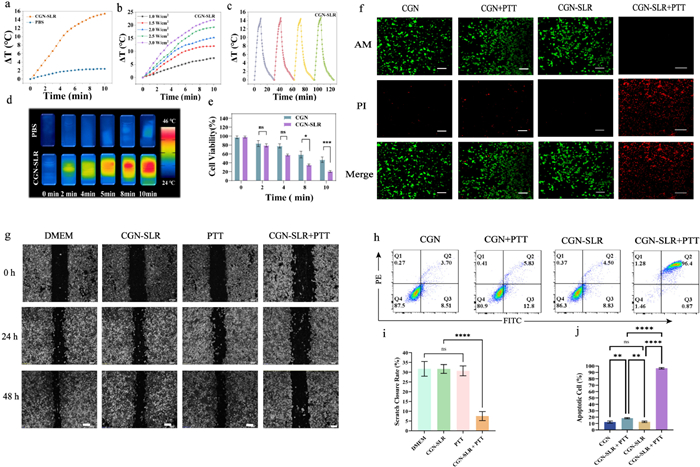
Based on our photothermal property findings, we chose a laser intensity of 2.0 W/cm2 for the subsequent cell experiments. MDA-MB-231 cells were treated with CGN and CGN-SLR for 6 h, then exposed to an 808 nm laser for different durations: 0, 2, 4, 8, and 10 min. Cell quantification was conducted using the cell counting kit-8 (CCK-8). The results shown in Fig. 3e indicate that after 10 min of laser irradiation, the viability of MDA-MB-231 cells in the CGN-SLR group was significantly reduced, with a cell survival rate of approximately 20%, compared to 46% in the CGN group. The inhibitory effect of the CGN-SLR group on both cell lines was greater than that of the CGN group. This augmentation can be attributed to the affinity of SLR to the luteinizing hormone releasing hormone receptors in the aforementioned tumor cells, facilitating enhanced cellular internalization of targeted nanodots [29,54]. These results underscore the nanomaterial's promising potential for PTT within biological systems.
Building on this observation, we visually demonstrated the photothermal efficacy of CGN by using propidium iodide (PI) staining to indicate cell death and calcein-AM staining to represent viable cells. MDA-MB-231 cell lines, when treated with CGN-SLR combined with PTT, exhibited intense crimson fluorescence compared to the CGN combined with the PTT group. These cellular experiments not only validate the enhanced targeting precision but also highlight the potent phototherapeutic potential of CGN-SLR in treating TNBC (Fig. 3f).
Subsequently, the ability of CGN-SLR-mediated PTT to inhibit tumor cell migration was evaluated. A scratch assay was performed to evaluate cell migration. As shown in Fig. 3g, the migration rate of MDA-MB-231 cells in the CGN-SLR combined with the PTT group exhibited a significant reduction. In contrast, the migration ability of cells in the PTT-only group or the CGN-SLR-only group was not notably different from the control group (cells treated with Dulbecco's modified Eagle medium) (Figs. 3g and i). This finding demonstrates that the targeted CGN-SLR towards TNBC cells enhances the PTT effect, effectively inhibiting the migratory capabilities of breast cancer cells, and suggesting potential antimetastatic properties.
Furthermore, to comprehensively evaluate the impact of the experimental interventions on cellular dynamics, Annexin V-fluorescein isothiocyanate (FITC)/PI apoptosis detection was meticulously conducted across the aforementioned experimental cohorts. Our results further confirm the excellent biocompatibility of both CGN and CGN-SLR. However, following their combination with PTT treatment, we observed that the CGN-SLR group exhibited a more pronounced ability to promote apoptosis in TNBC cells compared to the CGN group (Figs. 3h and j). This collective evidence further solidifies the robust targeted PTT efficacy of CGN-SLR.
To address the limitations of single-modality imaging in clinical settings, our study delved into the dual-modality targeted imaging capabilities of CGN-SLR for TNBC, aiming to more accurately pinpoint tumor locations and provide complementary information for tumor detection. Given the in vitro validation of CGN-SLR's superior targeting ability to TNBC cells, we proceeded to in vivo experiments to further substantiate these findings. All animal experiments were approved by the Ethics Commission on Animal Use at Jilin University first hospital (approval number: 20240292). We intravenously administered CGN-SLR to 4T1 tumor-bearing mice (tumor volume 1000 mm3) through the tail vein. Utilizing the animal fluorescence imaging system, observations revealed that at 1 h post-injection, CGN-SLR exhibited systemic distribution, with noticeable accumulation at the tumor site becoming apparent around the 2 h mark, gradually diminishing by approximately 8 h. Correspondingly, the CGN dispersed throughout the body within 1 h after intravenous injection, gradually dissipating after 4 h, and no significant accumulation was observed at the tumor site (Fig. 4a). Studies have shown that passively targeted nanomaterials may only reach a small portion of solid tumors, and the permeability of tumor vasculature may not be as pronounced as suggested by the enhanced permeation and retention (EPR) effect hypothesis [24]. Therefore, actively targeted nanotechnology offers significant advantages in tumor diagnosis and treatment. Consequently, at the 4 h time point, mice were euthanized under anesthesia for organ imaging. We observed that tumor tissue exhibited a strong fluorescence signal in the CGN-SLR group compared to the CGN group (Fig. S13 in Supporting information).
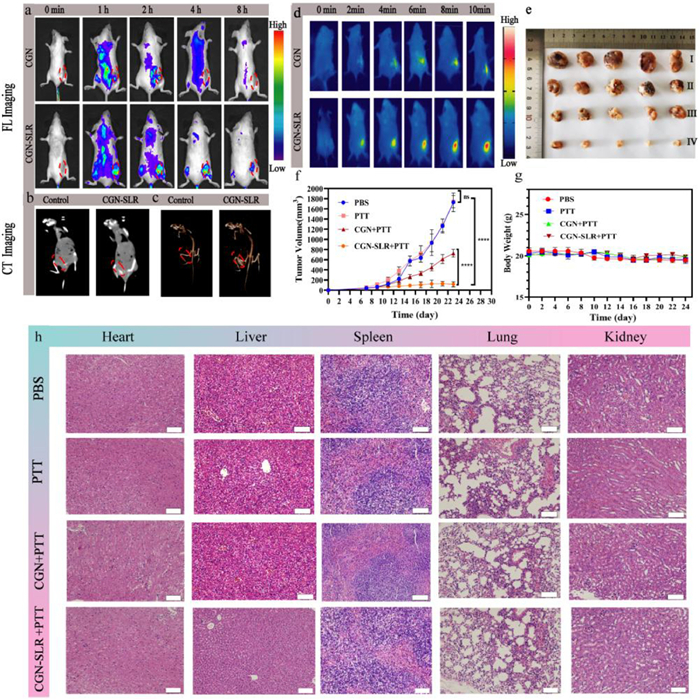
Given the conspicuous accumulation of CGN-SLR at the tumor site approximately 2 h post-injection, we conducted CT imaging. Remarkably, the CT signals at the tumor site displayed a marked enhancement (Figs. 4b and c). In summary, the imaging capability of CGN-SLR at the tumor site is superior to that of CGN. This also indicates that the modification with SLR enhances the uptake of CGN by TNBC tumor cells, thereby improving the imaging effectiveness at the tumor site.
To further evaluate the therapeutic effect of CGN-SLR on TNBC, we conducted experiments in 4T1 tumor-bearing BALB/c mice (4T1 cells are mouse-derived cells recognized as representative of TNBC). One week after the subcutaneous implantation of 4T1 cells, tumor volume was measured every 2 days. When the tumor volume reached 70 mm3, CGN-SLR was intravenously injected via the tail vein. After 2–3 h, the tumors were irradiated with an 808 nm laser at a power density of 2.0 W/cm2 for 10 min. After 10 min of irradiation with an 808 nm laser (2.0 W/cm2), the temperature at the tumor site in the CGN-SLR group rapidly increased to approximately 50 ℃ (Fig. 4d). This significant temperature rise can be attributed to the high enrichment of CGN-SLR at the tumor site. In contrast, the CGN group showed minimal temperature change. This observation further supports the potential of CGN-SLR for effective tumor PTT.
The treatment was repeated every 2 days for a total period of two weeks, and finally, tumor volume and weight outcomes were observed. In parallel, control groups were set up, including a PBS group, a PTT-only group, and a group treated with CGN followed by PTT. Notably, the results revealed a significant reduction in tumor volume within the CGN-SLR combined with PTT group compared to the other cohorts (Fig. 4e). Specifically, the tumor volume consistently remained below 100 mm3 in the targeted treatment group, while reaching approximately 800 mm3 in the CGN-treated combined with PTT group. Conversely, both the PTT-only and PBS groups exhibited tumor volumes around 1800 mm3, signifying minimal impact from these interventions (Fig. 4f). This discrepancy underscores the importance of SLR-mediated targeting in facilitating the accumulation of CGN at the tumor site, thereby augmenting the efficacy of PTT.
To confirm the physiological safety of CGN-SLR, we monitored the body weight of mice in all treatment groups throughout the experiment. Results indicated no significant weight loss in the CGN-SLR combined with the PTT treatment group (Fig. 4g). We further assessed hematological safety and potential effects on vital organs in BALB/c mice. Hemolysis experiments revealed that the hemolysis rate of CGN-SLR at a concentration of 500 µg/mL was below 5%, showing no significant statistical difference compared to the PBS group (Fig. S14 in Supporting information). Additionally, we examined the impact on major organs, including the heart, liver, spleen, lungs, and kidneys, across all treatment groups. As shown in Fig. 4h, compared to the PBS group, no significant changes were observed in the major organs of mice across all treatment groups. These findings underscore the overall safety profile of CGN-SLR in vivo. Therefore, we believe that CGN-SLR can enhance the efficacy of PTT by targeting TNBC, effectively inhibiting tumor growth while also demonstrating good in vivo biocompatibility.
In summary, we successfully developed a targeted CGN-SLR nanosystem for dual-modal FL and CT imaging-guided PTT against TNBC. The modification with SLR enabled precise targeting of TNBC cells by specifically recognizing luteinizing hormone releasing hormone receptors thereby enhancing the accumulation of the CGN-SLR nanosystem at tumor sites and improving its targeting specificity. This high targeting specificity facilitated accurate tumor localization through dual-modal imaging, offering a promising non-invasive approach for precise diagnosis of TNBC and guidance for cancer therapy. Furthermore, the targeted PTT strategy demonstrated superior tumor ablation efficacy compared to non-targeted systems, significantly inhibiting tumor growth in TNBC-bearing mice. Overall, the CGN-SLR nanosystem provides valuable insights and strategies for precise tumor diagnosis and treatment, holding great promise for advancing targeted therapies for TNBC.
The authors declare that they have no known competing financial interests or personal relationships that could have appeared to influence the work reported in this paper.
Lei Li: Writing – original draft, Software, Methodology, Investigation, Formal analysis. Annan Liu: Software, Resources, Methodology, Formal analysis, Data curation, Conceptualization. Gang Wei: Visualization, Supervision, Resources. Xingchen Li: Resources, Data curation, Conceptualization. Hao Liang: Resources, Investigation, Conceptualization. Maja D. Nešić: Writing – review & editing, Supervision. Ze Wang: Writing – review & editing, Visualization, Software, Methodology, Conceptualization. Hui Guo: Visualization, Supervision, Methodology, Conceptualization. Quan Lin: Writing – review & editing, Visualization, Supervision, Resources, Funding acquisition, Formal analysis, Data curation, Conceptualization.
This work was supported by the Natural Science Foundation of Jilin Province (No. SKL202302002). The authors are grateful for the technical assistance provided by Central Laboratory, Lequn Branch, and The First Hospital of Jilin University for conducting their tests.
Supplementary material associated with this article can be found, in the online version, at doi:
R.L. Siegel, K.D. Miller, A. Jemal, CA Cancer J. Clin. 65 (2015) 5–29. doi: 10.3322/caac.21254
M. Arnold, E. Morgan, H. Rumgay, et al., Breast 66 (2022) 15–23. doi: 10.1016/j.breast.2022.08.010
L.C. Collins, K.S. Cole, J.D. Marotti, et al., Mod. Pathol. 24 (2011) 924–931. doi: 10.1038/modpathol.2011.54
D. Trapani, O. Ginsburg, T. Fadelu, et al., Cancer Treat. Rev. 104 (2022) 102339. doi: 10.1016/j.ctrv.2022.102339
L. Li, B. Sun, J. Sun, L. Chen, Z. He, Chin. Chem. Lett. 35 (2024) 109538. doi: 10.1016/j.cclet.2024.109538
Y. Meng, S. Han, J. Yin, J. Wu, ACS Appl. Mater. Interfaces 15 (2023) 41743–41754. doi: 10.1021/acsami.3c08608
Z. Su, S. Dong, S.C. Zhao, et al., Drug Resist. Updat. 58 (2021) 100777. doi: 10.1016/j.drup.2021.100777
Z. Wang, T. Sha, J. Li, et al., Bioac. Mater. 39 (2024) 612–629.
H. He, L. Du, H. Xue, J. Wu, X. Shuai, Acta Biomater. 149 (2022) 297–306. doi: 10.1016/j.actbio.2022.07.003
H. He, L. Du, H. Xue, et al., Small Methods 7 (2023) e2300230. doi: 10.1002/smtd.202300230
D. Wang, T. Nie, C. Huang, et al., Small 18 (2022) e2203227. doi: 10.1002/smll.202203227
L. He, T. Nie, X. Xia, et al., Adv. Func. Mater. 29 (2019) 1901240. doi: 10.1002/adfm.201901240
J. Xu, Y. Lai, F. Wang, et al., Chin. Chem. Lett. 34 (2023) 108332. doi: 10.1016/j.cclet.2023.108332
H. Chen, B. Li, X. Ren, et al., Biomaterials 33 (2012) 8461–8476. doi: 10.1016/j.biomaterials.2012.08.034
Y. Jiang, Y. Cao, J. Wu, et al., Mater. Today Bio 25 (2024) 100960. doi: 10.1016/j.mtbio.2024.100960
Z. Wang, X. Ou, L. Guan, et al., Biosens. Bioelectron. 235 (2023) 115386. doi: 10.1016/j.bios.2023.115386
Y. Zheng, L. Lai, W. Liu, H. Jiang, X. Wang, Adv. Colloid Interface Sci. 242 (2017) 1–16.
Y. Dou, Y. Guo, X. Li, et al., ACS Nano 10 (2016) 2536–2548. doi: 10.1021/acsnano.5b07473
Z. Wang, H. Xing, A. Liu, et al., Acta Biomater. 166 (2023) 581–592. doi: 10.1016/j.actbio.2023.05.014
H. Chen, Z. Liu, O. Jiang, et al., Giant 8 (2021) 100073. doi: 10.1016/j.giant.2021.100073
J.H. Choi, B.K. Oh, J. Microbiol. Biotechnol. 24 (2014) 1291–1299. doi: 10.4014/jmb.1406.06055
H. Zhu, K. Ma, R. Ruan, et al., Chin. Chem. Lett. 35 (2024) 108536. doi: 10.1016/j.cclet.2023.108536
H. Peng, F. Yao, J. Zhao, et al., Exploration 3 (2023) 20220115. doi: 10.1002/EXP.20220115
Y. Li, J. He, J. Liu, W. Um, J. Ding, Nanomedicine 19 (2024) 2495–2504. doi: 10.1080/17435889.2024.2402677
X. Li, R. Yue, G. Guan, et al., Exploration 3 (2023) 20220002. doi: 10.1002/EXP.20220002
G. Yang, J. Ding, X. Chen, Wiley Interdiscip. Rev. Nanomed. Nanobiotechnol. 16 (2024) e1985. doi: 10.1002/wnan.1985
Y. Liu, M. Li, J. Ding, X. Chen, Chin. Chem. Lett. 36 (2025) 110146. doi: 10.1016/j.cclet.2024.110146
R. Wang, X. Hu, J. Yue, et al., J. Mater. Chem. B 1 (2013) 293–301. doi: 10.1039/C2TB00072E
H.S.A. Ghaly, P. Varamini, Endocr. Relat. Cancer 28 (2021) R251–R269. doi: 10.1530/erc-20-0442
C. Gründker, J. Ernst, M.D. Reutter, B.M. Ghadimi, G. Emons, Oncol. Rep. 26 (2011) 629–635.
C. Föst, F. Duwe, M. Hellriegel, et al., Oncol. Rep. 25 (2011) 1481–1487.
K. Zhao, D. Li, W. Xu, et al., Biomaterials 116 (2017) 82–94. doi: 10.1016/j.biomaterials.2016.11.030
J.D. Obayemi, S. Dozie-Nwachukwu, Y. Danyuo, et al., Mater. Sci. Eng. C: Mater. Biol. Appl. 46 (2015) 482–496. doi: 10.1016/j.msec.2014.10.081
L.E. Calderon, J.K. Keeling, J. Rollins, et al., Bioconjug. Chem. 28 (2017) 461–470. doi: 10.1021/acs.bioconjchem.6b00610
M.R. Dreher, W. Liu, C.R. Michelich, et al., J. Natl. Cancer Inst. 98 (2006) 335–344. doi: 10.1093/jnci/djj070
M. Fan, Y. Han, S. Gao, et al., Theranostics 10 (2020) 4944–4957. doi: 10.7150/thno.42471
J. Xu, M. Song, Z. Fang, et al., J. Control. Release 353 (2023) 699–712. doi: 10.1016/j.jconrel.2022.12.028
M. Yu, J. Zheng, ACS Nano 9 (2015) 6655–6674. doi: 10.1021/acsnano.5b01320
P. Zhang, D. Chen, L. Li, K. Sun, J. Nanobiotechnol. 20 (2022) 31. doi: 10.1186/s12951-021-01221-8
F. Giulimondi, L. Digiacomo, D. Pozzi, et al., Nat. Commun. 10 (2019) 3686. doi: 10.1038/s41467-019-11642-7
Z. Wang, X. Ren, Y. Li, et al., ACS Nano 18 (2024) 10288–10301. doi: 10.1021/acsnano.4c01625
H. Bao, S. Cheng, X. Li, et al., Biomaterials 288 (2022) 121731. doi: 10.1016/j.biomaterials.2022.121731
J. Zhang, C. Li, X. Zhang, et al., Biomaterials 42 (2015) 103–111. doi: 10.3901/JME.2015.02.103
Z. Zhang, M. Lu, C. Chen, et al., Theranostics 11 (2021) 3167–3182. doi: 10.7150/thno.52028
Y. He, L. Zhang, C. Song, Int. J. Nanomed. 5 (2010) 697–705.
S.S. Dharap, B. Qiu, G.C. Williams, et al., J. Control. Release 91 (2003) 61–73. doi: 10.1016/S0168-3659(03)00209-8
S. Zhang, H. Gao, G. Bao, ACS Nano 9 (2015) 8655–8671. doi: 10.1021/acsnano.5b03184
I. Canton, G. Battaglia, Chem. Soc. Rev. 41 (2012) 2718–2739. doi: 10.1039/c2cs15309b
K. Wang, Y. Xiang, W. Pan, et al., Chem. Sci. 11 (2020) 8055–8072. doi: 10.1039/d0sc03173a
Y. Yang, D. Hu, Y. Lu, et al., Acta Pharm. Sin. B 12 (2022) 2710–2730. doi: 10.1016/j.apsb.2021.08.021
Q. Jiang, L. Liu, Q. Li, et al., J. Nanobiotechnol. 19 (2021) 64. doi: 10.1007/978-3-030-86337-1_5
D. Jaque, L. Martínez Maestro, B. del Rosal, et al., Nanoscale 6 (2014) 9494–9530. doi: 10.1039/C4NR00708E
P. Wang, B. Chen, Y. Zhan, et al., Pharmaceutics 14 (2022) 2279. doi: 10.3390/pharmaceutics14112279
Z. Wang, L. He, S. Che, et al., J. Mater. Chem. B 10 (2022) 5182–5190. doi: 10.1039/d2tb00531j

Scheme 1 The preparation of CGN-SLR and utilized for target recognition and precise dual-mode imaging-guided PTT against TNBC. SLR-R: Sulfhydrated luteinizing releasing hormone receptor.

Figure 1 Characterization of CGN-SLR nano-system and the dual-mode imaging performance of CGN-SLR. (a) TEM image of CGN. (b) Particle size distribution of CGN. (c) TEM image of CGN-SLR. Scale bar: 20 nm. (d) Particle size distribution of CGN-SLR. (e) Zeta potential measurement. (f) Ultraviolet absorption spectrum of CGN-SLR and CGN. (g) FTIR confirms the successful conjugation between CGN and SLR. (h, i) XPS reveals the composition and valence structure of CGN-SLR. (j) Emission spectra of both CGN and CGN-SLR were obtained when excited at 410 nm. Inset: Photographic images of a CGN-SLR solution illuminated with a 410 nm wavelength. (k) Fluorescence intensity of CGN-SLR exposed under UV light for various periods. (l) The CT intensity variation of CGN-SLR was measured at different concentrations (50, 100, 200, 300, 400, and 500 µg/mL). Inset: CT images captured at varying mass concentrations of CGN-SLR.

Figure 2 Targeting specificity assays of CGN and CGN-SLR in MDA-MB-231 cells. (a) MDA-MB-231 cells were treated with CGN at 2, 4, and 6 h. (b) MDA-MB-231 cells were treated with CGN-SLR over the same periods. Scale bar: 50 µm. (c) Flow cytometry analysis (PB 450 channel) of the percentage of fluorescent-positive MDA-MB-231 cells after treatment with CGN and CGN-SLR for 2, 4, and 6 h. (d) Quantitative analysis of blue fluorescence areas in (a) using Image J software. (e) Statistical analysis of flow cytometry data from (c) using GraphPad Prism (9.5.1). Data are presented as mean ± standard deviation (SD) (n = 3). ****P < 0.0001.

Figure 3 Photothermal performance of the CGN-SLR nanosystem and in vitro evaluation of targeted PTT effects. (a) Temperature changes in CGN-SLR and PBS upon 808 nm laser irradiation at 2.0 W/cm2 for 10 min. (b) Temperature changes in CGN-SLR under varying laser power densities (1, 1.5, 2.0, 2.5, and 3.0 W/cm2) for 10 min. (c) Thermal cycling performance of CGN-SLR. (d) Infrared thermal images of PBS and CGN-SLR exposed to an 808 nm NIR laser at 2.0 W/cm2 for 10 min. (e) CCK-8 assay result of CGN and CGN-SLR upon 808 nm laser irradiation (2.0 W/cm2) for different durations (0, 2, 4, 8, and 10 min). (f) Co-staining of MDA-MB-231 cells with calcein-AM (live cells, green) and propidium iodide (dead cells, red) after different treatments. (g) Assessment of MDA-MB-231 cell migration 48 h post-treatment. Scale bar: 100 µm. (h) Visualization of apoptosis in MDA-MB-231 cells under control, CGN-SLR, single PTT, and CGN-SLR + PTT conditions. (i) Statistical analysis of migration data is depicted in (g). (j) Statistical analysis of apoptosis data is shown in (h). Data presented as mean ± SD (n = 3). P < 0.05, ***P < 0.001, ****P < 0.0001.

Figure 4 In vivo targeting fluorescence/CT imaging and assessment of targeted PTT efficacy and safety. (a) The tumor sites and fluorescence signals detected after intravenous injection of CGN and CGN-SLR with an animal fluorescence imaging system. (b) CT imaging of the tumor-bearing mouse before and 4 h after injection of CGN-SLR. (c) Three-dimensional CT imaging corresponding to the same mouse as shown in (b). (d) Thermal imaging of tumor-bearing mice following administration of CGN and CGN-SLR. (e) Post-experiment photographs of mice from each treatment group. Ⅰ, Ⅱ, Ⅲ, and Ⅳ represent the PBS, PTT, CGN+PTT, and CGN-SLR+PTT groups, respectively. (f) Tumor volume changes were monitored after treatments were administered every two days for two weeks across different treatment groups. ****P < 0.0001. (g) Body weight changes of mice in each group over the treatment period. (h) Histological examination (HE staining) of major organs at the end of the experiment. Scale bar: 50 µm. Data are presented as mean ± SD (n = 5).

 扫一扫看文章

扫一扫关注我们
 DownLoad:
 下载:
下载: