Henan Key Laboratory of Function-Oriented Porous Materials, College of Chemistry and Chemical Engineering, Luoyang Normal University, Luoyang 471934, China
b.
State Key Laboratory of Applied Organic Chemistry, Laboratory of Special Function Materials and Structure Design of the Ministry of Education, College of Chemistry and Chemical Engineering, Lanzhou University, Lanzhou 730000, China
c.
College of Chemistry and Pharmaceutical Engineering, Nanyang Normal University, Nanyang 473061, China
Received Date:
17 November 2024 Accepted Date:
19 January 2025 Revised Date:
13 January 2025 Available Online:
15 August 2025
Abstract:
Heterogeneous catalysts have attracted wide attention due to their remarkable oxygen evolution reaction (OER) capabilities. Herein, a one-step strategy involving the coupling of NixSey with CeO2 is proposed to concurrently construct heterogeneous interfaces, adjust phase structure, and regulate electronic configuration, thereby enhancing OER performance. Thanks to the role of CeO2 coupling in reducing the activation-energy and accelerating the reaction kinetics, the heterogeneous NixSey/CeO2 catalyst exhibits a low overpotential of 218 mV at 10 mA/cm2 and long-term stability (> 400 h) in 1.0 mol/L KOH for OER. Moreover, the post-OER characterization reveals that the NixSey matrix is reconstructed into NiOOH, while the incorporated CeO2 nanocrystals self-assemble into larger polycrystalline particles. Theoretical analysis further demonstrates that the optimized electronic states at NiOOH/CeO2 interfaces can modulate intermediate chemisorption toward favorable OER kinetics. This study offers fresh perspectives on the synthesis and structure-activity relationship of CeO2-coupled electrocatalysts.
Hydrogen production through water electrolysis is one of the most promising technologies for clean energy production [1, 2]. Unfortunately, its extensive application is greatly hindered due to the sluggish kinetics for the anodic oxygen evolution reaction (OER) [3]. Although noble metal oxides such as RuO2 and IrO2 have emerged as the benchmark of OER electrocatalysts, high cost and poor durability under high current densities limit their widespread use [4, 5]. Therefore, various low-cost and stable electrocatalysts with high OER performance in basic electrolytes have been widely designed and investigated [6-8]. Among them, nickel-based selenides are attractive owing to their controllable synthesis, favorable redox activity, exceptional conductivity, and commendable corrosion resistance [9, 10]. However, the OER performance of monometallic selenides often falls short of practical requirements due to their insufficient active sites, inadequate durability, and unsatisfactory hydrophilicity [11].
One effective strategy involves coupling Ni-based selenides with other components through interfacial engineering to fabricate composite materials with abundant heterogeneous interfaces, thereby bringing catalytic efficiency beyond what single Ni-based selenides can offer. At heterogeneous interfaces, lattice strain could expose a greater number of active sites, while the variations in energy band structure result in alterations in charge distribution and adsorption free energy of reaction intermediates [12-14]. Consequently, synergistic effects make heterostructures exhibit better electrocatalytic performance than individual materials. Ceria (CeO2), an important rare earth metal oxide, has been widely employed as a promoter to enhance OER activity and stability due to its high oxygen release/storage rate, remarkable anticorrosion ability, and strong electron interaction with other matrices [15-17]. The CeO2-coupled heterostructures have exhibited respectable electrocatalytic OER performance [18-20]. However, in these studies, the electrocatalysts could only sustain continuous operation for several tens of hours at a relatively low current density (e.g., 10–100 mA/cm2), which falls short of meeting the requirements for industrial applications. Besides, when developing CeO2-coupled heterostructures, the complex two-step method of merging separately pre-synthesized materials is often adopted, which tends to involve tedious solvothermal process and high-temperature calcination. Therefore, it is imperative to pursue a simple method for the precise synthesis of CeO2-incorporated heterostructures to fine-tune catalytic properties. More importantly, for numerous CeO2-decorated electrocatalysts, researchers are always focusing on the electrochemical reconstruction of host materials (e.g., oxides, sulfides, phosphides) and ignoring the variations in microstructures such as morphology, valence state, and crystal structure of CeO2 promoter under OER conditions [21-24]. Thus, constructing a NixSey/CeO2 electrocatalyst that combines easy synthesis with excellent performance to explore the structural transformation and interaction of these two types of materials during OER process is still a valuable research topic.
Herein, CeO2-coupled NixSey catalysts on Ni foam (donated as Ni–Se–Ce/NF) were synthesized through a simple one-step electrodeposition method. The nanoscale CeO2 and NixSey matrix are tightly coupled and the CeO2 induces strong electron interaction of Ni, Se and Ce. The Ni–Se–Ce/NF-2 (with an optimal composition of Ni: Ce = 5:1) electrode shows a low overpotential of 218 mV at 10 mA/cm2 in 1.0 mol/L KOH electrolyte. Meanwhile, the durability test of the electrode can exceed 400 h during the process of increasing the current density from 20 mA/cm2 to 300 mA/cm2. Additionally, systematic characterization reveals that the NixSey transforms into low crystalline NiOOH after OER test, while the coupled CeO2 nanocrystals undergo a phase segregation and self-assemble into larger polycrystalline particles. Theoretical calculations further validate that the electronic structure of NiOOH/CeO2 is effectively modulated by harnessing the synergistic effects between CeO2 and NiOOH, thereby lowering the energy barrier of rate-determining step in the OER process and enhancing the reaction kinetics.
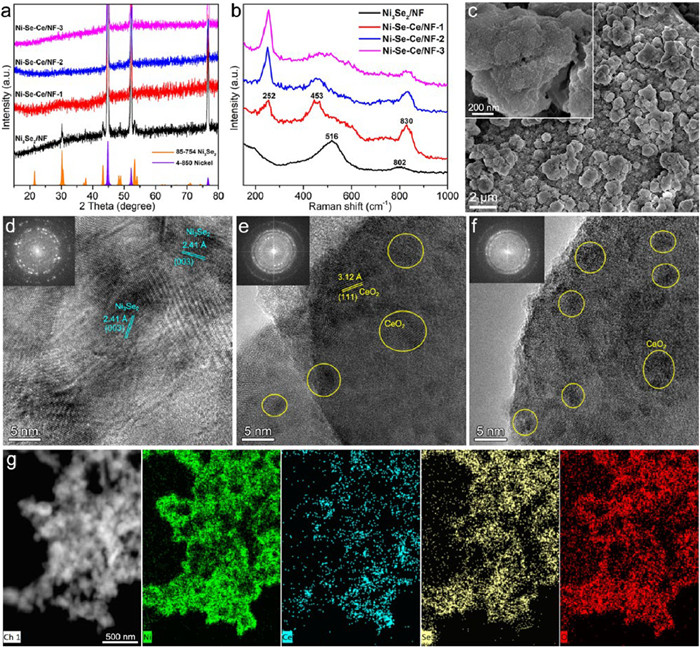
In the X-ray diffraction (XRD) patterns (Fig. 1a), the diffraction peaks at 30.2°, 37.5°, 43.3°, and 53.3° can be assigned to the (110), (003), (202), and (122) planes of rhombohedral Ni3Se2 (JCPDS No. 85–754), indicating the achievement of Ni3Se2 crystals at the deposition potential of −0.6 Ⅴ (vs. SCE). The reaction mechanism of this electrodeposition process is described in Supporting information. Interestingly, the characteristic diffraction peaks of Ni3Se2 are no longer observed in the XRD patterns of the obtained Ni–Se–Ce/NF-1, Ni–Se–Ce/NF-2, and Ni–Se–Ce/NF-3. Meanwhile, there are no peaks related to Ce compounds. This result indicates that the introduction of Ce(NO3)3·6H2O affects the nucleation and growth of Ni3Se2 during the electrodeposition process, thus altering its crystal structure and causing a decrease in crystallinity. In Raman spectra (Fig. 1b), for Ni3Se2/NF, the peaks located at ~516 and 802 cm−1 can be assigned to the Tg mode of Ni-Se bond and antisymmetric Se-O stretching mode, respectively [25, 26]. The spectra obtained for the Ni–Se–Ce/NF-1, Ni–Se–Ce/NF-2, and Ni–Se–Ce/NF-3 exhibit two peaks at ~453 and ~252 cm−1, which can be ascribed to the characteristic F2g mode and second-order transverse acoustic mode of CeO2 fluorite phase, respectively [27]. And the peak at ~830 cm−1 is attributed to the symmetric Se-O stretching mode [26]. The disappearance of Ni-Se vibration modes and the appearance of Ce–O bond demonstrate that the introduction of Ce ions indeed has a significant impact on the crystal structure of the deposited products. As shown in the scanning electron microscopy (SEM) image (Fig. S1 in Supporting information), a layer of Ni3Se2 crystal is densely coated on the surface of NF, and these Ni3Se2 bulk crystals are actually composed of numerous grains with a size of less than 20 nm. The energy dispersive X-ray (EDX) elemental mapping demonstrates the homogeneous distribution of Ni and Se in Ni3Se2/NF (Fig. S2 in Supporting information). The atomic ratio of Ni: Se is 56.7:43.3 as detected by EDX mapping (Fig. S3 in Supporting information), which is close to the stoichiometric ratio of 3:2 and further proves that the Ni3Se2 crystals are successfully synthesized. Compared with Ni3Se2/NF, the introduction of Ce ions also has a significant impact on the morphology of the products (Fig. 1c and Fig. S4 in Supporting information). When the molar ratio of Ni/Ce in the electrolyte is 8:1 and 5:1, the grain size of synthesized Ni–Se–Ce is smaller than that of Ni3Se2 grains, which is advantageous to the mass transport. When the molar ratio of Ni/Ce is changed to 2:1, the obtained Ni–Se–Ce grains begin to show the morphology of nanosheets.
Figure 1
Figure 1.
(a) XRD patterns and (b) Raman spectra of Ni3Se2/NF, Ni–Se–Ce/NF-1, Ni–Se–Ce/NF-2, and Ni–Se–Ce/NF-3. (c) SEM image of Ni–Se–Ce/NF-2. HRTEM images of (d) Ni3Se2/NF and (e-f) Ni–Se–Ce/NF-2. Inset: FFT patterns. (g) Dark-field TEM image and the corresponding elemental mappings of Ni, Se, Ce, and O.
The high-resolution transmission electron microscopy (HRTEM) images of Ni3Se2 particle display clear crystal lattice fringes with different orientations (Fig. 1d and Fig. S5 in Supporting information). The fringes with interplanar spacings of 2.41 and 4.24 Å are corresponded to the (003) and (101) planes of rhombohedral Ni3Se2, respectively. The corresponding fast Fourier transform (FFT) patterns show several discernible diffraction rings composed of a large number of spots, suggesting the polycrystalline structure and high crystallinity of the grains for the Ni3Se2 catalyst. In contrast, no long-range ordered lattice fringes are observed in the HRTEM images of Ni–Se–Ce/NF-2 (Figs. 1e and f), but abundant quantum dot-like nanoparticles with sizes around 5 nm (circled by yellow lines) are distributed. These nanoparticles exhibit the atomic fringes with interplanar spacing of 3.12 Å indexing to the (111) planes of cubic CeO2, indicating that the CeO2 nanoparticles generated after the electrodeposition are embedded into the host material. Also, the fuzzy FFT patterns further illustrate that CeO2-incorporation significantly reduces the crystallinity of Ni3Se2 bulk phase, consistent with XRD results. The EDX mapping demonstrates that the CeO2 nanoparticles are in full contact with Ni3Se2 bulk phase due to the high overlap in the mapping (Fig. 1g), which would provide numerous heterogeneous interfaces. The EDX result also reveals that the atomic ratio of Ni: Ce is 5.8:1 (Fig. S6 in Supporting information), approaching the results obtained by inductively coupled plasma (ICP) measurement (6.2:1) as well as the feed ratio (5:1) (Table S1 in Supporting information).
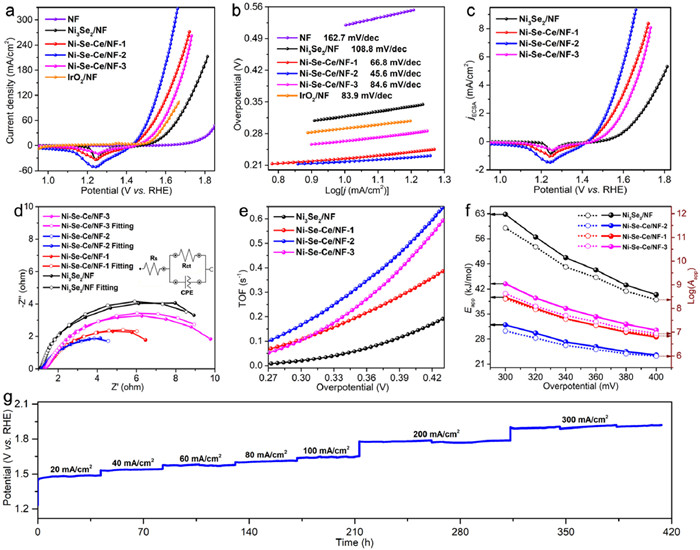
The electrocatalytic OER performance of the as-obtained catalysts was evaluated in 1.0 mol/L KOH on a typical three-electrode configuration. The iR-corrected linear sweep voltammetry (LSV) curves display that the OER activity of Ni3Se2 is dramatically enhanced by the coupling of CeO2. Specifically, driving a current density of 10 (or 100) mA/cm2, the overpotentials of 225 (or 359), 218 (or 312), 264 (or 399), 318 (or 480) mV, and 291 (or 432) mV are needed for the Ni–Se–Ce/NF-1, Ni–Se–Ce/NF-2, Ni–Se–Ce/NF-3, Ni3Se2/NF, and IrO2/NF electrodes, respectively (Fig. 2a). Moreover, the Tafel slope (45.6 mV/dec) of Ni–Se–Ce/NF-2 is much smaller than those of Ni–Se–Ce/NF-1 (66.8 mV/dec), Ni–Se–Ce/NF-3 (84.6 mV/dec), Ni3Se2/NF (108.8 mV/dec), and IrO2/NF (83.9 mV/dec), reflecting its fastest OER kinetics (Fig. 2b). By comparison, it can be seen that the OER activity of Ni–Se–Ce/NF-2 ranks among the top in various Ce-containing OER electrocatalysts (Table S2 in Supporting information). The double-layer capacitances (Cdl) can be estimated from the cyclic voltammetry (CV) curves in the non-Faradaic region (Fig. S7 in Supporting information). The results show that the Cdl values of Ni–Se–Ce/NF-1 (1.3 mF/cm2), Ni–Se–Ce/NF-2 (1.4 mF/cm2), and Ni–Se–Ce/NF-3 (1.3 mF/cm2) are slightly lower than that of Ni3Se2/NF (1.6 mF/cm2) (Fig. S8 in Supporting information). And the electrochemically active surface area (ECSA)-normalized LSV curves for the as-obtained electrodes suggest the boosted intrinsic OER activity of Ni–Se–Ce/NF-2 owing to the incorporation CeO2 (Fig. 2c). In addition, the Nyquist plots and the fitted data indicate that the value (5.85 Ω) of R for Ni–Se–Ce/NF-2 is much smaller than that of Ni3Se2/NF (9.89 Ω) (Fig. 2d and Table S3 in Supporting information), reconfirming that CeO2-coupling can effectively enhance the OER kinetics. Furthermore, the Ni–Se–Ce/NF catalysts exhibit obviously higher turnover frequency (TOF) values than pristine Ni3Se2/NF (Fig. 2e and Fig. S9 in Supporting information), identifying that the coupling of CeO2 can greatly enhance the intrinsic activity for catalyzing OER, and the most striking optimization effect is when the Ni/Ce atomic ratio approaches 5:1. The reaction-controlled mechanism for the as-prepared electrodes is determined by performing CV tests at different scan rates (Figs. S10 and S11 in Supporting information). The value of b obtained from cathodic peaks indicates that the concentration polarization or mass transport for the Ni–Se–Ce/NF-2 electrode controls the reaction due to the faster surface electrochemical reaction rate compared with Ni3Se2/NF. The temperature-dependent kinetic analysis is used to assess the influence of CeO2-coupling on the apparent activation energy (marked as Eapp) of the as-prepared catalysts. LSV curves without iR-compensation are measured under the temperature from 25 ℃ to 55 ℃ (Fig. S12 in Supporting information). Based on the Arrhenius equation [28-30], the Eapp values for Ni–Se–Ce/NF electrodes under different overpotentials are lower than that of Ni3Se2/NF electrode (Fig. 2f and Fig. S13 in Supporting information), illustrating that the activation enthalpy and binding energy barrier of OER intermediates have been optimized after coupling CeO2 with the NixSey matrix. A multi-step chronopotentiometric method is used to evaluate the durability of Ni–Se–Ce/NF-2 electrode (Fig. 2g). At a current density of 20 mA/cm2, the voltage of Ni–Se–Ce/NF-2 electrode stabilizes at approximately 1.48 Ⅴ (vs. RHE). As the current density is varied, the voltage of Ni–Se–Ce/NF-2 electrode can remain stable quickly. Even if the current density increases to 300 mA/cm2, Ni–Se–Ce/NF-2 electrode can continue to operate stably for more than 100 h, indicating its outstanding durability.
Figure 2
Figure 2.
(a) iR-corrected LSV curves. (b) Tafel plots. (c) ECSA-normalized OER polarization curves. (d) Nyquist plots. Inset: equivalent circuit. (e) TOF plots. (f) The Eapp values calculated from CV plots obtained under different temperatures (Figs. S12 and S13 for detailed information). The values of log(Aapp) acquired from the intercept at a constant potential via utilizing the Arrhenius plots during the calculation of Eapp values (Fig. S13). (g) Multi-step galvanostatic durability test of Ni–Se–Ce/NF-2 at the different current densities.
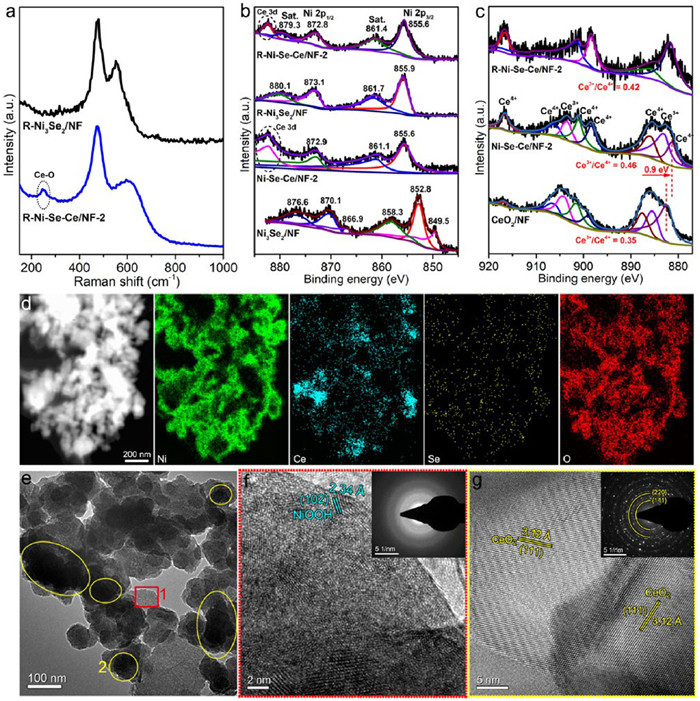
In order to investigate the true structure-activity relationship, we also need to characterize and analyze the catalysts after OER testing, namely R–Ni3Se2/NF and R–Ni–Se–Ce/NF-2. The ICP results show that there are only trace Ni and Ce in the used electrolyte, while the concentration of Se is high, indicating that a large amount of Se species leaches out during the electro-oxidation process (Table S1). The main peaks at ~475 and ~557 cm−1 of the Raman spectra (Fig. 3a) for R–Ni3Se2/NF and R–Ni–Se–Ce/NF-2 can be assigned to the Eg bending and A1g stretching bands of NiOOH, respectively [31, 32]. Moreover, the peak located at ~252 cm−1 which corresponds to the Ce–O vibrational mode can still be observed in the Raman spectrum of R–Ni–Se–Ce/NF [27]. This implies that Ni3Se2 was reconstructed into NiOOH during the OER test, and for the R–Ni–Se–Ce/NF-2 electrode, the catalytically active species should be NiOOH/CeO2. XPS was taken to analyze the surface electronic states of Ni3Se2/NF and Ni-Se-Ce/NF-2 before and after the OER test. Clearly, the signal peaks of Ni 2p for the Ni-Se-Ce/NF-2 display positive shift of about 2.8 eV relative to that of Ni3Se2/NF (Fig. 3b), indicating the incorporation of CeO2 dramatically affects the coordination environment of Ni atoms, leading to a decrease in electron density around Ni atoms. After OER test, the Ni 2p XPS profile of R–Ni–Se–Ce/NF-2 is similar to that of R–Ni3Se2/NF except for a negative shift of 0.3 eV, suggesting obvious electronic interaction between NiOOH and CeO2. As for Se 3d spectra (Fig. S14 in Supporting information), compared with Ni3Se2/NF, the peaks of Se 3d for Ni-Se-Ce/NF-2 shift by ~1.0 eV to higher binding energy, validating the significant electron withdrawing effect of CeO2. After OER test, the peaks of Ni-Se bonds disappear completely, reflecting the dissolution of Se species and the structural decomposition of Ni3Se2/NF and Ni-Se-Ce/NF-2. Compared to CeO2/NF (Fig. S15 in Supporting information), the Ce 3d5/2 peak of Ni-Se-Ce/NF-2 shows a negative shift about 0.9 eV (Fig. 3c). The atomic ratio of Ce3+/Ce4+ in Ni-Se-Ce/NF-2 (0.46) is larger than that in CeO2/NF (0.35), meaning that the electrons transfer from Ni3Se2 to CeO2 and a part of Ce4+ is reduced to Ce3+ after getting the electrons. After OER test, the ratio of Ce3+/Ce4+ in R–Ni–Se–Ce/NF-2 is estimated to be 0.42, which is lower than that of Ni-Se-Ce/NF-2, suggesting a portion of Ce3+ is oxidized to a higher valence state during the OER process. In the O 1s spectra (Fig. S16 in Supporting information), the peak at 532.7 eV can be attributed to the adsorbed water while the peak at a lower binding energy (531.1–531.3 eV) is usually assigned to -OH groups (or low-coordinated oxygen defects) [33]. The binding energy at 529.4–530.3 eV is characteristic for the metal-oxygen bonds, including Ni/Ce–O(OH) [33]. Moreover, there are no characteristic diffraction peaks of NiOOH and CeO2 on the XRD pattern of R–Ni–Se–Ce/NF-2 (Fig. S17 in Supporting information), indicating the NiOOH/CeO2 active species have a polycrystalline or amorphous structure. The SEM image displays numerous irregular particles are still covered on the NF support without apparent exfoliation, indicating well-maintained morphology after the OER test (Fig. S18 in Supporting information). Interestingly, the EDX mapping test found the uniform distribution of Ni and O elements throughout the entire R–Ni–Se–Ce block, while Ce is relatively discrete, mainly concentrated on some large particles (Fig. 3d and Fig. S19 in Supporting information). And the undetectable Se signal reconfirms the severe dissolution of Se during the OER test. From the TEM image (Fig. 3e), it can be observed that the R–Ni–Se–Ce block presents two types of morphology overall that the thinner sheet-like regions (circled by the red line, Region 1) and the thicker irregular particles (circled by the yellow line, Region 2) interwoven together. The HRTEM image of Region 1 reveals a short-range ordered spacing of 2.34 Å (Fig. 3f and Fig. S20 in Supporting information), which matches well with the (102) planes of NiOOH, proving the successful generation of low-crystalline NiOOH species. The corresponding selected area electron diffraction (SAED) pattern show indistinguishable polycrystalline rings, validating the poor crystallinity of NiOOH. By comparison, the particles (Region 2) with concentrated distribution of Ce element exhibit the clear crystal lattices with an interplanar distance of 3.12 Å that can be assigned to the (111) planes of cubic CeO2 (Fig. 3g and Fig. S21 in Supporting information). It is evident that the CeO2 particles are self-assembled from numerous grains (several nanometers in size) with different orientations, and the interfaces among the grains are distinct. The corresponding SAED pattern further demonstrates that the CeO2 particles have a typical polycrystalline structure, and the bright rings from the inside to the outside can be indexed to the {111} and {220} planes of the cubic CeO2 (inset in Fig. 3g). These results prove that the embedded CeO2 nanocrystals would undergo a phase segregation and self-assembly during OER test, and the resulting NiOOH/CeO2 is the genuine active species.
Figure 3
Figure 3.
(a) Raman spectra. High-resolution XPS spectra of (b) Ni 2p and (c) Ce 3d (d) Dark-field TEM image and the corresponding elemental mapping images of R–Ni–Se–Ce/NF-2. (e) TEM image and (f, g) the corresponding HRTEM images of R–Ni–Se–Ce/NF-2. Inset: SAED patterns.
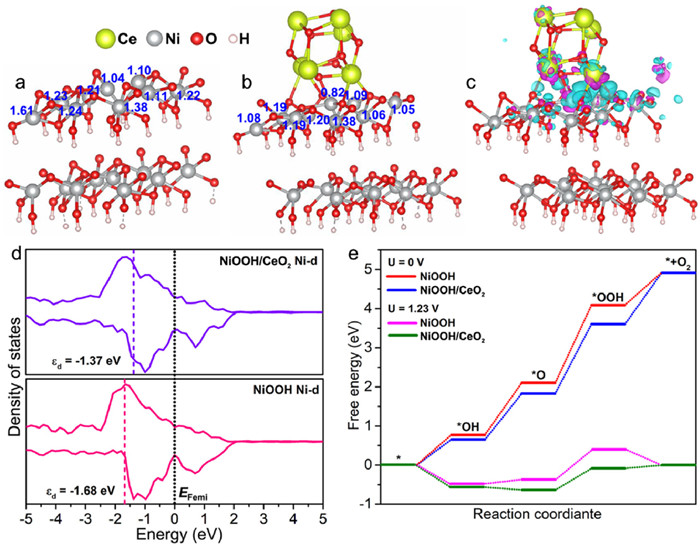
Theoretical calculations are further performed to clarify the fundamental factors of boosting OER performance by the introduction of CeO2 for NiOOH. Bader charge analysis reveals that the charge of Ni atoms at the interface in the NiOOH/CeO2 model is lower than that in the NiOOH model (Figs. 4a and b), implying the electrons are transferred from neighboring atoms to Ni atoms owing to CeO2-interfacing, agreed with the above XPS analysis. Further support for this phenomenon is provided by the charge density difference diagram (Fig. 4c). The presence of CeO2 species results in the increase of electrons on NiOOH, compared to pure NiOOH model, which can strengthen the *OH adsorption at Ni sites. Furthermore, the d-band center (εd) of NiOOH/CeO2 model is calculated as −1.37 eV, higher than that of NiOOH model (−1.68 eV) (Fig. 4d), indicating that more valence electrons will enter above Fermi level, and the empty orbital will allow more valence electrons of the oxygen-containing intermediates to enter [34], [35]. Thus, the thermodynamics energy barrier of the OER process would be reduced for NiOOH/CeO2. In the four electron transfer pathways for the OER (Fig. 4e and Fig. S22 in Supporting information), the rate-determining step for NiOOH and NiOOH/CeO2 is the conversion of *O to *OOH due to the high free energy barrier (2.02 eV vs. 1.79 eV). Hence the theoretical OER overpotentials of NiOOH and NiOOH/CeO2 can be calculated as 0.79 and 0.56 Ⅴ, respectively, suggesting the improved OER activity of NiOOH/CeO2 compared to that of NiOOH. Theoretical findings corroborate that the electronic states of NiOOH can be effectively manipulated by combining CeO2, thereby optimizing the adsorption of oxygen-containing intermediates and improving the reaction kinetics.
Figure 4
Figure 4.
Bader charge diagrams of (a) NiOOH and (b) NiOOH/CeO2. (c) Charge density difference diagram. Cyan and violet represent electron accumulation and electron depletion, respectively. (d) Density of states for Ni-3d orbitals of NiOOH and NiOOH/CeO2. (e) Free-energy diagrams for the OER pathway on NiOOH and NiOOH/CeO2 surfaces.
In summary, a NixSey/CeO2 heterostructure was synthesized via a simple one-step electrodeposition method. Experimental results confirm that the introduction of CeO2 not only affects the crystal structure of deposited NixSey but also alters the charge distribution. The optimized Ni–Se–Ce/NF-2 electrode exhibits favorable OER activity in alkaline medium with an overpotential of 218 mV at 10 mA/cm2 and remarkable stability (> 400 h), superior to most of the reported analogues. The results of fitted electrochemical impedance spectra, calculated apparent activation energy, and obtained reaction-controlled mechanism illustrate that the OER kinetics of Ni-Se-Ce/NF-2 was accelerated attributing to CeO2-coupling. The post-OER characterization uncovered that the NixSey matrix is reconstructed into NiOOH, while the embedded CeO2 nanocrystals self-assemble into larger polycrystalline particles. Theoretical calculations further verify that the coupling of CeO2 regulates the electronic states of Ni sites and lowers the energy barrier of the OER intermediate reaction. This study offers a deeper understanding for the structure and electrochemical reconstruction of CeO2-coupled OER catalysts.
Declaration of competing interests
The authors declare that they have no known competing financial interests or personal relationships that could have appeared to influence the work reported in this paper.
CRediT authorship contribution statement
Kailu Guo: Writing – original draft, Funding acquisition, Data curation, Conceptualization. Jinzhi Jia: Methodology, Formal analysis, Data curation. Huijiao Wang: Validation, Supervision, Data curation. Ziyu Hao: Supervision, Methodology, Formal analysis, Data curation. Yinjian Chen: Validation, Supervision, Data curation. Ke Shi: Supervision, Formal analysis, Data curation. Haixia Wu: Supervision, Resources, Formal analysis. Cailing Xu: Writing – review & editing, Validation, Supervision, Resources, Conceptualization.
Acknowledgments
This work was supported by the grants from the National Natural Science Foundation of China (No. 22202098) and the Natural Science Foundation of Henan Province (No. 242300420199). We thank the Electron Microscopy Centre of Lanzhou University for the TEM measurements and structural analysis.
Supplementary materials
Supplementary material associated with this article can be found, in the online version, at doi:10.1016/j.cclet.2025.110888.
[1]
R. Ram, L. Xia, H. Benzidi, et al., Science 384 (2024) 1373–1380. doi: 10.1126/science.adk9849
M. Zhao, J. Wang, C. Wang, et al., Nano Energy 129 (2024) 110020.
[24]
Y. Li, J. Yi, R. Qin, et al., J. Colloid Interf. Sci. 661 (2024) 690–699. doi: 10.3390/mi15060690
[25]
K. Chaudhary, S. Zulfiqar, H.H. Somaily, et al., Electrochim. Acta 431 (2022) 141103.
[26]
J. Kretzschmar, N. Jordan, E. Brendler, et al., Dalton Trans. 44 (2015) 10508.
[27]
Y. Peng, K. Li, J. Li, Appl. Catal. B: Environ. 140-141 (2013) 483–492.
[28]
X. Chen, X. Xu, Y. Cheng, et al., Small 20 (2024) 2303169.
[29]
Y. Duan, N. Dubouis, J. Huang, et al., ACS Catal. 10 (2020) 4160–4170. doi: 10.1021/acscatal.0c00490
[30]
F. Abdelghafar, X. Xu, S.P. Jiang, et al., ChemSusChem 17 (2024) e202301534.
[31]
K. Guo, H. Li, J. Huang, et al., J. Energy Chem. 63 (2021) 651–658.
[32]
J. Huang, Y. Li, Y. Zhang, et al., Angew. Chem. Int. Ed. 58 (2019) 17458–17464. doi: 10.1002/anie.201910716
[33]
F. Luo, P. Yu, J. Xiang, et al., J. Energy Chem. 94 (2024) 508–516.
[34]
Y. Shi, W. Du, W. Zhou, et al., Angew. Chem. Int. Ed. 59 (2020) 22470–22474. doi: 10.1002/anie.202011097
[35]
H.B. Tao, L. Fang, J. Chen, et al., J. Am. Chem. Soc. 138 (2016) 9978–9985. doi: 10.1021/jacs.6b05398
Figure 1
(a) XRD patterns and (b) Raman spectra of Ni3Se2/NF, Ni–Se–Ce/NF-1, Ni–Se–Ce/NF-2, and Ni–Se–Ce/NF-3. (c) SEM image of Ni–Se–Ce/NF-2. HRTEM images of (d) Ni3Se2/NF and (e-f) Ni–Se–Ce/NF-2. Inset: FFT patterns. (g) Dark-field TEM image and the corresponding elemental mappings of Ni, Se, Ce, and O.
Figure 2
(a) iR-corrected LSV curves. (b) Tafel plots. (c) ECSA-normalized OER polarization curves. (d) Nyquist plots. Inset: equivalent circuit. (e) TOF plots. (f) The Eapp values calculated from CV plots obtained under different temperatures (Figs. S12 and S13 for detailed information). The values of log(Aapp) acquired from the intercept at a constant potential via utilizing the Arrhenius plots during the calculation of Eapp values (Fig. S13). (g) Multi-step galvanostatic durability test of Ni–Se–Ce/NF-2 at the different current densities.
Figure 3
(a) Raman spectra. High-resolution XPS spectra of (b) Ni 2p and (c) Ce 3d (d) Dark-field TEM image and the corresponding elemental mapping images of R–Ni–Se–Ce/NF-2. (e) TEM image and (f, g) the corresponding HRTEM images of R–Ni–Se–Ce/NF-2. Inset: SAED patterns.
Figure 4
Bader charge diagrams of (a) NiOOH and (b) NiOOH/CeO2. (c) Charge density difference diagram. Cyan and violet represent electron accumulation and electron depletion, respectively. (d) Density of states for Ni-3d orbitals of NiOOH and NiOOH/CeO2. (e) Free-energy diagrams for the OER pathway on NiOOH and NiOOH/CeO2 surfaces.

 DownLoad:

 下载:
下载:


