College of Chemistry, Chemical Engineering and Materials Science, Soochow University, Suzhou 215123, China
b.
Jiangsu Key Laboratory for Environment Functional Materials, School of Materials Science and Engineering, Suzhou University of Science and Technology, Suzhou 215009, China
Received Date:
19 September 2024 Accepted Date:
06 January 2025 Revised Date:
25 December 2024 Available Online:
15 February 2026
Abstract:
The insufficient performance of Pt and Pd benchmark catalysts remains a significant obstacle to the practical application of direct liquid fuel cells. In this study, we report a synthesis of amorphous PdSe/crystalline Pt nanoparticles (AC-PdPtSe NPs) by chemical leaching of PdPtSe NPs. AC-PdPtSe NPs display significantly enhanced activity and stability for the electrooxidation of ethylene glycol and glycerol, far surpassing that of amorphous-dominant PdPtSe NPs, commercial Pd/C, and Pt/C catalysts. Notably, the integration of crystalline and amorphous domains leverages the advantages of high electrical conductivity and a wealth of active sites, which can substantially accelerate reaction kinetics. Furthermore, detailed investigations reveal that the boundary between the Pt crystalline and PdSe amorphous phases induces a 3% surface tensile strain. The formation of amorphous-crystalline heterointerfaces optimizes the d-band states, thereby strengthening the adsorption and activation of ethylene glycol and glycerol. This study highlights the advance in phase engineering toward the development of highly active noble-metal nanostructures.
There is an increasing interest in the extraction of energy from chemical bonds for a clean and sustainable future [1-3]. Direct liquid fuel cells (DLFCs), as an efficient energy conversion technology, feature converting the chemical energy of small organic molecules into electrical energy through electrochemical processes. A wide variety of small organic molecules have been used as fuels, including methanol, ethanol, formic acid, ethylene glycol, and glycerol [4-6]. Even though methanol is the most investigated fuel, polyhydric alcohols are attracting more research attention. Polyhydric alcohols exhibit less volatile and toxic, higher theoretical energy density, and negligible cross-over compared to methanol [7-9]. Therefore, the development of direct ethylene glycol and glycerol fuel cells is of great importance for the practical application of DLFCs.
Thermodynamics has revealed the theoretical advantages of DLFCs, but kinetics barriers severely limit the energy conversion in these electrochemical devices [10-12]. In this regard, ethylene glycol and glycerol oxidation reactions (EGOR and GOR) suffer from sluggish kinetics brought by the multi-electron transfer [13-15]. Phase engineering in noble-metal electrocatalysts has been regarded as an appealing strategy to improve the kinetic limitations of the anode [16-18]. Previous efforts in phase engineering mainly focus on the formation of amorphous or unconventional phases of noble-metal electrocatalysts [19-21]. Amorphous materials are advantageous in terms of high surface reactivity and structural flexibility, which render them promising catalysts for electrooxidation catalysis [22-24]. However, the thermodynamically unstable amorphous phase is limited by weak conductivity and poor solubility resistance that deteriorate to catalytic activity and stability [25,26]. Crystalline materials are featured with corrosion resistance that is beneficial to stable electrocatalysis. It is rational to fabricate efficient electrocatalysts by the combination of the amorphous phase and crystalline phase, defined as amorphous-crystalline (A-C) heterostructures. However, excessive occupancy of the amorphous domain over the catalyst surface leads to a negative effect on catalytic performance. Hence, the balance of the amorphous and crystalline domains also plays a vital role in the designing of active and durable electrocatalysts.
Herein, we transform amorphous PdSe nanoparticles (A-PdSe NPs) into PdPtSe heterostructure with dense A-C interfaces (AC-PdPtSe NPs). PdSe NPs with weak metal-nonmetal bonding are chosen as the amorphous domain controller and then co-reduction of Pt precursor generates the amorphous-dominant PdPtSe NPs. Finally, AC-PdPtSe NPs are fabricated through the chemical leaching of PdPtSe NPs. Detailed characterizations demonstrate that partial Se species are removed and the crystallinity of AC-PdPtSe NPs increases. The coupling of crystalline Pt and amorphous PdSe generates rich A-C heterointerfaces. The high-density A-C phase boundaries induce the formation of lattice-stretched Pt sites, which facilitate the adsorption and activation of ethylene glycol and glycerol. The AC-PdPtSe NPs deliver outstanding performance for EGOR and GOR, which greatly outperformed the low-crystallinity counterparts, commercial Pt/C, and Pd/C. This study provides a new paradigm for phase engineering in noble-metal nanostructures.
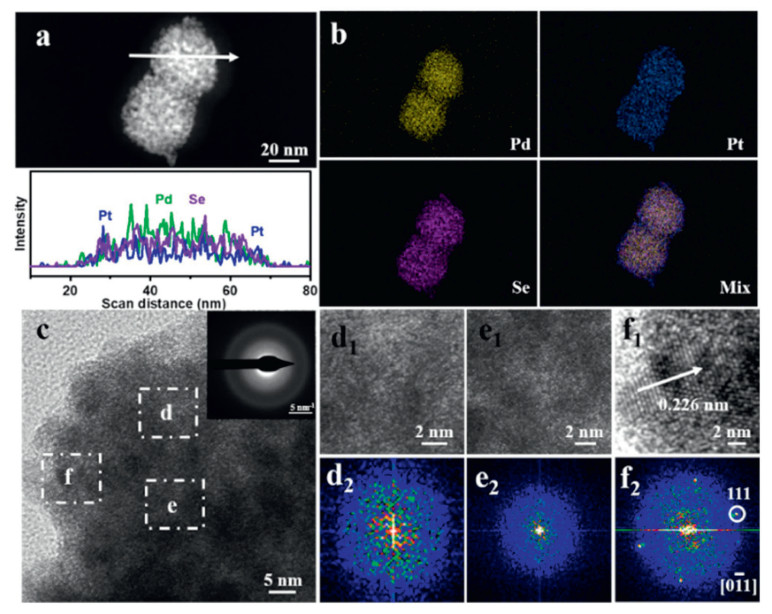
A-PdSe NPs are prepared via the reduction of Pd(acac)2 and C14H14Se2 in ethylene glycol. The amorphous structure of A-PdSe NPs is confirmed by the disordered lattice in the high-resolution TEM images (Fig. S1 in Supporting information). As shown in Fig. S2 (Supporting information), A-PdSe exhibits poor performance in EGOR and GOR owing to the amorphous structure and excessive blocking of active sites. To improve the catalytic property, Pt species are introduced into the amorphous structure to form PdPtSe NPs through a metal co-reduction method. As shown in Figs. 1a and b, Pt is slightly enriched on the surface, while Pd and Se are mainly concentrated inside the NPs. The annular diffraction pattern in the SAED confirms the low crystallinity of PdPtSe NPs (inset of Fig. 1c). The enlarged HRTEM images (Figs. 1d1 and e1) and diffuse-ring in the FFT patterns (Figs. 1d2 and e2) of amorphous domains reveal the disordered structure inside the NPs. As displayed in Fig. 1f1, the lattice spacing of the crystalline domain is 0.226 nm, corresponding to the Pt(111) plane of the face-centered cubic (fcc) phase. The bright spots in the FFT pattern (Fig. 1f2) further confirm the crystalline structure of Pt in the edge area. After incorporating Pt species, we could obtain amorphous-dominant PdPtSe NPs.
Figure 1
Figure 1.
(a) HAADF-STEM image and corresponding line-scan analysis, (b) elemental mapping images, (c) HRTEM image, the inset in (c) is the SAED pattern, (d1, e1, f1) enlarged HRTEM images of amorphous domain and crystalline domain, (d2, e2, f2) FFT image of amorphous domain and crystalline domain of PdPtSe NPs.
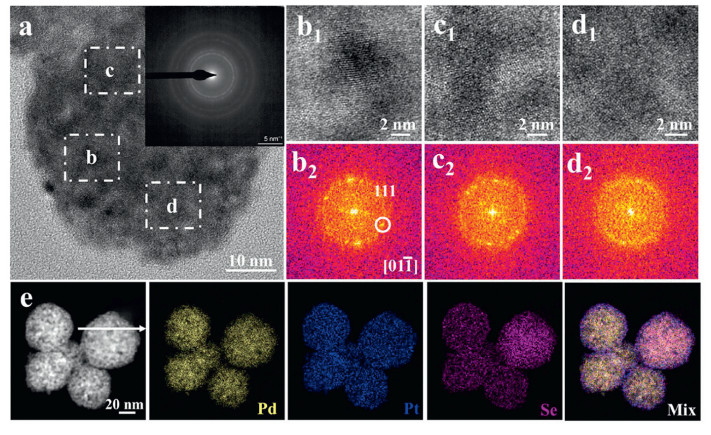
It is well-known that nonmetal Se exhibits bad corrosion resistance and noble metals Pd and Pt display well stability in alkaline medium. To achieve structural transformation, an etching treatment was employed in the KOH solution to tune the composition and phase structure of PdPtSe NPs (details are given in Supporting information). PdPtSe NPs were immersed in 20 mol/L KOH solution at 100 ℃. The reaction between Se and KOH can be formulated as 3Se + 6KOH = K2SeO3 + 2K2Se + 3H2O. Partial Se was removed from the surface and dissolved into the solution while Pd and Pt remained in the catalyst. The SEM-EDS measurement reveals the composition evolution after surface reconstruction (Fig. S3 in Supporting information). To be more specific, the Pt: Pd: Se atomic ratio for PdPtSe NPs evolves from 28.7:24.0:47.3 into 34.6:33.3:32.1 for AC-PdPtSe NPs. Unlike PdPtSe NPs, AC-PdPtSe NPs exhibit annular and spot diffraction in the SAED pattern (inset of Fig. 2a), suggesting the coexistence of crystalline and amorphous structures. In Figs. 2b1 and c1, HRTEM images confirm the presence of abundant A-C phase boundaries, while the A-C domains display diffuse-ring and diffraction spots in the FFT patterns (Figs. 2b2 and c2). The bright spots in the FFT pattern belong to the fcc [01¯1] diffractogram. Moreover, the amorphous domain could remain after etching (Figs. 2d1 and d2). The elemental mapping images (Fig. 2e) and line-scan analysis (Fig. S4 in Supporting information) reveal that Pd, Se, and Pt elements exhibit enrichment areas, respectively. Specifically, the Pt element is enriched at the edges, while Pd and Se elements are mainly concentrated in the middle region.
Figure 2
Figure 2.
(a) HRTEM image, the inset in (a) is the SAED pattern, (b1, c1, d1) enlarged HRTEM images of amorphous domain and crystalline domain, (b2, c2, d2) FFT image of amorphous domain and crystalline domain, (e) HAADF-STEM image and elemental mapping images of AC-PdPtSe NPs.
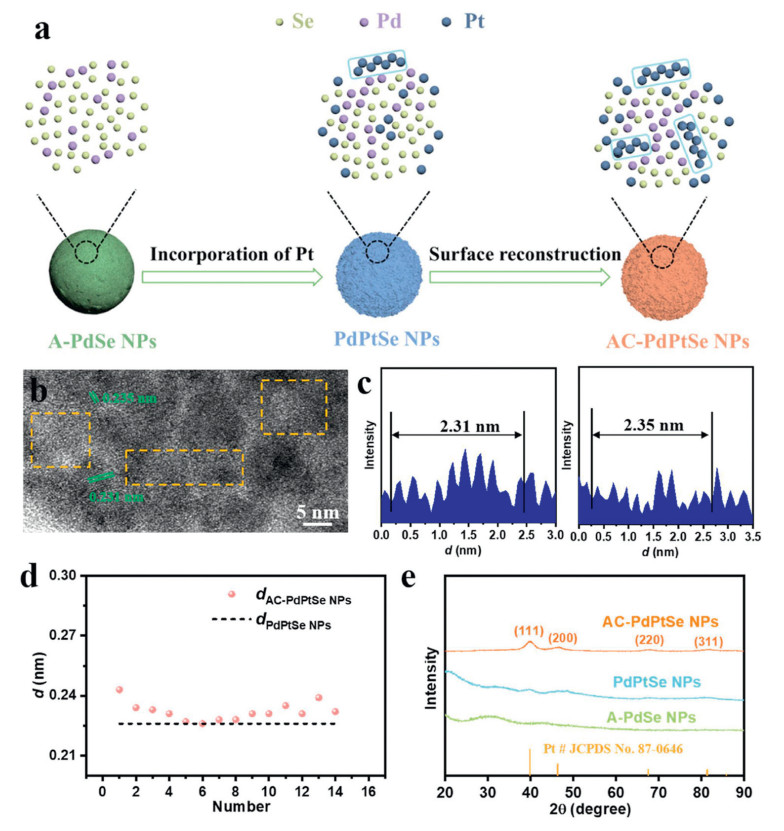
After the incorporation of Pt and surface reconstruction (Fig. 3a), AC-PdPtSe NPs display a distinctive A-C heterostructure associated with metal segregation. HRTEM images are employed to further investigate the atomic structure of AC-PdPtSe NPs. As shown in Fig. S5 (Supporting information), AC-PdPtSe NPs present different lattice spacing in the edges and middle regions. The lattice spacing of edge regions is similar to that of PdPtSe NPs. In HRTEM images and the corresponding intensity profile (Figs. 3b and c), the interatomic spacing around A-C boundaries increases, slightly larger than that of the edge region. Moreover, a comparison between the lattice spacing of AC-PdPtSe NPs (dAC-PdPtSe NPs) at the boundaries area and the original lattice spacing of PdPtSe NPs (dPdPtSe NPs) is performed to reveal the fluctuation ranges through statistical HRTEM results (Fig. 3d). Notably, the surface reconstruction leads to a tensile strain around 3% at the middle region of AC-PdPtSe NPs, which could result in electron localization and enhancement of the catalytic activity [23,27-29]. The phase structures of as-prepared catalysts are further characterized by XRD (Fig. 3e). Compared with A-PdSe and PdPtSe NPs, AC-PdPtSe NPs possess an enhanced crystallinity. AC-PdPtSe NPs exhibit four broadened diffraction peaks and slightly shift to the low-angle region compared with that of the fcc Pt phase, indicating the lattice-stretched surface. The above results demonstrate that an etching treatment successfully tunes the crystallinity and balances the crystalline and amorphous domains, which is conducive to improving the electrical conductivity.
Figure 3
Figure 3.
(a) Schematic illustration of the synthesis of AC-PdPtSe NPs. (b, c) HRTEM image and corresponding intensity profile. (d) Comparison between the dAC-PdPtSe NPs and dPdPtSe NPs. (e) XRD pattern of A-PdSe NPs, PdPtSe NPs, and AC-PdPtSe NPs.
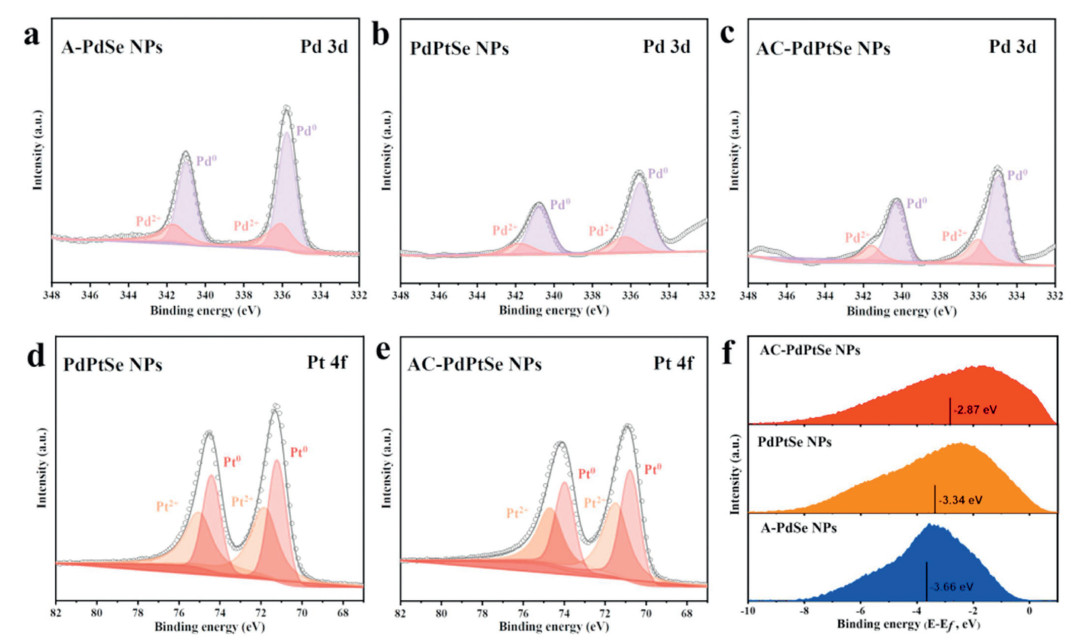
The XPS was conducted to obtain the surface chemistry of as-prepared catalysts. Pd mainly exists in the metallic state and a small amount in the oxidized state in all NPs (Figs. 4a-c). After the etching treatment, the proportion of Pd oxidation species increases because Pd is easily oxidized in the air. Figs. 4d and e illustrate two sets of peaks of Pt 4f orbitals, assigning to 4f7/2 and 4f5/2 orbitals of metallic and oxidized state species. Meanwhile, Se exists in the Se2- state on the surface of all NPs (Fig. S6 in Supporting information). Pd 3d orbitals and Pt 4f orbital of AC-PdPtSe NPs shift to lower binding energy compared to those of PdPtSe and A-PdSe NPs, suggesting the stronger electronic effect between amorphous PdSe and crystalline Pt domains.
Figure 4
Figure 4.
(a-c) Pd 3d XPS spectra of A-PdSe NPs, PdPtSe NPs and AC-PdPtSe NPs. (d, e) Pt 4f XPS spectra of PdPtSe NPs and AC-PdPtSe NPs. (f) Surface valence band photoemission spectra of A-PdSe NPs, PdPtSe NPs, and AC-PdPtSe NPs.
Previous advances have proposed that the amorphous structure with low coordination atoms leads to the localization of electrons [30-32]. The coupling of crystalline and amorphous structures could further regulate the d-band structure, affecting the binding energy of adsorbate. Therefore, surface valence band photoemission spectra were carried out to evaluate the d-band centers of as-prepared catalysts. As shown in Fig. 3f, the electron-rich AC-PdPtSe NPs present a significant upshift of the d-band center (−2.93 eV) compared to that of PdPtSe (−3.15 eV) and A-PdSe NPs (−3.66 eV). The upshift of the d-band center could improve the activity by strengthening the adsorption and activation of reactants and reducing the reaction energy barrier [33,34]. Therefore, the integration of amorphous and crystalline structures into AC-PdPtSe NPs modifies the electronic structure, making it a desired catalyst for electrocatalytic reactions.
To shed light on the effect of structural distortion on performance, the electrocatalytic properties of AC-PdPtSe NPs toward the EGOR and GOR were measured in an alkaline electrolyte. Cyclic voltammograms (CVs) were recorded in 1 mol/L KOH solution first to calculate the ECSA (Fig. S7 in Supporting information). The ECSAs for AC-PdPtSe NPs, PdPtSe NPs, Pt/C, and Pd/C were calculated to be 20.13, 10.12, 23.8, and 27.04 m2/g, respectively. Compared with AC-PdPtSe NPs, PdPtSe NPs display an oxidation peak at a potential range of 0.9–1.1 V vs. RHE due to the oxidation of surface Se. It can be seen that the etching treatment alleviates the excessive coverage of Se and increases the active sites over NPs surface. The strained surface could also affect the catalytic behavior of the AC-PdPtSe NPs catalyst.
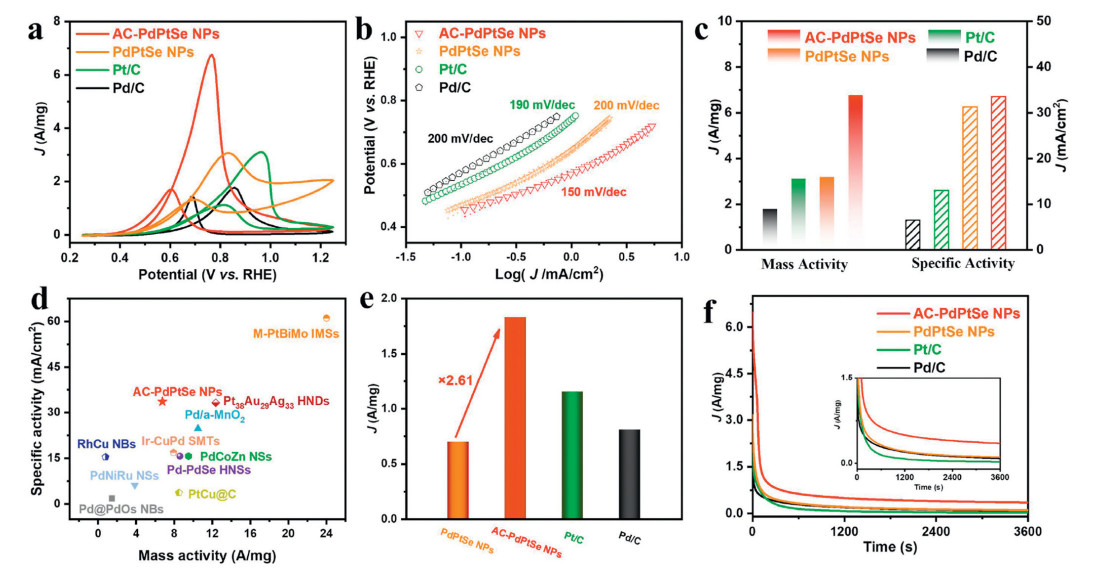
We then evaluated the EGOR performances of different catalysts in 1 mol/L KOH and 1 mol/L ethylene glycol with a sweep rate of 50 mV/s. As shown in Fig. 5a, it can be seen that AC-PdPtSe NPs have the highest peak current among these investigated catalysts. It is well-known that the Tafel slope is an important parameter to evaluate the speed of reaction kinetics. Based on the CV curves, we calculated the Tafel slope of different catalysts. As shown in Fig. 5b, AC-PdPtSe NPs display the smallest Tafel slope of 150 mV/dec in contrast to PdPtSe NPs (200 mV/dec), Pt/C (190 mV/dec), and Pd/C (200 mV/dec). The improved reaction kinetic of AC-PdPtSe NPs originates from the lattice-stretched sites around the A-C interface, as they promote the adsorption and activation of reactants. In Fig. 5c, AC-PdPtSe NPs exhibit the highest mass activity of 6.76 A/mg, 2.18 and 3.82 times larger than that of Pt/C (3.10 A/mg) and Pd/C (1.77 A/mg), respectively. The specific activity of AC-PdPtSe NPs (33.58 mA/cm2) is 2.58 and 5.13 times higher than that of Pt/C (13.02 mA/cm2) and Pd/C (6.55 mA/cm2). Moreover, the mass and specific activities of AC-PdPtSe NPs are higher than those of the PdPtSe NPs, confirming that the A-C heterostructure is beneficial to boosting electrocatalysis. Notably, compared to the Pd-based and Pt-based catalysts reported to date, AC-PdPtSe NPs present comparable or more excellent EGOR activity (Fig. 5d) [35-41].
Figure 5
Figure 5.
(a) CV curve in 1 mol/L KOH and 1 mol/L ethylene glycol. (b) The corresponding Tafel plots, (c) mass and specific activity, (d) performance comparison of different catalysts toward EGOR, (e) mass activity after CVs tests, (f) CA tests of AC-PdPtSe NPs, PdPtSe NPs, Pt/C, and Pd/C catalysts.
We further investigated the catalytic durability of different catalysts through CVs and chronoamperometric (CA) tests. After the stability test, PdPtSe NPs suffer from serious deactivation and poor stability (Fig. 4e and Fig. S8 in Supporting information) because the amorphous structure exhibits a high dissolving rate during the electrocatalytic reaction. In contrast, the AC-PdPtSe NPs exhibit long-term stability as the dense heterointerfaces maximize the synergistic effect between amorphous PdSe and crystalline Pt domains. The strong interface interaction alleviates the aggregation and dissolution of AC-PdPtSe NPs (Fig. S9 in Supporting information). In particular, AC-PdPtSe NPs remain a mass activity of 1.83 A/mg, beyond that of PdPtSe NPs, Pt/C, and Pd/C. In addition, CA tests reveal the highest current of AC-PdPtSe NPs after 3600 s among those catalysts (Fig. 5f). As is well known, catalytic performance is highly correlated with the chemisorption of adsorbates on the metallic surface. Improving the adsorption and activation of OH species on noble metal surfaces can greatly enhance catalytic performance, as OH species play an important role in the dehydrogenation and oxidation of carbonaceous intermediates. The strong interaction between amorphous PdSe and crystalline Pt endows the AC-PdPtSe NPs catalyst with a stretched surface. Such a tensile strain significantly strengthens the adsorption ability of AC-PdPtSe NPs toward OH species, which alleviates the poisoning effect and accelerates the release of active sites. Therefore, AC-PdPtSe effectively promotes the oxidation of the intermediate, beneficial to the enhancement of activity and durability.
Electrochemical impedance spectroscopy (EIS) was carried out to evaluate the capability of electron transport of the catalysts. As depicted in Fig. S10 (Supporting information), the semicircular diameter of the Nyquist plot for AC-PdPtSe NPs is much less than that of PdPtSe NPs, Pt/C, and Pd/C, suggesting that the A-C heterostructure significantly promoted the electron transport. The amorphous-dominant PdPtSe NPs inherently exhibit poor conductivity due to the long-range disorder and short-range order structure. After an etching treatment, the Pt crystalline phase endows the AC-PdPtSe NPs with high electronic conductivity, thereby accelerating electron transport.
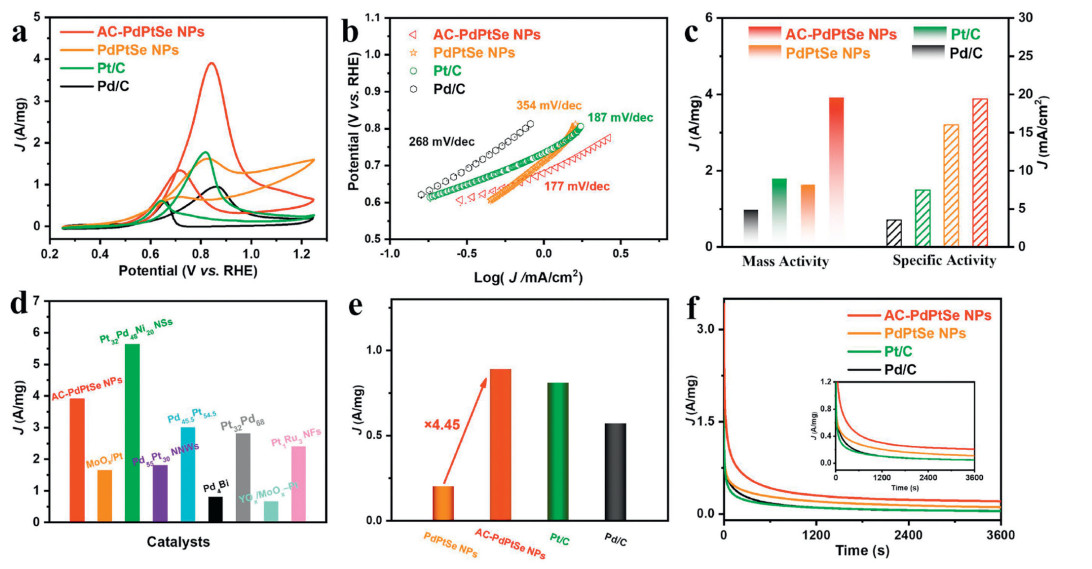
Moreover, GOR was also chosen as a target reaction to investigate the catalytic behavior of AC-PdPtSe NPs for polyhydric alcohol electrooxidations. Fig. 5a shows the CVs of different catalysts in 1 mol/L KOH and 1 mol/L glycerol with a sweep rate of 50 mV/s. In Fig. 6a, the highest current density for the AC-PdPtSe NPs catalyst was observed compared with other catalysts. As depicted in Fig. 6b, the Tafel slope of AC-PdPtSe NPs is much smaller than that of PdPtSe NPs, Pt/C, and Pd/C, indicating that the formation of A-C heterostructure greatly promotes the reaction kinetic for GOR. It can be observed that AC-PdPtSe NPs represent a mass activity of 3.91 A/mg, 2.20, 4.07, and 2.41 times higher than that of commercial Pt/C (1.78 A/mg), Pt/C (0.96 A/mg) and PdPtSe NPs (1.62 A/mg). Moreover, the specific activities of these catalysts toward GOR can be obtained in the order of AC-PdPtSe NPs (19.42 mA/cm2) > PdPtSe NPs (16.01 mA/cm2) > Pt/C (7.48 mA/cm2) > Pd/C (3.55 mA/cm2) (Fig. 6c). It should be emphasized that the mass activity of the AC-PdPtSe NPs catalyst is superior to many PdPt-based electrocatalysts toward GOR, such as Pd55Pt30 NNWs (1.80 A/mg), flower-like Pd45.5Pt54.5 nanoalloys (3.00 A/mg), and Pt32Pd68 nanosheets (2.81 A/mg) (Fig. 6d) [42-44]. After CV tests, the mass activity of AC-PdPtSe NPs is 4.45 times higher than that of PdPtSe NPs, showing enhanced GOR durability (Fig. 6e and Fig. S11 in Supporting information). During the whole CA test (Fig. 6f), the current density of the AC-PdPtSe NPs is still comparatively higher than that of other catalysts. In addition, we can see that AC-PdPtSe NPs deliver higher conductivity and smaller mass transfer resistance than PdPtSe NPs, Pt/C, and Pd/C (Fig. S12 in Supporting information).
Figure 6
Figure 6.
(a) CV curve in 1 mol/L KOH and 1 mol/L glycerol. (b) The corresponding Tafel plots, (c) mass and specific activity, (d) performance comparison of different catalysts toward GOR, (e) mass activity after CVs tests, (f) CA tests of AC-PdPtSe NPs, PdPtSe NPs, Pt/C, and Pd/C catalysts.
To summarize, we report an etching treatment to prepare AC-PdPtSe NPs with A-C heterostructure. In particular, the amorphous PdSe/crystalline Pt heterostructure delivers mass activities of 6.76 and 3.91 A/mg for EGOR and GOR, 2.13-fold and 2.41-fold larger than those of the low-crystalline counterpart, respectively. We further demonstrate that AC-PdPtSe NPs can effectively improve the electrocatalytic activity and stability due to the combination of the highly active sites of the amorphous phase and the high electrical conductivity of the crystalline phase. Structural investigations reveal that the A-C boundary can induce about 3% tensile strain, which modifies the d-band state of AC-PdPtSe NPs and strengthens the adsorption of reactant. Therefore, engineering the high-density A-C boundaries offers an efficient strategy for the development of active noble-metal nanomaterials for fuel cell catalysis.
Declaration of competing interest
The authors declare that they have no known competing financial interests or personal relationships that could have appeared to influence the work reported in this paper.
CRediT authorship contribution statement
Jie Li: Writing – review & editing, Writing – original draft, Investigation, Formal analysis, Data curation, Conceptualization. Mengyun Hu: Investigation, Formal analysis. Tianpeng Liu: Software, Investigation, Formal analysis. Xin Wang: Formal analysis, Data curation. Jun Yu: Formal analysis, Conceptualization. Changqing Ye: Supervision, Resources. Yukou Du: Writing – review & editing, Validation, Supervision, Resources.
Acknowledgment
This work was supported by the National Natural Science Foundation of China (Nos. 52274304, 52073199).
Supplementary materials
Supplementary material associated with this article can be found, in the online version, at doi:10.1016/j.cclet.2025.110828.
J. Lai, F. Lin, Y. Tang, et al., Adv. Energy Mater. 9 (2019) 1800684. doi: 10.1002/aenm.201800684
Figure 1
(a) HAADF-STEM image and corresponding line-scan analysis, (b) elemental mapping images, (c) HRTEM image, the inset in (c) is the SAED pattern, (d1, e1, f1) enlarged HRTEM images of amorphous domain and crystalline domain, (d2, e2, f2) FFT image of amorphous domain and crystalline domain of PdPtSe NPs.
Figure 2
(a) HRTEM image, the inset in (a) is the SAED pattern, (b1, c1, d1) enlarged HRTEM images of amorphous domain and crystalline domain, (b2, c2, d2) FFT image of amorphous domain and crystalline domain, (e) HAADF-STEM image and elemental mapping images of AC-PdPtSe NPs.
Figure 3
(a) Schematic illustration of the synthesis of AC-PdPtSe NPs. (b, c) HRTEM image and corresponding intensity profile. (d) Comparison between the dAC-PdPtSe NPs and dPdPtSe NPs. (e) XRD pattern of A-PdSe NPs, PdPtSe NPs, and AC-PdPtSe NPs.
Figure 5
(a) CV curve in 1 mol/L KOH and 1 mol/L ethylene glycol. (b) The corresponding Tafel plots, (c) mass and specific activity, (d) performance comparison of different catalysts toward EGOR, (e) mass activity after CVs tests, (f) CA tests of AC-PdPtSe NPs, PdPtSe NPs, Pt/C, and Pd/C catalysts.
Figure 6
(a) CV curve in 1 mol/L KOH and 1 mol/L glycerol. (b) The corresponding Tafel plots, (c) mass and specific activity, (d) performance comparison of different catalysts toward GOR, (e) mass activity after CVs tests, (f) CA tests of AC-PdPtSe NPs, PdPtSe NPs, Pt/C, and Pd/C catalysts.

 DownLoad:

 下载:
下载:


