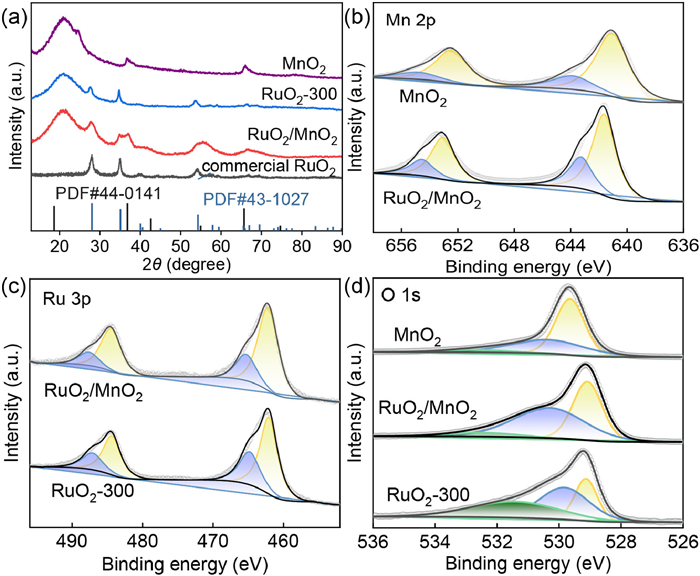
Figure 1.
(a) XRD patterns of MnO2, commercial RuO2, RuO2-300 and RuO2/MnO2. (b) Mn 2p XPS spectra of MnO2 and RuO2/MnO2. (c) Ru 3p XPS spectra of RuO2/MnO2 and RuO2-300. (d) O 1s XPS spectra of MnO2, RuO2-300 and RuO2/MnO2.
Engineering eg filling of RuO2 enables a robust and stable acidic water oxidation
Qing Li , Yumei Feng , Yingjie Yu , Yazhou Chen , Yuhua Xie , Fang Luo , Zehui Yang

The elimination of environmental pollution and energy crisis caused by consumption of fossil fuels relies on the exploitation of sustainable energy sources. Hydrogen, an advancing reactant for fuel cells and hydrogen engine, generates from electrochemical water splitting, resulting in carbon dioxides free emission. Due to the working environments, the water splitting technology has been classified to acidic and alkaline water splitting. In case of acidic water splitting, more attention should be paid to the anodic electrocatalyst since the high applied potential (> 1.6 V vs. RHE) associated with high acidity decompose the electrocatalyst leading to a low stability [1,2]. Iridium oxides (IrO2) and ruthenium oxides (RuO2) are commercially available anodic electrocatalysts for acidic water splitting [3,4]. RuO2 performs a better catalytic activity than IrO2; in contrast, a higher electrochemical stability is recorded for IrO2 [5]. Thus, the stability should be highly considered for the real application of RuO2 [6–8].
The stability of electrocatalyst customarily divides to thermodynamic and structural stability, which relies on the electronic configurations, like coordination environments, bond energy and bond length, and defects, respectively [9]. Therefore, doping RuO2 with secondary metal [10] or heteroatoms [11], constructing of solid solution [12] and heterostructure [13] are tremendously conducted to boost the electrocatalyst's stability ascribing to the tailoring of electronic structure [14]. The formation of heterostructure is also beneficial for the adjustment in electronic structure of active center, regulating the adsorption/desorption capability of oxygen coordinates leading to a promoted catalytic activity [15]. As previously reported that MnO2 was stable in acidic OER catalysis; thereby, MnO2 is a potential material for RuO2 to construct heterostructure [16]. The morphology of electrocatalyst normally affects the structural stability since the surface energy, defects and exposed crystal planes are different, which performs different resistance towards electrochemical oxidization and dissolution [17]. RuO2 formed as nanosheets [18], nanowires [19] and nanospheres [20] have been reported as efficient and stable acidic OER electrocatalysts. Among these morphologies, nanosheets assembled nanoflower structure is a promising architecture for RuO2 since a strong interaction between nanosheet was recognized triggering a robust stability; besides, the active center is fully exposed and the diffusion of reactant and relative products is accelerated; thereby, the catalytic activity should be dramatically enhanced [21,22].
In this work, herein, we have synthesized RuO2/MnO2 nanoflower structure for acidic OER catalysis using MnO2 as template. RuO2/MnO2 performed higher oxygen vacancies percentage by comparison with RuO2 and MnO2; thereby, a lower valance state (< 4) was observed for Ru atoms, favorable for the deprotonation of H2O, reducing the energy barrier for the formation of *OOH species. RuO2/MnO2 demanded only 221 mV overpotential to obtain 10 mA/cm2, which was lowered by 23 mV and 45 mV than commercial RuO2 and RuO2-300, respectively. The reaction order was higher than commercial RuO2 suggesting the formed Ru-Obri-Mn facilitated the pronation during OER catalysis. The in-situ Raman spectroscopy associated with cyclic voltammetry tests supported that the further oxidation of Ru4+ to Ru6+ was well suppressed, leading to a better structural stability.
As shown in Fig. 1a, it was found that diffraction peaks at 36.9° and 66.1° was stemmed from the (006) and (119) facets of MnO2 (JCPDS No. 18-0802) confirming the formation of MnO2. Also, the diffraction peaks at 27.6°, 34.9° and 54.4° was assigned to the crystal planes of (110), (101) and (211) verifying the successful construction of RuO2. In the XRD pattern of RuO2/MnO2, these diffraction peaks were both observed indicating the existence of RuO2 and MnO2. In order to confirm the formation of heterostructure, XPS test was carried out shown in Fig. S1 (Supporting information). The Mn 2p XPS spectra were shown in Fig. 1b, in which two distinct peaks at 652.6 eV and 641.2 eV were detected stemming from the Mn 2p1/2 and Mn 2p3/2, deconvoluted to Mn3+ and Mn4+ motifs. Interestingly, the quantitative analysis of the peak area indicated that a higher percentage of Mn4+ specie was found for RuO2/MnO2 with relative to pure MnO2 (Fig. S2 in Supporting information) revealing higher valance state of Mn in RuO2/MnO2. As shown in Fig. 1c, Ru 3p XPS spectra composed of Ru0 3p1/2, Ru4+ 3p1/2, Ru0 3p3/2 and Ru4+ 3p3/2 at 484.5 eV, 487.2 eV, 462.1 eV and 465.0 eV, respectively. It was found that a lower content of Ru4+ moieties were noticed for RuO2/MnO2 (Ru0: Ru4+ = 2.77) by comparison with RuO2-300 (1.92, Table S1 in Supporting information). As shown in Fig. 1d, the core-level O 1s spectra were deconvoluted to absorbed H2O at 531.74 eV, oxygen vacancy at 529.83 eV and lattice oxygen at 528.65 eV [23]. A higher proportion in oxygen vacancy was calculated for RuO2/MnO2 than RuO2-300 and MnO2 ascribing to the mismatched lattice spacing of RuO2 and MnO2 at heterostructure triggering more oxygen vacancies. Combined with XRD and XPS tests, it was concluded that heterostructured RuO2/MnO2 was synthesized. Based on the weight ratio between Ru and Mn from ICP-MS test, the percentage of RuO2 was 28.6 wt% in electrocatalyst.
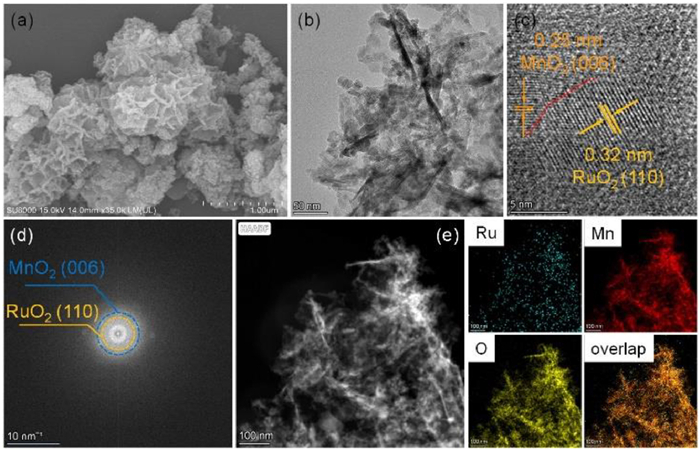
As shown in Fig. S3 (Supporting information), well-defined nanoflower assembled by nanosheets was observed for MnO2. While, with the same procedure, microspheres were observed for RuO2-300 (Fig. S4 in Supporting information). Surprisingly, the nanoflower structure was still detected for RuO2/MnO2 shown in Fig. 2a and only the surface became rougher compared to MnO2. The TEM image in Fig. 2b also testified the nanoflower structure. As shown in Fig. 2c, the HR-TEM image clearly stated two lattice spacing of 0.32 nm and 0.25 nm relating to the dominant (110) and (006) facet of RuO2 and MnO2, respectively. Additionally, the heterointerface was distinctly recorded highlighting the formation of heterostructure. As shown in Fig. 2d, the SAED pattern also indicated the coexistence of RuO2 (110) and MnO2 (006) facets. From the HAADF-STEM image (Fig. 2e) and corresponding EDS mapping, homogenously dispersed Mn, Ru and O elements over the architecture were recorded.
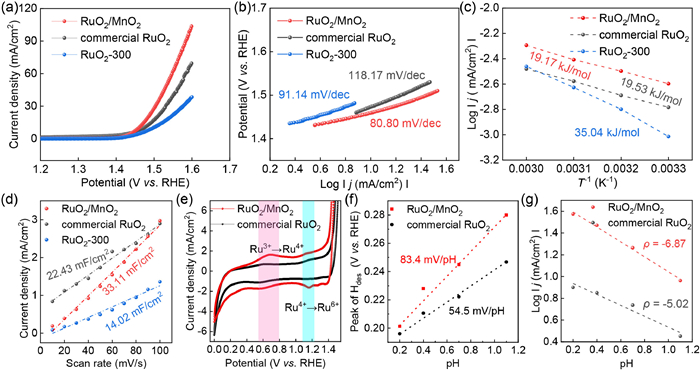
As shown in Fig. 3a, the benchmarked RuO2 required 244 mV overpotential to obtain 10 mA/cm2, outperforming the RuO2-300 needing 266 mV overpotential to attain 10 mA/cm2. Impressively, RuO2/MnO2 exhibited a robust catalytic activity towards acidic OER demanding 221 mV overpotential to obtain 10 mA/cm2. The OER performance of RuO2/MnO2 was superior to RuO2-300 attributing to the formation of heterostructure inducing more active sites as well as electronic configurations since MnO2 exhibited an ignorable OER activity. Due to the different dosage of noble metal Ru, the mass activity (MA) was estimated shown in Fig. S5 (Supporting information). RuO2/MnO2 exhibited a 6.5-time higher mass activity by comparison with RuO2-300 at 1.52 V vs. RHE. Besides, the MA value of RuO2/MnO2 at 1.52 V vs. RHE was boosted by a factor of 3.7 with relative to commercial RuO2. As listed in Table S2 (Supporting information), it was noticed that RuO2/MnO2 exhibited a higher OER performance than reported Ru based electrocatalysts. The Tafel slope was 118.2 mV/dec, 91.1 mV/dec and 80.8 mV/dec for commercial RuO2, RuO2-300 and RuO2/MnO2 (Fig. 3b). The lower Tafel slope of RuO2/MnO2 also indicated a Eley-Rideal-like (ER-like) OER mechanism; however, OER occurred on commercial IrO2 followed Langmuir-Hinshelwood mechanism. Also, as displayed in Fig. S6 (Supporting information), the charge transfer resistance (Rct) of RuO2/MnO2 was as low as 61.4 Ω, which was decreased by 28.8% and 31.4% than RuO2-300 and commercial RuO2. To know the activation energy for various electrocatalysts, OER performance tested at different temperatures were carried out (Fig. S7 in Supporting information). The activation energy was estimated as 35.04 kJ/mol and 19.17 kJ/mol for RuO2-300 and RuO2/MnO2 shown in Fig. 3c, respectively. The activation energy for acidic OER catalysis was strongly decreased by 45.7% for RuO2/MnO2 with respect to RuO2-300 suggesting its better catalytic activity. Moreover, the activation energy of RuO2/MnO2 was lower than commercial RuO2 (19.53 kJ/mol). To know the active sites, cyclic voltammetry (CV) curve was tested with variation in scan rate (Fig. S8 in Supporting information). The double layer capacitance (Cdl), estimated from slope of the plot of net current density versus scan rate, was 33.11 mF/cm2 for RuO2/MnO2 (Fig. 3d), promoted by 2.4-fold than RuO2-300 deriving from the strain effect in the heterostructure with more defects [24]. The estimation in catalytic performance of single catalytic center was conducted by means of normalization of OER performance with Cdl. As shown in Fig. S9 (Supporting information), the specific activity was 1.43 A/F for RuO2/MnO2, enhanced by 1.2- and 1.1-time with relative to RuO2-300 and benchmarked RuO2, respectively. The higher specific catalytic activity was a distinct indicator of better intrinsic catalytic activity. The higher intrinsic catalytic activity was also testified by turnover frequency (TOF), which was 0.5 s-1, 0.8 s-1 and 4.3 s-1 for RuO2-300, commercial RuO2 and RuO2/MnO2 at 1.6 V vs. RHE, respectively. To confirm more active sites in RuO2/MnO2 compared to benchmarked RuO2, the cyclic voltammetry curve was recorded from 0 V to 1.4 V vs. RHE shown in Fig. 3e. A clear anodic peak at 0.62 V vs. RHE was detected for RuO2/MnO2 assigned to the oxidation of Ru3+ to Ru4+ structure due to more oxygen vacancies. Another oxidation peak at 1.31 V vs. RHE was found due to the further oxidation of Ru4+ to Ru6+ specie [25]. Although, this oxidation peak was more obvious for RuO2/MnO2; however, the peak ratio between Ru4+ → Ru6+ and Ru3+ → Ru4+ was lower for RuO2/MnO2 with relative to the counterpart of commercial RuO2 revealing a lower percentage of Ru4+ moieties have been oxidized; thereby, a higher structural stability was predicted. As deprotonation is involved in acidic OER process, the capability of deprotonation was estimated by Tafel slope of hydrogen desorption peak. As shown in Fig. S10 (Supporting information), Tafel slope was 451 mV/dec and 348 mV/dec for commercial RuO2 and RuO2/MnO2, respectively, indicating a faster hydrogen desorption from RuO2/MnO2. To reveal the fast H desorption, the cyclic voltammetry curves were observed under various pH electrolyte (Fig. S11 in Supporting information). The plot of potential for H desorption vs. pH was shown in Fig. 3f, in which the slope was 54.5 mV/pH and 83.4 mV/pH for commercial RuO2 and RuO2/MnO2. It is noted that 59 mV/pH indicates 1e- and 1H+ were involved in the reaction; thereby, in case of commercial RuO2, 1e-/1H+ was involved for hydrogen desorption; however, 2e-/3H+ reaction was calculated for RuO2/MnO2, which would be due to the hydrogen spillover from active site to bridge oxygen (Obri) and released from Obri site. The OER performance was also recorded under different electrolyte with various pH values shown in Fig. S12 (Supporting information). As shown in Fig. 3g, the reaction order of RuO2/MnO2 was 6.87, which was higher than commercial RuO2 (5.02) suggesting the OER performance of RuO2/MnO2 was more sensitive to the hydrogen ion concentration. In RuO2/MnO2 structure, Ru-Obri-Mn species were observed and the Obri performed a better deprotonation capability since the deprotonation of absorbed *OOH species could be accelerated by the Mn atoms [26]; thus, a better OER performance was achieved for RuO2/MnO2.
As shown in Fig. 4a, RuO2/MnO2 performed a stable OER activity during 1000 potential cycles. To know the mechanism of such high stability, Cdl was calculated as 27.88 mF/cm2 after 1000 cycles (Fig. S13 in Supporting information), which was only deteriorated by 10%; additionally, the Rct was merely increased from 61.36 Ω to 71.68 Ω shown in Fig. S14 (Supporting information). Thus, it was concluded that the superior cyclic stability was stemmed from the superb structural stability. As shown in Fig. S15 (Supporting information), commercial RuO2 showed a serious degradation in OER activity after 1000 cycles ascribing to the electrochemical decomposition. RuO2/MnO2 exhibited an extraordinarily high stability with potential only increased by 13 mV within 20 h; however, commercial RuO2 only sustained for 0.5 h (Fig. 4b). To verify the superior stability, the OER performance of RuO2/MnO2 has been tested after long term operation test. As shown in Fig. S16 (Supporting information), it was found the OER performance was inconspicuously decayed underscoring the superior configurational stability of RuO2/MnO2. The in-situ electrochemical impedance spectroscopy (EIS) is carried out to detect the dynamic change in electrocatalyst-electrolyte interface. As shown in Fig. 4c, the phase angle greatly variated in the low frequency region, larger than commercial RuO2 (Fig. S17 in Supporting information). In this region, the change in phase angle attributed to the OER catalysis and an obvious change means the high catalytic activity towards OER. Nevertheless, the phase angle in high-frequency region reflects the information of electrocatalyst-electrolyte interface. For RuO2/MnO2 electrocatalyst, it was noticed that the phase angle also stable during the increment in applied potential; however, the phase angle was changed for commercial RuO2 indicating the surface reconstruction forming dissolvable Ru6+ species. Also, the Rct of RuO2/MnO2 was lower than commercial RuO2 at various potentials (Fig. S18 in Supporting information). As generally accepted that OER catalysis follows two mechanism, adsorption evolution mechanism (AEM) and lattice oxygen mechanism (LOM), O22- and O2- is considered as the different reaction intermediate involved in LOM and AEM, which could be identified by tetramethylammonium cations (TMA+) capturing O22- resulting in deterioration in OER performance [27]. Acidic OER performance of RuO2/MnO2 was stable with and without TMA+ (Fig. 4d) indicating the OER catalysis followed AEM pathway, which was beneficial for enhancing stability because the structure is easy to collapse via LOM. To know the practical application, the membrane electrode assembly was constructed. The cell voltage was only 2.18 V to attain 5 A/cm2, 50 mV lower than commercial RuO2 (Fig. 4e), indicating its robust water oxidation.
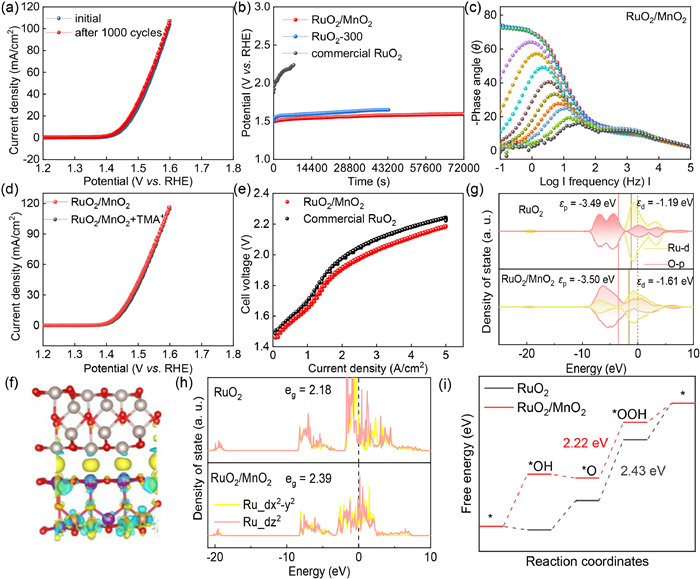
The theoretical calculation was performed based two structures, RuO2 and RuO2/MnO2. Firstly, the charge density was calculated shown in Fig. 4f. An electron deficiency state was noted for Ru atoms and increment in electron density was found for Mn atoms, which was in line with XPS analysis. The density of state (DOS) of RuO2 and RuO2/MnO2 was displayed in Fig. 4g. The d band center of Ru in RuO2 and RuO2/MnO2 was −1.19 eV and −1.61 eV, respectively, suggesting the introduction of MnO2 downshifted the d band center of Ru weakening the adsorption of reaction intermediates during OER catalysis [18]. Moreover, the p band center of oxygen atom was slightly downshifted for RuO2/MnO2 compared to that of RuO2. The band gap between Ru and O atom was narrowed by 0.41 eV implying a faster electronic conductivity. The further analysis of DOS indicated that the eg filling was 2.39 and 2.18 for RuO2/MnO2 and RuO2, respectively (Fig. 4h). A higher eg filling indicated a weakened adsorption of intermediates, similar to the analysis of d band center. The increment in eg filling after MnO2 decoration suggested more electrons were in the outmost orbital beneficial to involve in OER catalysis. The energy barriers for the formation of various reaction coordinates were estimated (Fig. S19 in Supporting information). As shown in Fig. 4i, the potential-limiting step was the conversion of *O to *OOH demanding 2.22 eV and 2.43 eV for RuO2/MnO2 and RuO2. The lowered free energy demonstrated a better OER performance of RuO2/MnO2.
In this work, we have successfully synthesized RuO2/MnO2 heterostructure with nanoflower structure via MnO2 hard template. RuO2/MnO2 performed a robust OER activity with only 221 mV overpotential to reach 10 mA/cm2, superior to commercial RuO2 and RuO2-300. Additionally, the mass activity at 1.53 V vs. RHE was 7.2 A/mgRu for RuO2/MnO2, which was enhanced by 3.7 folds than commercial RuO2. Due to the formation of heterostructure, a better deprotonation capability was observed for RuO2/MnO2 proved by a higher reaction order in the pH-independent test attributing to more oxygen vacancies. Also, the oxidation of Ru to Ru6+ was also effectively suppressed triggering a better stability. In the PEMWE test, RuO2/MnO2 only demanded 2.18 V to reach 5 A/cm2, which was lower than commercial RuO2. The DFT calculation indicated that the eg filling of Ru atom was increased after MnO2 decoration suggesting a downshifted d band center; thereby, the energy barrier for the rate-limiting step, formation of *OOH, was decreased.
The authors declare that they have no known competing financial interests or personal relationships that could have appeared to influence the work reported in this paper.
Qing Li: Data curation. Yumei Feng: Data curation. Yingjie Yu: Data curation. Yazhou Chen: Investigation, Data curation. Yuhua Xie: Data curation. Fang Luo: Supervision, Funding acquisition, Data curation. Zehui Yang: Writing – review & editing, Writing – original draft, Supervision.
This work is supported by the National Natural Science Foundation of China (No. 22209126).
Supplementary material associated with this article can be found, in the online version, at doi:
X. Li, W. Xu, Y. Fang, et al., SusMat 3 (2023) 160–179. doi: 10.1002/sus2.114
S. Zhao, S.F. Hung, L. Deng, et al., Nat. Commun. 15 (2024) 2728. doi: 10.1038/s41467-024-46750-6
J. Li, S. Wang, J. Chang, et al., Adv. Powder Mater. 1 (2022) 100030. doi: 10.1016/j.apmate.2022.01.003
J. Ge, X. Wang, H. Tian, et al., Chin. Chem. Lett. (2024), doi: 10.1016/j.cclet.2024.109906.
Y. Hao, S.F. Hung, L. Wang, et al., Nat. Commun. 15 (2024) 8015. doi: 10.1038/s41467-024-52410-6
Y. Hao, S.F. Hung, W.J. Zeng, et al., J. Am. Chem. Soc. 145 (2023) 23659–23669. doi: 10.1021/jacs.3c07777
S. Li, S. Zhao, F. Hu, et al., Prog. Mater Sci. 145 (2024) 101294. doi: 10.1016/j.pmatsci.2024.101294
J. Cao, D. Zhang, B. Ren, et al., Chin. Chem. Lett. 35 (2024) 109863. doi: 10.1016/j.cclet.2024.109863
Y. Zhang, J. Yang, R. Ge, et al., Coord. Chem. Rev. 461 (2022) 214493. doi: 10.1016/j.ccr.2022.214493
Y. Qin, T. Yu, S. Deng, et al., Nat. Commun. 13 (2022) 3784. doi: 10.1038/s41467-022-31468-0
C. Liu, B. Sheng, Q. Zhou, et al., Nano Res. 15 (2022) 7008–7015. doi: 10.1007/s12274-022-4337-z
Y. Lin, Z. Tian, L. Zhang, et al., Nat. Commun. 10 (2019) 162. doi: 10.1038/s41467-018-08144-3
X. Wang, X. Wan, X. Qin, et al., ACS Catal. 12 (2022) 9437–9445. doi: 10.1021/acscatal.2c01944
W. Song, M. Li, C. Wang, et al., Carbon Energy 3 (2021) 101–128. doi: 10.1002/cey2.85
S.A. Lee, J.W. Yang, T.H. Lee, et al., Appl. Catal. B 317 (2022) 121765. doi: 10.1016/j.apcatb.2022.121765
A. Li, H. Ooka, N. Bonnet, et al., Angew. Chem. Int. Ed. 58 (2019) 5054–5058. doi: 10.1002/anie.201813361
X. Long, T. Xiong, H. Bao, et al., J. Colloid Interface Sci. 662 (2024) 676–685. doi: 10.1016/j.jcis.2024.02.120
T. Xiong, X. Li, Z. Ma, et al., J. Colloid Interface Sci. 672 (2024) 170–178. doi: 10.1016/j.jcis.2024.05.232
D. Zhang, M. Li, X. Yong, et al., Nat. Commun. 14 (2023) 2517. doi: 10.1038/s41467-023-38213-1
K. Cho, J.Y. Jang, Y.J. Ko, et al., Nanoscale Adv. 6 (2024) 867–875. doi: 10.1039/d3na00899a
L. Deng, S.F. Hung, S. Liu, et al., J. Am. Chem. Soc. 146 (2024) 23146–23157. doi: 10.1021/jacs.4c05070
Q. Wu, R. Zhou, Z. Yao, et al., Chin. Chem. Lett. 35 (2024) 109416. doi: 10.1016/j.cclet.2023.109416
S. Li, G. Xing, S. Zhao, et al., Nat. Sci. Rev. 11 (2024) nwae193. doi: 10.1093/nsr/nwae193
X. Long, W. Tang, C. Li, et al., Chem. Commun. 60 (2024) 5747–5750. doi: 10.1039/d4cc01343c
X. Wang, H. Jang, S. Liu, et al., Adv. Energy Mater. 13 (2023) 2301673. doi: 10.1002/aenm.202301673
S. Chen, S. Zhang, L. Guo, et al., Nat. Commun. 14 (2023) 4127. doi: 10.1038/s41467-023-39822-6
X. Li, L. Xiao, L. Zhou, et al., Angew. Chem. Int. Ed. 59 (2020) 21106–21113. doi: 10.1002/anie.202008514

Figure 1 (a) XRD patterns of MnO2, commercial RuO2, RuO2-300 and RuO2/MnO2. (b) Mn 2p XPS spectra of MnO2 and RuO2/MnO2. (c) Ru 3p XPS spectra of RuO2/MnO2 and RuO2-300. (d) O 1s XPS spectra of MnO2, RuO2-300 and RuO2/MnO2.

Figure 2 SEM (a), TEM (b), HR-TEM (c), SAED (d), HAADF-STEM (e) images and relative EDS mapping of RuO2/MnO2.

Figure 3 OER performance (a), Tafel slope (b) and Arrhenius plots (c) of commercial RuO2, RuO2-300 and RuO2/MnO2. (d) Double layer capacitance of commercial RuO2, RuO2-300 and RuO2/MnO2. Cyclic voltammetry curves (e), plots of H desorption peak potential vs. pH value (f) and plots of current density vs. pH value (g) of commercial RuO2 and RuO2/MnO2.

Figure 4 (a) OER stability of RuO2/MnO2 before and after 1000 cycles. (b) v-t-test of commercial RuO2, RuO2-300 and RuO2/MnO2. (c) In-situ electrochemical impedance spectroscopy of RuO2/MnO2. (d) LSV curves of RuO2/MnO2 with and without TMA+. (e) Polarization curves of RuO2/MnO2 and commercial RuO2. (f) Charge density of RuO2/MnO2. Density of state (g), deconvoluted DOS (h) and free energy (i) for OER of RuO2 and RuO2/MnO2.

 扫一扫看文章

扫一扫关注我们
 DownLoad:
 下载:
下载: