
Figure 1.
(a) Schematic illustration of the formation process of HCNS. SEM images of (b) CNS, (c) HCNS and (d) HCMS. TEM images of (e) CNS, (f) HCNS and (g) HCMS. (h) HRTEM image of HCNS. (i) Schematic of the HCNS lattice.
Coupling of graphitic microcrystalline and available functional groups in hard carbon unlocking deep and fast potassium-ion storage
Zhiyuan Liu , Hui Peng , Xin Wang , Zhenghao Tang , Wenbo Hou , Bo Tao , Yue Li , Guofu Ma , Ziqiang Lei

The increasing demand for large-scale energy storage, electric vehicle storage, and renewable energy in society has stimulated research into novel electrochemical energy storage systems (EESs) [1-3]. Various portable electronic devices and smart devices nowadays rely on lithium-ion and sodium-ion batteries due to their high energy density and long life [4-6]. However, their inevitable cost increases due to limited lithium resources and the lower redox potential of SIBs have hindered their further large-scale applications [7-9]. A significant amount of interest has been generated in the use of potassium-ion hybrid capacitors (PIHCs) in large-scale grid energy storage, as they are inexpensive and have a close redox potential with Li/Li+ [10-13]. Nevertheless, K+ always leads to slower redox kinetics due to its large ionic radius (1.38 Å) and brings severe volume and structural changes during insertion/de-insertion, resulting in poor rate performance and severe capacity decay [14,15].
The excellent electrical conductivity of carbon materials and their cost-effectiveness make them the most commercially promising materials for PIHC anodes [16,17]. However, the high rate capability of porous carbon is always accompanied by a low initial coulomb efficiency (ICE). As a result of limited interlayer spacing, graphite anodes suffer from volume expansion and structural collapse after repeated intercalation and deintercalation of K+ [18,19]. HC generally storage K+ through its short-range graphitic structural domains, internal microporous structural domains, and surface active sites (e.g., defects and microporous surface functional groups) [20-23]. Therefore, low high-potential capacity, large potential hysteresis, and low ICE are still the most prominent obstacles for the practical application of HC anode in PIHCs [24,25]. Previous studies have shown that most of the capacity of the HC negative electrode comes mainly from the low potential region, but this capacity is susceptible to polarization at high rate, leading to a decrease in potassium storage capacity [26]. Potassium storage capacity and multiplicity can be effectively increased by doping carbon materials with heteroatoms (e.g., N, O, and P) [27,28]. In particular, the involvement of C-O and O-H groups in redox reactions and chemisorption of K+ contributes to the improvement of capacitive potassium storage capacity [29]. However, the relatively low availability of functional groups during potassium storage leads to a low capacity produced by the full cell [30]. Despite such great progress, the relationship between microstructures and specific K+ storage behavior in HC remains insufficiently explored [31].
Herein, we present a versatile and scalable strategy to enhance the K+ storage capacity of hard carbon nanosheets (HCNS) by coupling the carbon nanocrystal structure with available functional groups. The HCNS is innovatively synthesized by combining graphene oxide (GO) with ethylenediamine as a structure-directing agent and inexpensive glucose as a carbon source using a hydrothermal and pre-oxidation method. This convenient synthesis strategy yielded HCNS with ordered carbon nanocrystalline structures and more available C-O/O-H groups. The pre-oxidation treatment allows the introduction of oxygen-containing functional groups into the precursor and anchoring them to the surface of the carbon layer structure, which has been shown to control the formation of localized short-domain oriented graphite layers during high-temperature carbonization [8]. DFT calculations not only show that the available functional groups are more favorable for K+ adsorption, but also that the rational layer-spacing structure can further reduce the diffusion barrier for K+ adsorption and promote the electron transfer behavior. In summary, the fabricated PIHC (HCNS//AC) exhibits excellent device performance, delivering high energy density (142.6 Wh/kg at 230 W/kg) and power density (61.7 Wh/kg at 17, 800 W/kg), as well as outstanding cycling stability (102.9% capacity retention after 10, 000 cycles).
The formation process of HCNS material is schematically shown in Fig. 1a. HCNS material is formed through a schematic process. Graphene oxide (GO) has many oxygen functional groups and negative charges on the surface that allow ethylenediamine (EDA) molecules to easily attach to them. Due to the large number of amino functional groups on the surface of the GO after modified by the EDA, when glucose is added to the aqueous solution of the EDA-GO, glucose will aggregate near the surface of the GO under the electrostatic force. This mechanism is supported by the zeta potential test data (Fig. S1 in Supporting information). Then, the obtained product undergoes low-temperature oxidation in air and subsequent high-temperature carbonization process, which ultimately yields the lamellar HCNS material. Preparation details are given in the experimental section.
Scanning electron microscopy (SEM) can be used to study the specific morphology of HC materials and their intermediates (Figs. 1b–d, Figs. S2a and b (Supporting information). The morphology of CNS is nanosheet structure with a thickness of about 15 nm (Fig. 1b and Fig. S2c in Supporting information). HCNS is a thicker stacked nanosheet structure with a thickness of about 85 nm, and the surface is relatively smooth (Fig. 1c and Fig. S2d in Supporting information). The diameters of these lamellae range from 1 µm to 5 µm, and the highly flexible lamellae are conducive to improving the mechanical properties of HCNS. However, the morphology of HCMS is an inhomogeneous microsphere structure and larger in size (Fig. 1d). As shown in Figs. 1e–g and Fig. S3 (Supporting information), Mesopores and micropores were abundantly present on the surface of CNS. The surface of HCMS has abundant ordered carbon nanocrystals, and graphite microcrystals of this structure can also be clearly seen in its interior (Fig. 1f). In the magnified TEM image of HCNS, it can be clearly observed that the carbon layers have an irregular and tightly stacked microcrystalline structure, with the corresponding layer spacing as high as 0.386 nm (Figs. 1f–h). However, the morphology of HCMS is an inhomogeneous microsphere structure with a large size and a corresponding layer spacing of about 0.384 nm (Fig. 1d, Figs. S3a and b). Notably, a large number of graphite domains are present in HCNS, and the lattice of HCNS is wider compared with the fragmented graphite microcrystalline of CNS. Most importantly, HCNS has a large specific surface area exposure, and this rational structure provides more lattice entrances to ease electrochemical polarization, reduce the K+ diffusion path and increase the depth of insertion reaction, which not only achieves a longer discharge plateau in the low-potential region, but also provides functional groups for K+ storage in the high-potential region (Fig. 1i).
From the X-ray diffraction (XRD) patterns, both HCNS and HCMS samples showed two relatively broad peaks around 24.2° and 43.2° (Fig. S4a in Supporting information), which corresponded to the (002) and (101) crystal planes of carbon, respectively, and also indicated an amorphous structure. In addition, a lower angle is observed for the (002) peak of HCNS, indicating a larger spacing between its graphitic microcrystals. The average interlayer spacing of HCNS and HCMS calculated by the Bragg's equation were 0.386 and 0.384 nm, respectively, which are in agreement well with the HRTEM observation results. However, it is noteworthy that the (101) peak of CNS almost disappears compared to HCNS and HCMS, which indicates that the graphite microcrystalline of CNS is shorter, consistent with the HRTEM results (Fig. S4a). In addition, the microcrystalline structure of the samples can be deduced from the stack thickness Lc and transverse width La (Fig. S4b), where the La and Lc values show the trend of CNS, HCMS, and HCNS, indicating the carbon microcrystalline structure of HCNS [31]. Further analysis of crystallinity was performed by Raman spectroscopy (Fig. S4c in Supporting information). In general, the degree of graphitization of a carbon material can be determined by the ratio of the intensity of the D-band to that of the G-band, and the intensity ratios of HCNS, HCMS, and CNS are 1.18, 1.06, and 1.32, respectively, which proves that HCNS and HCMS have a higher degree of graphitization, and HCNS has more abundant edge defects and short-range ordered graphitic microcrystalline compared with HCMS [32].
N2 adsorption-desorption tests were conducted to characterize the surface area and pore size distribution of the HC materials (Fig. S4d in Supporting information). The N2 adsorption-desorption curves of CNS showed a typical type Ⅳ isotherm with a specific surface area of 610.09 m2/g. However, larger and excessive defect sites increase electrolyte decomposition during solid electrolyte interface (SEI) formation, leading to irreversible capacity. The N2 adsorption-desorption isotherms of HCNS showed type Ⅰ characteristics with a narrower at low relative pressure (P/P0 < 0.01) knees, indicating that the carbon nanosheets contain micropores. The specific surface areas of HCNS and HCMS were 313.65 and 98.30 m2/g, respectively, where the N2 adsorption-desorption isotherms of HCNS showed Ⅰ-type features with a narrower knee at low relative pressures (P/P0 < 0.01), suggesting that the carbon nanosheets have a micropore structure [24]. The size of the micropores is concentrated around 0.59 nm, which is in the state of ultra-microporous (< 0.7 nm). More importantly, the larger specific surface area of HCNS can provide more lattice entrances to mitigate electrochemical polarization and increase the depth of insertion reactions [33]. Comparison of the investigated spectra (Fig. S5a in Supporting information) HCNS contains up to 8.7% O and 3.1% N elements (Table S1 in Supporting information) [34,35]. The C 1s spectra of HCNS (Fig. S4e in Supporting information) revealed five carbon-related components with chemical structures of C-C/C = C (284.4 eV), C-N (285.6 eV), C-O (286.4), C = O (288.3 eV), and O-C = O (291 eV), which further demonstrates the successful doping of oxygen and nitrogen atoms in HCNS [36,37]. The O 1s spectra of HCNS (Fig. S4f in Supporting information) are divided into three typical peaks: C = O (530.9 eV), C-OH (531.8 eV), and COOH (532.9 eV), which indicates the successful doping of heteroatoms in HCNS [38,39]. Moreover, the typical peaks of C-OH and COOH are more obvious, which also indicates that the surface of HCNS has more oxygen functional groups relative to HCMS. The N 1s spectra (Figs. S5b–d in Supporting information) can be divided into four peaks located at pyridine-N (398.3 eV), pyrrole-N (400.1 eV), graphite-N (401.2 eV) and oxidized-N (403.1 eV) [40,41]. Even with high-temperature carbonization, significant N signals were detected in HCNS, and the N atomic share of CNS, HCNS and HCMS reached 4.2%, 3.1% and 1.4% (Table S1), respectively. The results showed that the N content decreased with the increase of the amount of glucose added.
Cyclic voltammetry (CV) was tested for half-cells assembled with each material. Figs. 2a–c show the CV curves for the first three cycles of the CNS, HCNS, and HCMS samples, respectively. All three materials showed a distinct reduction peak in the first cycle. In Fig. 2a, we can also observe that the curves of the subsequent cycles are similar to rectangles with no obvious redox peaks and almost no change in shape, which suggests that CNS can adsorb K+ in a stable and reversible capacitive manner [42]. As can be seen from Fig. 2b, several reduction/oxidation peaks appeared in HCNS around 0.01 and 0.42 V, which was attributed to the reversible intercalation reaction of K+ in graphite microcrystals. Meanwhile, the HCMS shows a reduction peak at 0.01 V and a broad oxidation peak at 0.44–1.0 V (Fig. 2c). It is also noteworthy that the intensity of the oxidation peak is sharper in HCNS than in HCMS, which implies that more lattice entrances and larger specific surface areas reduce electrochemical polarization by reducing the diffusion path of K+ and increasing intercalation depth [13,43]. From Fig. 2d, the HCNS sample has the highest ICE of 60.4% and remains stable, basically around 99%. This may be due to its less defects and unique ultra-microporous structure, which reduces the decomposition of the electrolyte [44]. In contrast, the ICE of the CNS sample was only 35.2% due to its large surface and defects. Fig. 2e shows the corresponding second charging/discharging curves for CNS, HCNS and HCMS at a current density of 100 mA/g, and the HCNS apparently has the highest discharge capacity of 315.2 mAh/g. The absence of a redox plateau in the GCD curve of CNS reflects its adsorption-based K+ storage mechanism [13]. In contrast to CNS, the GCD curves of HCNS showed distinct plateaus at about 0.46 and 0.1 V, which were in agreement with the distinct redox peaks in the CV curves. In addition, HCNS has a significantly higher capacity in the high-pressure region (> 0.5 V), which is attributed to its higher specific surface area exposed functional groups and unique graphitic microcrystalline structure, which not only provides diffusion pathways for K+ but also enhances K+ intercalation capacity and provides more functional group adsorption sites.
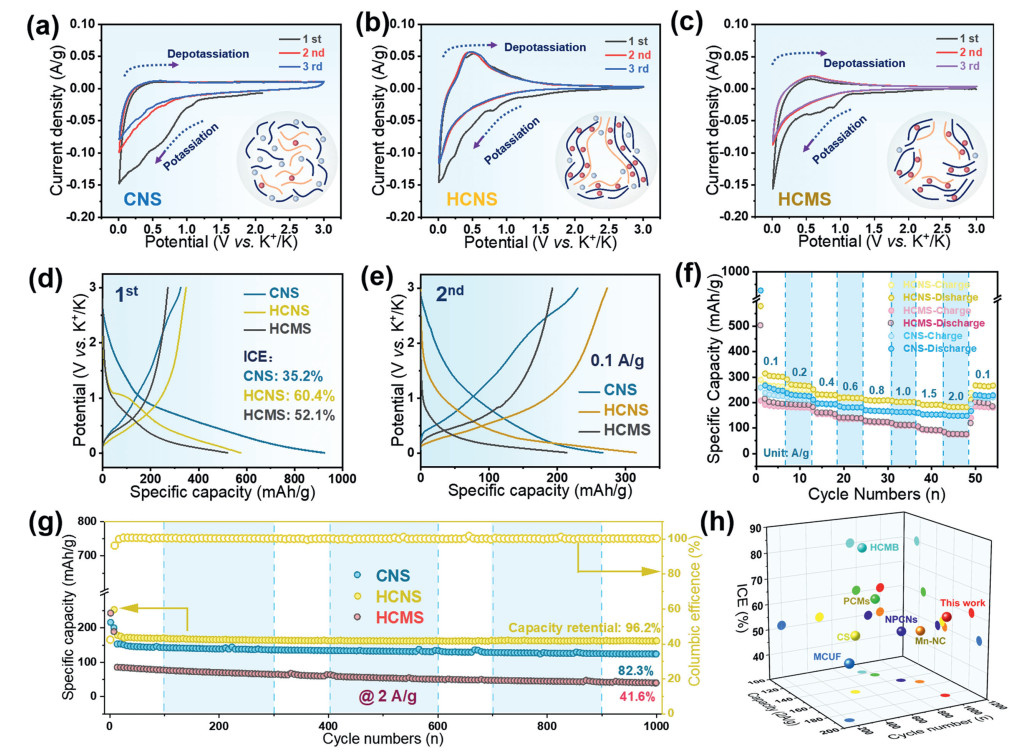
At different current densities, galvanostatic charge-discharge (GCD) tests were conducted on HCNS, HCMS, and CNS (Fig. S6 in Supporting information). Fig. 2f show the rate performance of the material at different current densities. The HCNS has the best rate performance at current densities of 0.2, 0.4, 0.6, 0.8, 1, 1.5, and 2 A/g, with discharge capacities of 268.2, 238.1, 227.5, 216.2, 202.8, 190.6, and 184.1 mAh/g. The CNS also has good rate performance with discharge capacities of 235.1, 204.5, 192.3, 184.7, 180.3, 156.4, and 142.9 mAh/g, respectively, with HCMS having the lowest capacity. It can be inferred that the relatively better performance of HCNS is due to the efficient adsorption/desorption of K+ with functional groups along with reversible embedding/de-embedding in the ordered carbon layers. The graphite lattice in the carbon layer of HCNS is more extended and the layer spacing is larger compared to that of CNS, and conversely, the adsorption of K+ may produce a co-ionic effect on the surface of CNS, thus inhibiting further storage of K+ [45]. In addition, the cycle life at high current densities was investigated (Fig. 2g). The specific capacities of HCNS, CNS, and HCMS were maintained at 176.8, 123.4, and 40.2 mAh/g after 1000 cycles at a current density of 2 A/g, respectively. The capacity retention rate of the HCNS samples is still 96.2% even under high current density, and that of the CE is still around 99%, which further demonstrates their excellent cycling stability for fast charging and discharging. We also summaries the recently reported electrochemical properties of carbon materials for PIB anodes (Fig. 2h).
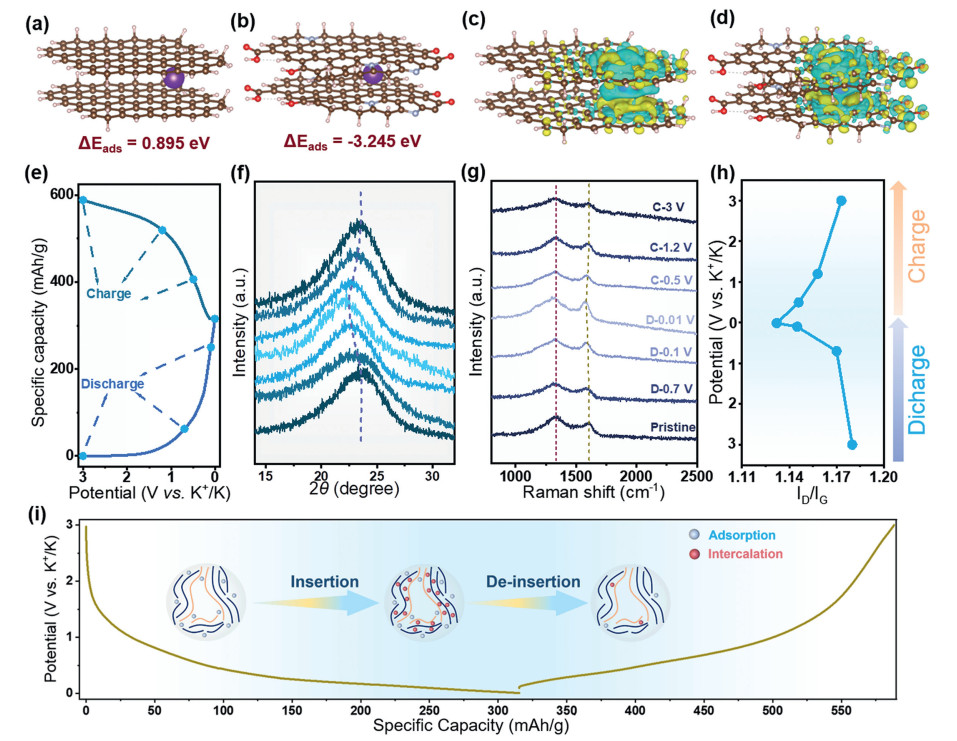
Calculations were made for pristine and N, O doped HC (Model-1) using two models (Figs. 3a and b). Both models gave 0.895 eV and −3.245 eV K+ adsorption energies (Eads), respectively [46]. DFT calculations showed that K+ adsorption on N, O doped HC is much easier than on pristine HC. In addition, the charge density difference was calculated (Figs. 3c and d). It is clearly evident from the accumulation of electrons that the heteroatoms are bound to K and that K+ is adsorbing between carbon layers of the N, O doped HC. Based on DFT calculations, K+ adsorption on N, O doped HC is easier than on pristine HC. The ex-situ XRD spectra show the change of the (002) peak offset during charging and discharging (Figs. 3e and f). The intensity of the (002) peak on the HCNS electrode decreases slightly with K+ insertion and then increases gradually with K+ de-insertion. The change in the intensity of the (002) peak is due to the disordered transition of the carbon microstructure and the presence of dispersed material in the graphitic interlayer due to K+ insertion [47]. At the beginning of HCNS discharge, the (002) peak was located at 23.26°, and with the increase of potassiation, the (002) peak moved slightly to a lower angle, and finally reached 22.23° after complete discharge. The XRD spectra showed that the interlayer spacing increased from 0.386 nm to 0.398 nm during the potassiation process, and during the subsequent charging process, the (002) peak began to move to a higher angle shift while the layer spacing decreases. During the subsequent charging process, the (002) peak gradually shifted to a higher angle, while the layer spacing decreased and finally recovered to 0.387 nm, which indicates that HCNS has excellent structural stability during the potassiation/depotassiation process (Fig. S7 in Supporting information). Ex-situ HRTEM observations further revealed the reversible structural changes of HCNS during K+ insertion/deinsertion (Figs. S8 and S9 in Supporting information). We obtained ex-situ Raman spectra (Fig. 3g). In general, when electrons are transferred to bind in graphite microcrystals with the insertion of K+, the π* antibond is occupied and the C-C bond is weakened and lengthened, leading to a redshift in the G band. At defects and pore locations, alkali metal ions limit the respiration vibrations of the sp2 carbon rings, causing a weakening of the D-band oscillations [48]. As potassiation proceeds, the position of the D-band does not show a significant shift in the voltage range (> 0.7 V). However, the ID/IG ratio decreased from the initial 1.18 to 1.13 at 0.01 V, indicating that the adsorption of K+ with functional groups and defects is in the plateau region (Fig. 3h). A slight redshift of the G band was also observed in the low-voltage region, which proved that K+ was inserted between the graphite microcrystals [49]. The Raman results suggest that the high potassium storage capacity of the HCNS material is a result of the adsorption-insertion interaction (Fig. 3i).
The composition and structure of the HCNS anode at different charging and discharging states were scrutinized (Fig. S10 in Supporting information). The geometries of the models with different numbers of oxygen functional groups as well as N doping were optimized and the corresponding K+ cation adsorption energies (ΔEads) were calculated. As shown in Figs. S11a–c (Supporting information), the increase of oxygen content promotes the adsorption capacity of K+ in oxygen-doped sp2 carbon from −0.344 eV to −1.124 eV, and the adsorption capacity further increases to −1.375 eV in nitrogen-doped environments, which suggests that nitrogen-oxygen doping increases the adsorption sites and adsorption capacity of K+. In addition, the electron transfer behavior is further demonstrated by the analysis of the difference in charge density after K+ adsorption (Figs. S11d–f and S12 in Supporting information). It can be seen that the introduction of O and N atoms can provide abundant functional group binding sites and enhance the electron transport ability of HCNS, and the excellent electrochemical performance of HCNS can be attributed to the 2D nanosheets and the rich oxygen functional group structure on the surface. It not only slows down the volume change during charging and discharging, which is conducive to the enhancement of capacity, multiplicity capability and cycling stability, but also the combination of O and N co-doping reduces the adsorption barrier of K+ and facilitates the ability of K+ to bind with functional groups on the surface of HCNS [50]. The Nyquist plots of HCNS showed the smallest charge transfer resistance compared to CNS and HCMS (Fig. S13 in Supporting information), suggesting that HCNS has the strongest charge transfer capacity and efficient diffusion of K+.
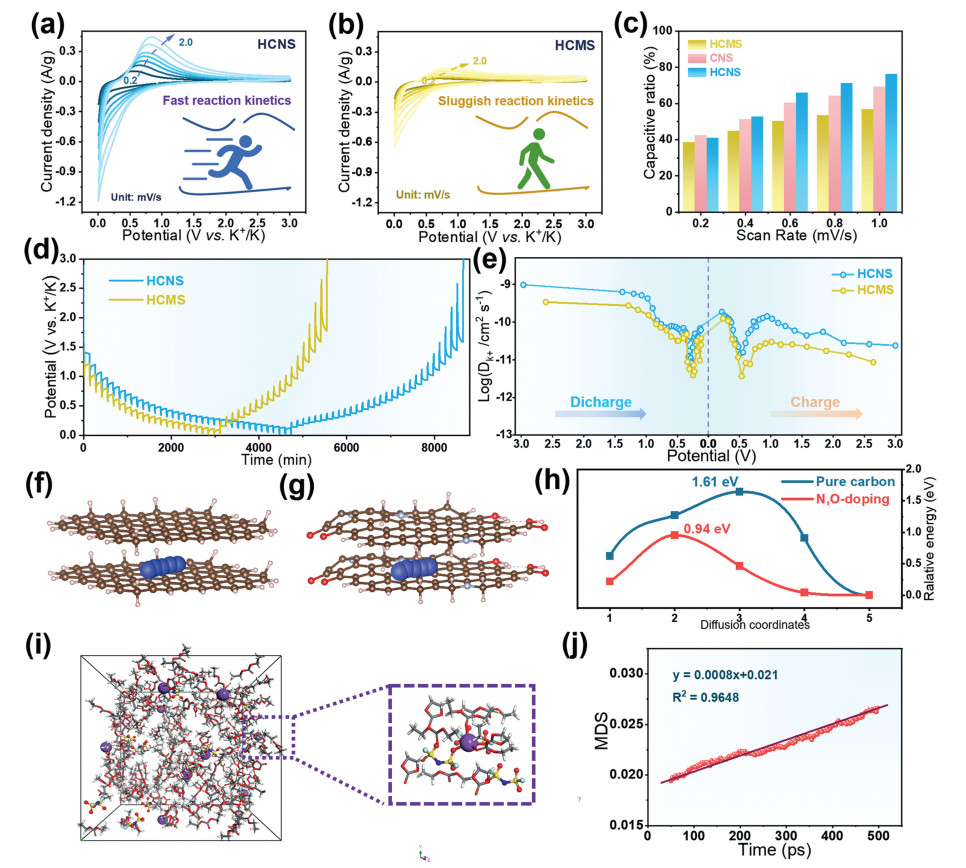
To further understand the K+ storage behaviour, we recorded CV curves at different scan rates to analyses the reaction kinetics (Figs. 4a and b). It can be seen that the peak current of HCNS increases faster than that of the HCMS electrode as the scan rate increases. The fitting curve of the capacitive contribution at 0.6 mV/s is displayed in Fig. S14 (Supporting information). The b values of the peaks of HCMS are 0.79 and 0.46, respectively, which are lower than the b values of HCNS (Figs. S15a and b in Supporting information). At 1.0 mV/s, the pseudocapacitance contribution of HCNS is as high as 75% (Fig. 4c). Therefore, it can be inferred that K+ intercalation in carbon microcrystalline of HCNS is a pseudocapacitive process [51]. K+ diffusion coefficient during charging and discharging at 0.05 C monitored by GITT (Fig. S16 in Supporting information). In general, the HCNS electrode was consistently higher than the HCMS electrode, suggestting faster K+ diffusion kinetics (Fig. 4d) [52]. The diffusion coefficients can be calculated using the reported Fick's second law (detailed in Supporting information). Overall, the diffusion coefficients of the HCNS electrodes were consistently higher than those of the HCMS electrodes during potassiation/depotassiation precipitation, suggesting that the K+ diffusion kinetics were faster (Fig. 4e). K+ diffusion coefficients in slopes and plateaus have different trends with voltage as a result of different potassium storage mechanisms. During the potassiation process, with the increase of potassiation depth, the more K+ adsorbed on the surface active sites in the high-potential slope zone, the higher the repulsive force, which led to the gradual decrease of the K+ diffusion coefficient. Increasing potassiation depth results in a low K+ diffusion coefficient, which may be due to strong attraction between the intercalated K+ in hard carbon graphite [53]. The effects of the intrinsic electronic structures of graphitic carbon layer and nitrogen-oxygen doped sp2 carbon on the migration ability of K+ in bilayer graphene were investigated using DFT calculations. The diffusion energy barriers of K+ in graphitic carbon layer (1.61 eV) and nitrogen-oxygen doped sp2 carbon (0.94 eV) are shown in Figs. 4f and g, respectively, which indicate that nitrogen-oxygen doping lowers the diffusion energy barriers and accelerates the diffusion kinetic behaviors of K+ (Fig. 4h). Molecular dynamics (MD) simulations illustrate the 1.0 mol/L KFSI electrolyte solvation structure in EC and DEC (Fig. 4i). The diffusion coefficient of 1.0 mol/L KFSI was 9.72 × 10⁻⁷ cm2/ps at 298 K (Fig. 4j). The large diffusion coefficient in the electrolyte favors the rapid migration of K+.
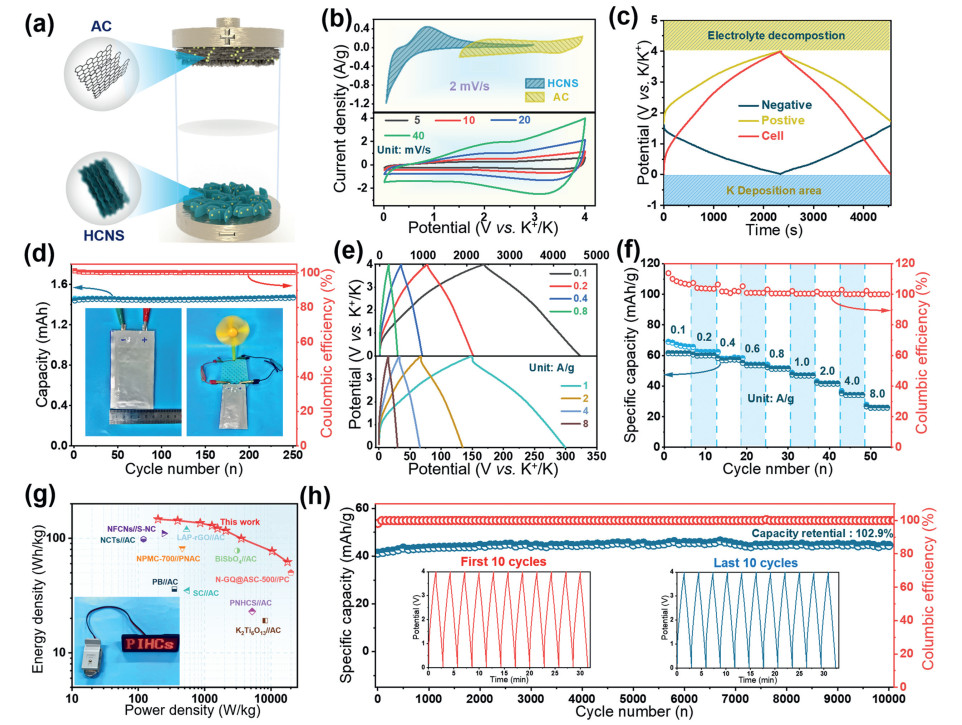
We fabricated a full-cell prototype using preactivated HCNS as a battery-like anode and AC as a capacitive cathode in a KFSI-based organic electrolyte (Fig. 5a). During the charging process, a large number of cations (K+) were successively intercalated to the pre-potassiation HCNS anode, while anions (FSI-) were absorbed to the surface of the AC, and the discharge process was opposite to the charging process. As shown in Fig. S17 (Supporting information), the AC cathode demonstrated stable cycling performance and strong rate performance in potassium half-cells, proving its good utility. Based on the GCD of the anode and cathode, the mass ratio of the HCNS anode to the AC cathode was set at 2:3 (Fig. S18 in Supporting information). The top curve in Fig. 5b clearly shows a consistent match between the HCNS anode and the AC cathode. To understand the respective electrochemical behavior of the cathode and anode, a Swagelok cell was used (Fig. S19 in Supporting information). With a three-electrode PIHC cell, potential fluctuations at the cathode and anode were monitored with an auxiliary K electrode as a function of K/K+ [54]. At a current density of 0.1 A/g, the cathode and anode potential swings were recorded by a Swagelok cell with a K metal reference (Fig. 5c). We further constructed a pouch soft-packed battery. With a discharge current of 100 mA, the pouch cell has a capacity of up to 1.43 mAh and can operate normally for 250 charge/discharge cycles (Fig. 5d). The GCD curves in Fig. 5e are triangular in shape for different current densities. The specific capacities (Fig. 5e, based on the total mass of the cathode and anode) of the HCNS//AC PIHC were 61.4, 60.1, 56.7, 53.0, 50.2, 45.1, 41.2, 35.3 and 28.3 mAh/g at current densities of 0.1, 0.2, 0.4, 0.6, 0.8, 1, 2, 4, and 8 A/g, respectively. Fig. 5f shows the Ragone plot (energy density vs. power density) of the as-fabricated PIHCs. The HCNS//AC PIHC with a power density of 230 W/kg provides a high energy density of 142.6 Wh/kg in the first cycle, and even at the ultra-high power density of 17, 800 W/kg provides an energy density of 61.7 Wh/kg, which is comparable to many of the most recently reported PIHCs. Fig. 5g shows the state-of-the-art electrochemical storage system and the Ragone diagram of the studied PIHC prototype. Most importantly, the HCNS//AC PIHC has an extremely good cycle life, with more than 10, 000 cycles of continuous operation at high current densities of 2 A/g and a capacitance retention of up to 102.9% (Fig. 5h and Table S3 in Supporting Information).
In summary, we have successfully developed a versatile and scalable strategy to obtain hard carbon nanosheets (HCNS) for K+ storage by inducing interfacial assembly and high-temperature carbonization on GO surfaces. Three carbon materials with different microstructures (HCNS, CNS, and HCMS) have been prepared simultaneously. In contrast, the solid structure of HCNS with ordered graphitized nanocrystals exhibits a broader lattice, which enables an intercalation-dominated process. In particular, the large specific surface area of HCNS provides available C = O/O-H groups, which can provide excellent rate capability and cyclic stability for K+ storage. Suitable graphite nanocrystals, more available functional groups and suitable morphology are the key factors to improve potassium storage efficiency.
The authors declare that they have no known competing financial interests or personal relationships that could have appeared to influence the work reported in this paper.
Zhiyuan Liu: Writing – original draft, Software, Methodology, Conceptualization. Hui Peng: Writing – review & editing, Investigation, Funding acquisition, Formal analysis. Xin Wang: Methodology, Investigation. Zhenghao Tang: Methodology, Investigation. Wenbo Hou: Methodology, Formal analysis. Bo Tao: Methodology, Formal analysis. Yue Li: Methodology, Investigation. Guofu Ma: Resources, Funding acquisition. Ziqiang Lei: Supervision, Resources, Funding acquisition.
This work was supported by the National Natural Science Foundation of China (Nos. 22269020, 42167068, U23A20582), Gansu Province Higher Education Industry Support Plan Project (No. 2023CYZC-17) and 2024 Major Cultivation Project for University Research and Innovation Platforms (No. 2024CXPT-10).
Supplementary material associated with this article can be found, in the online version, at doi:
J. Wang, X. Feng, Y. Yu, et al., Nat. Energy 9 (2024) 939–946. doi: 10.1038/s41560-024-01535-5
J. Lian, G. Subburam, S.A. El-Khodary, et al., J. Am. Chem. Soc. 146 (2024) 8110–8119. doi: 10.1021/jacs.3c12051
C. Yang, J. Chen, X. Ji, et al., Nature 569 (2019) 245–250. doi: 10.1038/s41586-019-1175-6
J. Wang, S.A. El-Khodary, D.H.L. Ng, et al., J. Phy. Chem. Lett. 13 (2022) 7273–7279. doi: 10.1021/acs.jpclett.2c01863
Z. Liu, Q. Yu, Y. Zhao, et al., Chem. Soc. Rev. 48 (2019) 285–309. doi: 10.1039/c8cs00441b
Z. Liu, H. Peng, X. Xie, et al., J. Power Sources 543 (2022) 231831. doi: 10.1016/j.jpowsour.2022.231831
Z. Huang, Y.K. Lou, L. Peng, et al., Rare Met. 43 (2023) 51–64.
R. Ma, Y. Chen, Q. Li, et al., Chem. Eng. J. 493 (2024) 152389. doi: 10.1016/j.cej.2024.152389
Q. He, H. Chen, X. Chen, et al., Adv. Funct. Mater. 34 (2024) 2310226. doi: 10.1002/adfm.202310226
M. Shao, C. Li, T. Li, et al., Adv. Funct. Mater. 30 (2020) 2006561. doi: 10.1002/adfm.202006561
Z. Liu, H. Peng, X. Xie, et al., Energy Storage Mater. 65 (2024) 103100. doi: 10.1016/j.ensm.2023.103100
X.F. Wu, Z.J. Li, J.X. Liu, et al., Rare Met. 41 (2022) 3446–3455. doi: 10.1007/s12598-022-02100-3
X. Han, T. Chen, P. Zhang, et al., Adv. Funct. Mater. 32 (2021) 2109672.
J.M. Cao, K.Y. Zhang, J.L. Yang, et al., Chin. Chem. Lett. 35 (2024) 109304. doi: 10.1016/j.cclet.2023.109304
W. Xiong, Y. Xu, F. Zhao, et al., Chin. Chem. Lett. 36 (2025) 109738. doi: 10.1016/j.cclet.2024.109738
G. Cheng, W. Zhang, W. Wang, et al., Carbon Energy 4 (2022) 986–1001. doi: 10.1002/cey2.233
J. Xu, S. Dou, W. Zhou, et al., Nano Energy 95 (2022) 107015. doi: 10.1016/j.nanoen.2022.107015
H. Liu, H. Du, W. Zhao, et al., Energy Storage Mater. 40 (2021) 490–498. doi: 10.1016/j.ensm.2021.05.037
W. Xu, H. Li, X. Zhang, et al., Adv. Funct. Mater. 34 (2023) 2309509.
T. Yao, L. Li, H. Wang, Chin. Chem. Lett. 34 (2023) 108186. doi: 10.1016/j.cclet.2023.108186
X. Chen, N. Sawut, K. Chen, et al., Energ. Environ. Sci. 16 (2023) 4041–4053. doi: 10.1039/d3ee01154b
H. Lei, J. Li, X. Zhang, et al., InfoMat 4 (2022) e12272. doi: 10.1002/inf2.12272
Z. Yu, C. Chen, Q. Liu, et al., Energy Storage Mater. 60 (2023) 102805. doi: 10.1016/j.ensm.2023.102805
J.L. Xia, D. Yan, L.P. Guo, et al., Adv. Mater. 32 (2020) 2000447. doi: 10.1002/adma.202000447
S. Alvin, H.S. Cahyadi, J. Hwang, et al., Adv. Energy Mater. 10 (2020) 2000283. doi: 10.1002/aenm.202000283
M. Cen, Y. Cui, S.A. El-Khodary, et al., Chem. Commun. 59 (2023) 13317–13320. doi: 10.1039/d3cc03994c
K. Yang, W. Zhou, Q. Fu, et al., Adv. Funct. Mater. 33 (2023) 2306190. doi: 10.1002/adfm.202306190
Z. Tang, S. Zhou, P. Wu, et al., Chem. Eng. J. 441 (2022) 135899. doi: 10.1016/j.cej.2022.135899
C. Chi, Z. Liu, X. Lu, et al., Energy Storage Mater. 54 (2023) 668–679. doi: 10.1016/j.ensm.2022.11.008
M. Chen, Y. Cao, C. Ma, H. Yang, Nano Energy 81 (2021) 105640. doi: 10.1016/j.nanoen.2020.105640
Z. Zheng, S. Hu, W. Yin, et al., Adv. Energy Mater. 14 (2023) 2303064.
J. Wang, L. Yan, B. Liu, et al., Chin. Chem. Lett. 34 (2023) 107526. doi: 10.1016/j.cclet.2022.05.040
D. Sun, L. Zhao, P. Sun, et al., Adv. Funct. Mater. 34 (2024) 2403642. doi: 10.1002/adfm.202403642
Z. Jian, S. Hwang, Z. Li, et al., Adv. Funct. Mater. 27 (2017) 1700324. doi: 10.1002/adfm.201700324
Z. Peng, A.G. Bannov, S. Li, et al., Adv. Funct. Mater. 33 (2023) 2303205. doi: 10.1002/adfm.202303205
D. Luo, J. Xu, Q. Guo, et al., Adv. Funct. Mater. 28 (2018) 1805371. doi: 10.1002/adfm.201805371
H. Kim, Y.U. Park, K.Y. Park, et al., Nano Energy 4 (2014) 97–104. doi: 10.1016/j.nanoen.2013.12.009
J. Yin, W. Zhang, W. Wang, et al., Adv. Energy Mater. 10 (2020) 2001705. doi: 10.1002/aenm.202001705
D. Sun, B. Luo, H. Wang, et al., Nano Energy 64 (2019) 103937. doi: 10.1016/j.nanoen.2019.103937
X. Hu, G. Wang, J. Li, et al., Energy Environ. Sci. 14 (2021) 4564–4573. doi: 10.1039/d1ee00370d
C.C. Hou, Y. Wang, L. Zou, et al., Adv. Mater. 33 (2021) 2101698. doi: 10.1002/adma.202101698
J. Chen, B. Yang, H. Hou, et al., Adv. Energy Mater. 9 (2019) 1803894. doi: 10.1002/aenm.201803894
S.W. Zhang, W. Lv, C. Luo, et al., Energy Storage Mater. 3 (2016) 18–23. doi: 10.1016/j.ensm.2015.12.004
J. Chen, Y. Cheng, Q. Zhang, et al., Adv. Funct. Mater. 31 (2020) 2007158.
N. Sun, Z. Guan, Y. Liu, et al., Adv. Energy Mater. 9 (2019) 1901351. doi: 10.1002/aenm.201901351
R. Chen, X. Li, C. Cai, et al., Small 19 (2023) 2303790. doi: 10.1002/smll.202303790
X. Yin, Z. Lu, J. Wang, et al., Adv. Mater. 34 (2022) 2109282. doi: 10.1002/adma.202109282
Y. Qian, S. Jiang, Y. Li, et al., Angew. Chem. Int. Ed. 58 (2019) 18108–18115. doi: 10.1002/anie.201912287
L. Fan, S. Chen, R. Ma, et al., Small 14 (2018) 1801806. doi: 10.1002/smll.201801806
L. Fan, R. Ma, Q. Zhang, et al., Angew. Chem. Int. Ed. 58 (2019) 10500–10505. doi: 10.1002/anie.201904258
J. Wang, J. Polleux, J. Lim, B. Dunn, J. Phys. Chem. C 111 (2007) 14925–14931. doi: 10.1021/jp074464w
Z. Zhu, W. Zhong, Y. Zhang, et al., Carbon Energy 3 (2021) 541–553. doi: 10.1002/cey2.111
W. Li, R. Zhang, Z. Chen, et al., Small 17 (2021) 2100397. doi: 10.1002/smll.202100397
R. Wang, S. Wang, D. Jin, et al., Energy Storage Mater. 9 (2017) 195–205. doi: 10.1016/j.ensm.2017.07.013

Figure 1 (a) Schematic illustration of the formation process of HCNS. SEM images of (b) CNS, (c) HCNS and (d) HCMS. TEM images of (e) CNS, (f) HCNS and (g) HCMS. (h) HRTEM image of HCNS. (i) Schematic of the HCNS lattice.

Figure 2 (a–c) Initial CV cycles for CNS, HCNS and HCMS recorded at a scan rate of 0.1 mV/s. (d, e) The first and second charge-discharge curves of CNS, HCNS and HCMS at 0.1 A/g. (f) Rate performance at various current densities. (g) Long cycle performances and Coulombic efficiency at 2 A/g. (h) A comparison of the electrochemical performance of the HC anode for PIBs.

Figure 3 Identifications of the K+ storage mechanism of the HCNS. (a, b) DFT calculation for K+ insertion into hard carbon structures (Model-1 and Model-2) with an interlayer distance of 3.86 Å. Yellow: K, red: O, brown: C, blue: N, white: H. (c, d) The calculated charge density difference for Model-1 and Model-2. Yellow region represents for electron accumulation, while cyan region represents for electron depletion. (e, f) Ex-situ XRD patterns during the first cycle at 100 mA/g and the corresponding evolution of layer spacing calculated based on the XRD patterns. (g, h) Ex-situ Raman spectra of HCNS at various discharged states: Pristine electrode, galvanically discharged to 0.7, 0.1, 0.01, 0.5, 1.2 and 3.0 V versus K+/K. (i) The illustration of the K+ mechanism of HCNS.

Figure 4 CV curves of (a) HCNS and (b) HCMS at different scan rates (all from 2nd cycle). (c) Calculated contributions of the diffusion and surface-controlled proportions varying from 0.2 mV/s to 1.0 mV/s in HCNS and HCMS. (d, e) Potassium-ion diffusion coefficients at potassiation and de-potassiation process estimated from GITT curves. (f–h) Diffusion paths and diffusion energy barriers for K+ in pure carbon model and nitrogen-oxygen double-doped carbon model. (i) Solvation structures of K+ in the electrolytes: snapshots of the MD simulation cell of 1.0 mol/L KFSI electrolyte. (j) MSD versus time plots.

Figure 5 Capacity performance of HCNS//AC PIHC in full-cell configuration. (a) Schematic image of the assembled full-cell device. (b) CV curves of HCNS and AC in a K half-cell at scan rate of 2 mV/s (top), CV curves of HCNS//AC at different scan rates (bottom). (c) GCD profile based on a three-electrode device at 0.1 A/g. (d) Cycling capability of the pouch-cell PIHC. Inset picture is the assembled pouch-cell PIHC. (e) Charging /discharging curves at the different current densities. (f) Specific capacities under the different discharging current densities. (g) Ragone plots showing energy and power densities versus other reports. (h) Long-term cycling performance at 2 A/g.

 扫一扫看文章

扫一扫关注我们
 DownLoad:
 下载:
下载: