Key Laboratory for Photonic and Electronic Bandgap Materials, Ministry of Education, School of Physics and Electronic Engineering, Harbin Normal University, Harbin 150025, China
b.
Key Laboratory of Thin Film and Microfabrication Technology, Ministry of Education, Department of Micro/Nano-electronics, Shanghai Jiao Tong University, Shanghai 200240, China
c.
Department of Physics, Harbin Institute of Technology, Harbin 150001, China
Received Date:
29 August 2024 Accepted Date:
13 October 2024 Revised Date:
28 September 2024 Available Online:
15 December 2025
Abstract:
Many catalysts have shown excellent activity for the sulfur reduction reaction (SRR), but sluggish electrochemistry kinetics have hindered the development of lithium–sulfur batteries. It has been found that the activity of catalysts for the sulfur evolution reaction (SER) plays a crucial role in determining the overall reaction kinetics. To address this issue, the rational design of catalysts is crucial. Here, we proposed a popular rule to accelerate SER by using chip–like high–entropy perovskite oxide La0.7Sr0.3(Fe0.2Co0.2Ni0.2Zn0.2Mn0.2)O3-δ (LMO–HEO) as advanced electrocatalysts. The strong interaction between the adjacent metal atoms in different metals of LMO–HEO electrocatalysts could lead to a "cocktail effect", which not only greatly improved the catalytic capacity toward sulfur species, but also accelerated the oxidation reaction kinetics of Li2S. As a result, the S/La0.7Sr0.3(Fe0.2Co0.2Ni0.2Zn0.2Mn0.2)O3-δ cathodes delivered excellent cyclic stability with a capacity decay of only 0.025% after 1200 cycles at 2 C. This work has provided a rational design idea for new multifunctional electrocatalysts with high catalytic capacity.
Lithium–sulfur (Li–S) batteries are being extensively researched as a potential next–generation rechargeable system due to their high energy density (2600 Wh/kg), which is caused by a complex conversion reaction between sulfur and lithium sulfide (Li2S), accompanied by a series of intermediate lithium polysulfides (LiPSs) [1–4]. However, the practical application of Li−S batteries still faces numerous challenges [5,6]. Apart from the notorious shuttle effect of the LiPSs, the sluggish redox reaction kinetics of sulfur species have not yet been addressed effectively [7,8]. Recent efforts have aimed to overcome these challenges by constructing new electrode structures [9], synthesizing new electrode materials [10], and introducing catalysts into sulfur cathodes [11–13]. The use of catalysts is an effective approach in Li–S batteries to some extent [14–16]. However, conventional catalysts are limited in their ability to provide multiple active sites for multiphase reactions. Their single active site cannot catalyze the redox reactions of LiPSs simultaneously, especially the oxidation reaction of Li2S, which has a high oxidation overpotential [17]. In summary, it is difficult for conventional catalysts to simultaneously catalyze the redox reactions of LiPSs, especially the oxidation reaction of Li2S.
The development of catalysts that promote the oxidation kinetics of Li2S and accelerate the redox reaction kinetics of sulfur species has become crucial. Catalysts with multiple catalytic active centers and synergistic electrocatalysis ability are expected. Chips have led to revolutionary advances in computing, communications, and all technically related fields. They have enabled the development of technologies like smartphones, 5 G, and Sora. Inspired by the structure and advanced functions of chips, different metal atom units could be integrated into a single solid solution phase. Adjacent atoms of other metals would exhibit strong interactions leading to unexpected physical and chemical properties or synergistic effects, further resulting in multiple active sites. Inspired by the structure and advanced functions of chips, different metal atom units could be integrated into a single solid solution phase. Adjacent atoms of different metals would exhibit strong interactions leading to unexpected physical and chemical properties or synergistic effects [18,19], further resulting in multiple active sites. These sites can significantly improve the catalytic capacity of sulfur species. High–entropy materials (HEMs) generally contain five or more metal cations in a single phase [20–22]. They can be thought of as integrated chips. HEMs have unique properties due to forming a stable single-phase solid solution from multi−metal components. As a result, HEMs can not only combine the advantages of the individual elements, but they also have special properties such as the lattice distortion effect [23], the cocktail effect [24], and the sluggish diffusion effect [25]. The various components in HEMs exhibit catalytic preferences for individual reactions, which gives them unparalleled advantages in multi−step, multi−electron transfer, and multi−phase redox conversions. Recent studies have shown that many HEMs can catalyze LiPS conversions exceptionally well [26–28]. This is because of the tunable atomic composition and synergistic effect of multi-metals, which can act as a strong chemical anchor to capture LiPSs and catalyze their conversions. However, most studies on the catalytic capacity of HEMs have focused on the LiPS reduction process [29,30], and research on their catalytic oxidation ability toward Li2S is still at an early stage.
Herein, an integrated transistor design concept has been proposed to fabricate high-entropy perovskite oxide nanoparticles as a model catalyst for investigating the sulfur evolution reaction (SER). LaMnO3 (LMO) perovskite oxide has a strong polar surface that benefits the chemical adsorption of LiPSs [31]. In this work, LMO was doped with multiple metal atoms to prepare a high-entropy oxide La0.7Sr0.3(Fe0.2Co0.2Ni0.2Zn0.2Mn0.2)O3–δ (LMO−HEO). LMO−HEO provides abundant active sites for catalyzing the Li2S conversion and their interatomic synergy enables rapid charge transfer ability, which accelerates the rapid conversion of Li2S. The Li−S batteries assembled with S/La0.7Sr0.3(Fe0.2Co0.2Ni0.2Zn0.2Mn0.2)O3–δ (S/LMO−HEO) composite delivered a capacity decay of only 0.025% at 2 C after 1200 cycles, which can be attributed to the enhanced sulfur utilization and improved SER kinetics. This work demonstrates that LMO−HEO with an integrated architecture has superior catalytic ability for Li2S conversion and opens a new way to improve the performance of Li–S batteries.
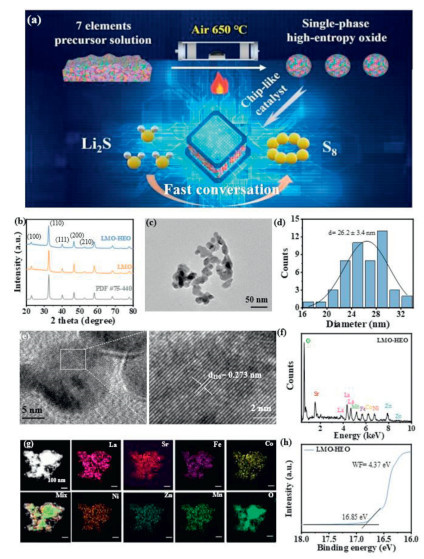
A high−entropy perovskite oxide, La0.7Sr0.3(Fe0.2Co0.2Ni0.2Zn0.2Mn0.2)O3–δ, was synthesized using a conventional liquid−phase method (Fig. 1a). This oxide is composed of seven metal elements that form a single-phase LMO−HEO, enabling the chip-like integration. The interactions between these metal atoms can improve the catalytic performance of LMO−HEO and promote the conversion of Li2S to S8.
Figure 1
Figure 1.
(a) Synthesis schematic illustration of the integrated LMO−HEO. (b) XRD patterns of LMO−HEO and LMO. (c) TEM image, (d) particle size distribution, (e) HRTEM images, (f) EDS spectrum, (g) HAADF−STEM image and the corresponding elemental mapping images, (h) UPS spectrum of LMO−HEO.
X−ray diffraction (XRD) patterns of LMO−HEO and LMO are shown in Fig. 1b. LMO−HEO display a similar diffraction pattern to the LMO (PDF #75−440), which confirms the formation of a single−phase structure with multiple metal components. This leads to the disordered occupation of metal cations in perovskite LMO. The synthesized LMO−HEO consist of interconnected nanoparticles, as shown in Fig. 1c. The particle size distribution of LMO−HEO is quite uniform with a size of 17−33 nm (Fig. 1d). The small nanoparticles increase the interaction area between LMO−HEO and sulfur species and provide numerous active sites for the adsorption of LiPSs and the catalytic conversion of Li2S. LMO nanoparticles show a similar morphology to LMO−HEO (Fig. S1 in Supporting information). High−resolution transmission electron microscopy (HRTEM) images reveal the lattice fringes of LMO−HEO (Fig. 1e). The well−resolved lattice fringes with 0.273 nm correspond to the (110) crystal plane of LMO−HEO. Fig. 1f displays an energy−sispersive X−ray spectroscopy (EDS) spectrum. The spectrum exhibits peaks for La, Sr, Fe, Co, Ni, Zn, Mn, and O. From the corresponding atomic ratios of 16.55:6.72:4.03:4.06:4.05:4.11:4.25:56.23 (Fig. S2 in Supporting information), the chemical stoichiometry of La0.7Sr0.3(Fe0.2Co0.2Ni0.2Zn0.2Mn0.2)O3−δ can be deduced as 1:1:3. Fig. 1g shows a high−angle annular dark−field scanning TEM (HAADF−STEM) image of LMO−HEO nanoparticles and corresponding elemental mapping images, verifying their homogeneous mixture in the LMO−HEO. Based on the analysis, the theoretical configurational entropy of mixing ΔSconfig for LMO−HEO is calculated to be 18.46 J mol−1 K−1, which is much higher than the standard configurational entropy of 1.5 R (12.47 J mol−1 K−1) (Note S1 in Supporting information) [32]. This indicates that LMO−HEO has a more stable structure, which is beneficial for the stable cycle of Li−S batteries [33]. Ultraviolet photoelectron spectroscopy (UPS) measurements show that LMO−HEO has a lower work function (4.37 eV) than LMO (4.48 eV) (Fig. 1h and Fig. S3 in Supporting information). This implies a lower activation barrier for charge transfer, which is advantageous for fast charge transfer between the LMO−HEO surface and Li2S [34,35].
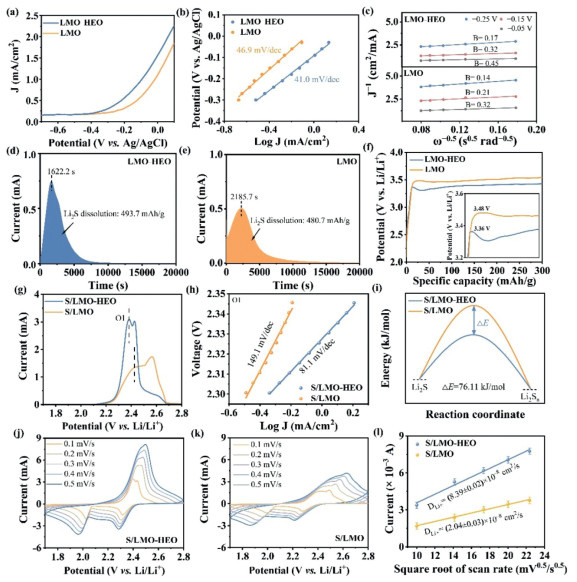
To investigate the catalytic oxidation ability of LMO−HEO towards Li2S, the catalytic behavior in the SER process was studied using linear sweep voltammetry (LSV) with rotating disk electrode measurement. The schematic diagram of the rotating disk electrode test is shown in Fig. S4 (Supporting information). The LMO−HEO electrode shows a higher current density, indicating a more proactive activity in dynamic regulation (Fig. 2a). The corresponding Tafel plots (Fig. 2b) also show a smaller slope of 41.0 V/dec for the LMO−HEO electrode compared to the LMO electrode (46.9 V/dec). The smaller Tafel slope demonstrates an excellent catalytic activity of LMO−HEO in the Li2S conversion. To further investigate the electron transfer in the SER process in the presence of catalysts, LSV measurements were performed at different rotation rates (Figs. S5a and b in Supporting information). The electron transfer numbers of the oxidation reaction can be determined by using the Koutecký−Levich (K − L) equation (Fig. 2c and Note S2 in Supporting information) [36]. The Levich coefficient B is proportional to the electron transfer number n. The LMO−HEO electrodes show a larger value of B than that of the LMO at different potentials, indicating more electron transfer during the oxidation process. It demonstrates that LMO−HEO can provide more electrons for the complete conversion of Li2S. Furthermore, the exchange current density can reflect the difficulty of the electrode reaction. The greater exchange current density indicates a faster electrochemical reaction. The calculated results in Figs. S5c and d (Supporting information) show that the exchange current densities of the LMO—HEO electrode are greater than that of the LMO electrode, suggesting that the LMO—HEO electrode possesses a smaller overpotential and faster electron transfer. The high electrocatalytic activity of LMO−HEO can promote the decomposition of Li2S, as confirmed by potentiostatic charge experiments (Fig. 2, Fig. 2). The LMO−HEO electrode has an earlier current peak (1622.2 s) than the LMO electrode (2185.7 s), indicating the fast oxidation kinetics of Li2S. The superior catalytic performance of the LMO−HEO electrode is also verified by higher capacity contribution (493.7 mAh/g). To directly show the catalytic ability of LMO−HEO toward the Li2S oxidation, the activation potential for the commercial Li2S in the first cycle was investigated (Fig. 2f). The electrode was prepared by mixing LMO−HEO, super p, and Li2S [37]. It can be seen that the LMO−Li2S cathode exhibits a high overpotential of 3.48 V at the first charge. It should be noted that the LMO−HEO−Li2S cathode effectively reduces the oxidation overpotential to 3.36 V, demonstrating its excellent catalytic oxidation ability for Li2S conversion.
Figure 2
Figure 2.
(a) LSV curves of the Li2S oxidation with a rotational rate of 1500 rpm at 10 mV/s and the corresponding (b) Tafel plots and (c) Koutecký−Levich plots with LMO−HEO and LMO electrodes. Potentiostatic charge curves on (d) LMO−HEO and (e) LMO at 2.40 V. (f) First charge voltage profiles of LMO−HEO−Li2S and LMO−Li2S electrodes. (g) CV curves for S/LMO−HEO and S/LMO cathodes at a scan rate of 0.1 mV/s. (h) Tafel plots derived from the oxidation peak. (i) Relative activation energy of Li2S to Li2Sn. CV curves of the (j) S/LMO−HEO cathode and (k) S/LMO cathode from 0.1 mV/s to 0.5 mV/s. (l) Linear relationship between the peak current and the square root of scan rate for the peak O1 in various cells. The variances from three parallel experiments were calculated as error estimates.
To verify the electrocatalysis of the S/LMO−HEO cathode for Li2S conversion, cyclic voltammogram (CV) curves were measured at a scan rate of 0.1 mV/s (Fig. S6 in Supporting information). As depicted in Fig. 2g, the intensities of the oxidation peaks of the S/LMO−HEO cathode are significantly higher than those of the S/LMO cathode. In addition, the oxidation peaks of the S/LMO−HEO cathode shift to a lower potential, suggesting faster SER kinetics. The Tafel plots in Fig. 2h were calculated from the CV profiles in Fig. 2g. The fitted slopes are 149.1 and 81.1 mV/dec for the oxidation peak of S/LMO and S/LMO−HEO cathodes, respectively. The lower slope of the oxidation peak suggests that LMO−HEO have an electrocatalytic function for the fast conversion kinetics of Li2S. Ea was derived from the corresponding Tafel slope [38]. The lower activation energy (Ea) is beneficial for promoting the Li2S conversion. As shown in Fig. 2i, Ea value for the oxidation process of Li2S to Li2Sn is reduced by 76.11 kJ/mol. This phenomenon is due to the superior electrocatalytic activity of LMO−HEO units integrated with multi−metallic atoms. Moreover, CV profiles at different scan rates were used to evaluate Li+ diffusion during oxidation (Fig. 2, Fig. 2). The current peak exhibits a linear relationship with the square root of the scan rate, suggesting a diffusion−controlled process (Fig. 2l). The Li+ diffusion coefficient (DLi+ ) was calculated using the Randles−Sevcik equation (Note S3 in Supporting information) [39]. The higher DLi+ for the S/LMO−HEO cathode is due to the high catalytic capacity of LMO−HEO, which ensured that the reaction continues after Li2S decomposition. Effective catalytic oxidation activity is crucial for increasing the capacity and stable performance of Li−S batteries.
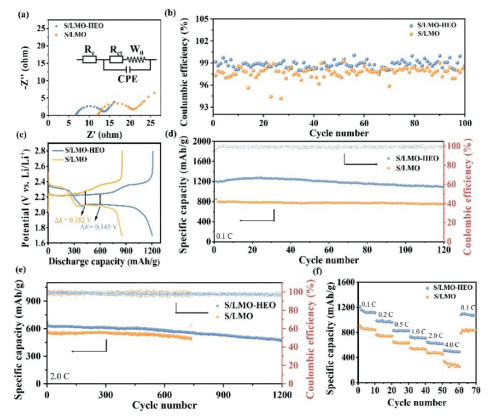
To comprehensively investigate the integration effect of LMO−HEO units to improve the electrochemical performance, S/LMO−HEO, and S/LMO electrodes were used as the cathodes in typical Li−S coin–type batteries. The diameter of the cathode is 13 mm and the area is 1.32 cm2 (Fig. S7a in Supporting information). The sulfur loading of the S/LMO—HEO cathode is around 1 mg/cm2. The thickness of the S/LMO—HEO cathode is around 327 µm as shown in Fig. S7b (Supporting information). The electrochemical impedance spectroscopy (EIS) curves were measured, as shown in Fig. 3a. The corresponding Randles-equivalent circuit at the onset potential is displayed in the inset of Fig. 3a. The charge transfer resistance (Rct) is 7.5 Ω for S/LMO−HEO cathode and 9.5 Ω for S/LMO cathode. The smaller Rct of the S/LMO−HEO cathode proves accelerated interfacial redox kinetics, revealing the superior charge transfer kinetics of the S/LMO−HEO cathode. To test the Li2S conversion ability in different cathodes during the oxidation process, the cells were charged at a higher rate of 0.5 C after the cells had sufficiently deposited Li2S at 0.1 C. It should be noted that the S/LMO−HEO cathode achieves a higher coulombic efficiency than the S/LMO cathode (Fig. 3b), indicating that the Li2S conversion of the S/LMO−HEO cathode is more complete during the charging process. In addition, the specific charging capacity of the S/LMO−HEO cathode is gradually higher than that of the S/LMO cathode during cycles (Fig. S8 in Supporting information), revealing that LMO−HEO effectively promotes the rapid and complete conversion of Li2S and avoids both the formation of 'dead sulfur' and rapid reversible capacity decay, thereby greatly improving the cycle performance. The galvanostatic charge/discharge (GCD) profiles of the cells with a sulfur loading of 1.0 mg/cm2 are presented in Fig. 3c. The S/LMO−HEO cathode delivers a specific capacity of 1204.9 mAh/g at 0.1 C, exceeding that of the S/LMO cathode. The S/LMO−HEO cathode also exhibits lower polarization, indicating reduced activation barriers and favorable electrochemical kinetics. As shown in Fig. 3d, with an initial capacity of 1204.9 mAh/g, the cell with the S/LMO−HEO cathode exhibits a discharge capacity of 1099.6 mAh/g after 120 cycles at 0.1 C with a capacity retention of 90.9%. In contrast, the S/LMO cathode has a lower initial capacity of 854.9 mAh/g and a lower capacity retention of 87.0%. The long−term cycling performance of the above cells was also measured in Fig. 3e. The S/LMO−HEO cathode displays an initial capacity of 667.4 mAh/g at a high rate of 2.0 C and a negligible capacity decay of 0.025% at 1200 cycles. However, the S/LMO cathode cannot be charged and discharged normally after cycling to 733 cycles, and the negligible capacity decay at 733 cycles is 0.028%. The initial capacity of the S/LMO—HEO cathode is 607.5 mAh/g and the corresponding cycling stability of 88.3% is maintained over 300 cycles under a sulfur loading of 4.0 mg/cm2 and E/S ratio of 5.6 µL/mg at 1.0 C. Furthermore, the S/LMO cathode achieves an initial specific capacity of 580.9 mAh/g. However, the cycle performance of the S/LMO cathode is much inferior to the S/LMO—HEO cathode (Fig. S9 in Supporting information). The outstanding cyclic stability of the LMO−HEO electrode also surpasses most reported electrodes (Table S1 in Supporting information). The rate performance with different cathodes is shown in Fig. 3f. The S/LMO−HEO cathode exhibits high discharge capacities of 1209.0, 987.9, 830.6, 731.0, 646.8 and 512.7 mAh/g at 0.1, 0.2, 0.5, 1.0, 2.0 and 4.0 C, respectively, which are higher than those of the S/LMO cathode. When the current density recovers back to 0.1 C, the S/LMO−HEO cathode still has a higher discharge capacity.
Figure 3
Figure 3.
(a) EIS plots of S/LMO−HEO and S/LMO cathodes before cycling, and the corresponding Randles-equivalent circuit at the onset potential: Re, Rct, CPE, W0 are defined as the electrolyte resistance, interfacial charge-transfer resistance, constant phase angle element, and Warburg resistance, respectively. (b) Coulombic efficiency of S/LMO−HEO and S/LMO cathodes at a charging rate of 0.5 C and a discharging rate of 0.1 C. (c) GCD profiles of S/LMO−HEO and S/LMO cathodes at 0.1 C. Cycling performances of S/LMO−HEO and S/LMO cathodes at (d) 0.1 C and (e) 2.0 C. (f) Rate performances of S/LMO−HEO and S/LMO cathodes.
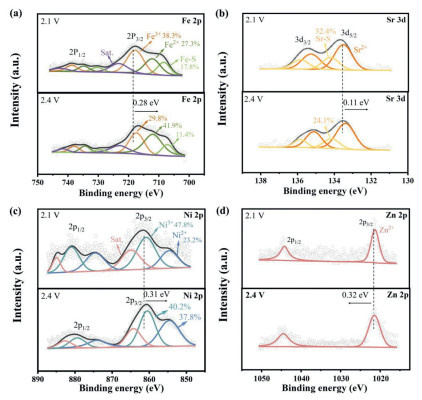
To gain insight into the superior catalytic effect of LMO−HEO units, X−ray photoelectron spectroscopy (XPS) profiles were obtained at different charge potentials to illustrate the valance state changes of LMO−HEO during the SER process. As shown in Fig. 4a, the three peaks of Fe−S (708.06 eV), Fe2+ (712.05 eV), and Fe3+ (717.68 eV) in the Fe 2p3/2 spectrum can be fitted and the relative amounts at 2.1 V can be calculated. When the cell is charged to 2.4 V, the proportion of Fe3+ decreases to 29.8% and that of Fe2+ increases to 41.9%. Meanwhile, the Fe 2p spectrum shifts to a lower binding energy, which is described as electron transfer from Li2S to the active Fe sites. Fig. 4b shows the deconvoluted high−resolution spectra of Sr 3d, and a doublet 3d5/2 and 3d3/2 are observed. The peaks at 133.53 eV and 134.21 eV are assigned to Sr2+ and Sr−S at 2.1 V, respectively. At 2.4 V, the Sr 3d shows a negative shift in binding energy, indicating that Sr sites also contribute to the interaction between LMO−HEO and Li2S. A similar phenomenon can also be seen in the Ni 2p, Mn 2p, and Co 2p spectra (Fig. 4c and Fig. S10 in Supporting information). From the above results, it can be deduced that the highly active LMO−HEO first anchor with the Li2S, whereby the Li−S bond becomes longer and thus weakened. Then, the Li+ can be easily decoupled from the intermediate. The partially delithiated intermediate bonds with another neighboring Li2S molecule and forms a polysulfide chain by repeated delithiation [40]. Note that the proportions of Fe−S and Sr−S decrease to 11.4% and 24.1% at 2.4 V, indicating that the catalytic delithiation reactions continue until the polysulfide chain is detached from LMO−HEO at a certain charge state. In addition, the binding energy of Zn 2p3/2 at 2.4 V displays a positive shift of 0.32 eV (Fig. 4d), suggesting that a strong depletion of electrons occurs around Zn atoms. From this it can be deduced that lost electrons are transferred to other metal active sites, weakening the metal−S bond, accelerating the detachment of the polysulfide chain from LMO−HEO and completing the oxidation to solid S8 [41]. The holistic catalytic effect lies in the fast electron transfer from site-to-site on the surface of LMO−HEO during the SER process, which generates a more continuous charge regulation, favoring the multielectron reactions. To sum up, the XPS analysis investigated the interaction between LMO−HEO and Li2S and indicated that the different elements in LMO−HEO can be coordinated with more than one Li2S molecule, which would enable multiple catalytic reactions simultaneously. And the synergistic effect of multiple elements in the microenvironment of the LMO−HEO units contributes to the rapid electron transfer between the catalyst and Li2S in the SER process and promotes the rapid conversion reaction of Li2S.
Figure 4
Figure 4.
(a) Fe 2p, (b) Sr 3d, (c) Ni 2p, and (d) Zn 2p XPS spectra of S/LMO−HEO cathode at 2.1 V and 2.4 V during charging.
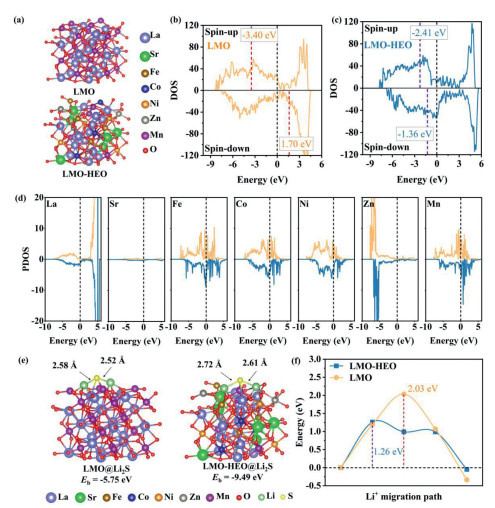
To investigate the different catalytic mechanisms of LMO and designed LMO−HEO, we performed DFT calculations. The most stable relaxed structures of LMO and LMO−HEO are provided in Fig. 5a. In this study, we generated three random configurations of LMO—HEO and performed DFT calculations to optimize their geometric structures (atomic arrangements). To simplify the element substitution process, we randomly generated replaceable sites, such as La and Mn sites, and substituted them with Sr and (Co, Fe, Ni, Zn), respectively. The three different doping methods were implemented by modifying the element order in the POSCAR file of the VASP input. Since all configurations share the same chemical composition, we identified the most stable configuration based on the lowest total energy. The structure optimization was carried out with a cutoff energy of 500 eV, and the process was terminated once the energy convergence reached 10−5 eV and the atomic forces were reduced to 0.01 eV/Å. The key parameters used in VASP were: PREC = Accurate, ISIF = 2, POTIM=0.2, SIGMA = 0.1, and NSW = 800. The three configurations are presented in Note S4 (Supporting information). The densities of states (DOS) of LMO and LMO−HEO are shown in Fig. 5, Fig. 5, where the d−band center is at −3.40 eV (spin−up) and 1.70 eV (spin−down) for LMO, and −2.41 eV and −1.36 eV for LMO−HEO. The d−band centers undergo a significant shift to the Fermi level for LMO−HEO, suggesting increased transferred electrons and strengthened bonding ability of the LMO−HEO. In addition, LMO−HEO exhibits a much higher DOS near the Fermi level, indicating that doping with transition metals can increase electrical conductivity. We further explored the effects of these incorporated atoms on the d−band center. Specifically, the d−band center (spin−up) of doped Sr, Fe, Co, Ni, and Zn are −1.02, −1.83, −2.41, −3.04, and −6.20 eV, respectively, (−0.50, −0.41, −1.04, −1.53, and −5.31 eV for spin−down), indicating that the doped Sr, Fe, and Co contribute to the upshift of the overall d−band centers of LMO−HEO. In Fig. 5d, the doped Fe, Co, and Ni have higher projected DOS (PDOS) near the Fermi level, all of which contribute to the electrical conductivity of LMO−HEO. Moreover, there are a large number of electronic states near −6.0 eV in the PDOS of doped Zn, suggesting the important role of doped Zn as an electron donor, which is consistent with the XPS results of electron depletion around Zn atoms [38]. Also, doped Sr has same lattice sites with that of La, and La is the dominant component in the LMO, thus the PDOS of Sr does not show high peak intensity. The above results show that the doping of these strongly magnetic transition metals imparts higher overall activity to the LMO−HEO. In particular, the effect of doped Fe and Co is significant, both in terms of shifting the d-band center and improving the electrical conductivity.
Figure 5
Figure 5.
(a) Relaxed structures of LMO and LMO−HEO. (b) DOS of LEO and (c) LMO−HEO. (d) PDOS of metal elements in LMO−HEO. (e) Binding structure of LMO@Li2S and LMO−HEO@Li2S. (f) Li+ migration energy barrier on LMO and LMO−HEO.
These findings affect interactions with Li2S molecules were shown in Fig. 5, Fig. 5. The calculated binding energy (Eb) between LMO−HEO and Li2S (−9.49 eV) is significantly higher than that of LMO and Li2S (−5.75 eV), which indicates that LMO−HEO may interact more strongly with Li2S and promote the continuation of the SER. The main evolution of Li2S consists of Li−S bond breaking and Li+ dissociation [42]. The bond lengths of Li−S for Li2S in the adsorption configuration of LMO−HEO (2.72 Å and 2.61 Å) are longer than that of LEO (2.58 Å and 2.52 Å), that is, the bond energy of Li−S on LMO−HEO is weaker than the bond energy on LMO, resulting in the Li−S bond more easily broken and accelerating the conversion of Li2S to polysulfide chain. This is consistent with the results of XPS experiments. Moreover, as shown in Fig. 5f, compared to LMO (2.03 eV), LMO−HEO significantly reduces the migration energy barrier (1.26 eV) of Li+ in Li2S, which demonstrates that Li−S is more likely to be dissociated (decomposition of Li+) on LMO−HEO, thus promoting the rapid dissociation of Li2S [43]. The above results corroborate that the active LMO−HEO nanoparticles can effectively accelerate the dissociation of Li2S and promote the complete oxidation of Li2S.
In summary, the presented nano high−entropy perovskite oxide La0.7Sr0.3(Fe0.2Co0.2Ni0.2Zn0.2Mn0.2)O3−δ catalysts demonstrate that the strong interaction between the adjacent atoms in different metals determines the SER activity and battery stability, which promotes the SER process, boosts the oxidation reaction kinetics of Li2S, and enhances the stable performance of Li−S batteries. The experimental results confirm the superior catalysis of LMO−HEO. The different metal atoms have a unique synergistic effect on the cascade conversion of Li2S. Thus, LMO−HEO exhibit excellent catalytic activity for the Li2S oxidation and contribute to excellent cycle stability. The S/LMO−HEO cathodes exhibit a capacity decay of only 0.025% after 1200 cycles at 2 C. This work demonstrates the advantages of the high–entropy oxides in catalyzing the SER process.
Declaration of competing interest
The authors declare that they have no known competing financial interests or personal relationships that could have appeared to influence the work reported in this paper.
This study was partially supported by grants from the National Natural Science Foundation of China (No. 52072099). Team program of the Natural Science Foundation of Heilongjiang Province, China (No. TD2021E005). Joint Guidance Project of the Natural Science Foundation of Heilongjiang Province, China (No. LH2022E093).
Supplementary materials
Supplementary material associated with this article can be found, in the online version, at doi:10.1016/j.cclet.2024.110551.
[1]
Q.H. Li, J.M. Liu, F.L. Chu, et al., Chin. Chem. Lett. 31 (2024) 110306.
[2]
X.Y. Li, S. Feng, C.X. Zong, et al., J. Am. Chem. Soc. 144 (2022) 14638–14646. doi: 10.1021/jacs.2c04176
Figure 2
(a) LSV curves of the Li2S oxidation with a rotational rate of 1500 rpm at 10 mV/s and the corresponding (b) Tafel plots and (c) Koutecký−Levich plots with LMO−HEO and LMO electrodes. Potentiostatic charge curves on (d) LMO−HEO and (e) LMO at 2.40 V. (f) First charge voltage profiles of LMO−HEO−Li2S and LMO−Li2S electrodes. (g) CV curves for S/LMO−HEO and S/LMO cathodes at a scan rate of 0.1 mV/s. (h) Tafel plots derived from the oxidation peak. (i) Relative activation energy of Li2S to Li2Sn. CV curves of the (j) S/LMO−HEO cathode and (k) S/LMO cathode from 0.1 mV/s to 0.5 mV/s. (l) Linear relationship between the peak current and the square root of scan rate for the peak O1 in various cells. The variances from three parallel experiments were calculated as error estimates.
Figure 3
(a) EIS plots of S/LMO−HEO and S/LMO cathodes before cycling, and the corresponding Randles-equivalent circuit at the onset potential: Re, Rct, CPE, W0 are defined as the electrolyte resistance, interfacial charge-transfer resistance, constant phase angle element, and Warburg resistance, respectively. (b) Coulombic efficiency of S/LMO−HEO and S/LMO cathodes at a charging rate of 0.5 C and a discharging rate of 0.1 C. (c) GCD profiles of S/LMO−HEO and S/LMO cathodes at 0.1 C. Cycling performances of S/LMO−HEO and S/LMO cathodes at (d) 0.1 C and (e) 2.0 C. (f) Rate performances of S/LMO−HEO and S/LMO cathodes.
Figure 5
(a) Relaxed structures of LMO and LMO−HEO. (b) DOS of LEO and (c) LMO−HEO. (d) PDOS of metal elements in LMO−HEO. (e) Binding structure of LMO@Li2S and LMO−HEO@Li2S. (f) Li+ migration energy barrier on LMO and LMO−HEO.

 DownLoad:

 下载:
下载:


