Received Date:
01 May 2024 Accepted Date:
16 July 2024 Revised Date:
10 July 2024 Available Online:
15 August 2025
Abstract:
Halide electrolytes, renowned for their excellent electrochemical stability and wide voltage window, exhibit significant potential in the development of high energy density solid-state batteries featuring high voltage cathode materials. In this study, we present the development and synthesis of a 0.6Li2S-ZrCl4 solid electrolyte, demonstrating an ion conductivity of 1.9 × 10⁻³ S/cm at 25 ℃. Under a pressure of 500 MPa, the relative density of the electrolyte can reach 97.37%, showcasing its commendable compressibility. 0.6Li2S-ZrCl4 served as the electrolyte, and we assembled batteries utilizing a LiCoO2 (LCO) positive electrode, Li9.54Si1.74P1.44S11.7Cl0.3 (LSPSCl) coating, and Li-In negative electrode for laboratory testing. At 25 ℃, this all-solid-state battery demonstrated an impressive discharge capacity retention rate of 86.99% (with a final discharge specific capacity of 110.5 mAh/g) after 250 cycles at 24 mA/g and 100 MPa stack pressure. Upon substituting the positive electrode material with LiNi0.8Mn0.1Co0.1O2 (NMC811) and assembling an all-solid-state battery, it demonstrated a discharge capacity retention rate of 74.17% after 200 cycles at 3.6 mA/g and 100 MPa stack pressure in an environment at 25 ℃ (with a final discharge specific capacity of 103.3 mA/g). Our findings hold significant implications for the design of novel superionic conductors, thereby contributing to the advancement of all-solid-state battery technology.
Compared to traditional lithium-ion batteries, all-solid-state lithium batteries (ASSLBs) are more appealing because of their enhanced safety, thermal stability, higher energy density, and increased voltage compatibility [1, 2]. Extensive efforts have been dedicated to solid electrolyte research, leading to the discovery of various high-performance solid electrolytes (SEs), including oxides, sulfides, borohydride, and polymer electrolytes [3-5].
Regarding research on these electrolytes, oxide solid electrolytes exhibit high ion conductivity, excellent air stability, and good electrochemical stability [6-8]. However, their production process becomes complex due to the requirement for high-temperature sintering. Simultaneously, their higher electronic conductivity renders them more susceptible to lithium dendrite formation compared to other electrolytes. Due to their poor mechanical performance, they exhibit high interface resistance when in contact with the electrode [9-11]. Sulfide solid electrolytes possess good mechanical properties and excellent ion conductivity. However, their air stability is poor, and their electrochemical oxidation potential is low, typically only 2–3 V, rendering them susceptible to side reactions at the positive electrode, leading to capacity degradation [12-14]. Although boron hydrogen solid electrolyte exhibits ultrafast ionic conduction, it also necessitates sintering and involves expensive raw materials, resulting in poor anode stability [15]. Although polymer electrolytes offer enhanced safety compared to liquid batteries, they exhibit lower ion conductivity and a narrower potential window, low mechanical strength, easily punctured by lithium dendrites [16-18]. For this purpose, we investigated halide electrolytes with high pressure resistance, dendrite resistance, and a simple manufacturing process [19-21].
Recent years have seen the emergence of halide solid electrolytes with high ionic conductivity, exemplified by Li3InCl6 reaching 2.04 × 10⁻³ S/cm [22, 23], Li3ScCl6 reaching 3 × 10⁻³ S/cm [24], and Li3YBr6 reaching 7.2 × 10⁻⁴ S/cm [25, 26]. Moreover, they exhibit high oxidation potential, with fluoride electrolytes even surpassing 6 V vs. Li/Li+ and chloride electrolytes also exceeding 4 V vs. Li/Li+, thereby better matching most positive electrode materials [27]. The Li2ZrCl6 electrolyte, composed of low-cost and abundantly available Zr, has been reported to exhibit a conductivity of 4.0 × 10⁻⁴ S/cm at 30 ℃ [28]. However, there remains a significant disparity in its excellent ion conductivity compared to sulfide electrolytes, leading to poor performance of the solid-state battery comprising it. Although ongoing research aims to enhance the ion conductivity of Li2ZrCl6 electrolyte, H. Kwak et al. proposed Fe3+ doping to achieve this [29], Liang et al. proposed introducing Li2O into Li2ZrCl6 to synthesize 0.5Li2S-ZrCl4, achieving a conductivity of 2.42 × 10⁻³ S/cm [30], and S. Chen et al. improved the electrolyte performance by adding In3+, Fe3+, and Y3+ to Li2ZrCl6 [26, 31, 32]. Developing Li2ZrCl6-based electrolytes with higher ion conductivity is of paramount importance for enhancing halide solid-state batteries.
This study involved doping sulfur (S) into the Li2ZrCl6-based electrolyte to synthesize a halide sulfur solid electrolyte (0.6Li2S-ZrCl4) with high ion conductivity and good mechanical properties. It exhibits an ion conductivity of 1.9 × 10⁻³ S/cm at 25 ℃ and can be compressed to a density of 97.37% at 500 MPa, ensuring stable long-term cycling of lithium batteries. When 0.6Li2S-ZrCl4 is combined with a LCO positive electrode and a LSPSCl-coated Li-In negative electrode to assemble a battery, it demonstrates good electrochemical performance, with an initial Coulombic efficiency of up to 93.65%. After 250 cycles under a wide voltage window of 2.4–3.6 V (relative to Li-In/Li+), 24 mA/g (0.2 C), and 25 ℃ conditions, it exhibits a discharge capacity retention rate of 86.99% (with a final discharge specific capacity of 110.5 mAh/g). After replacing the positive electrode material with NMC811 and constructing an all-solid-state battery, it demonstrated a discharge capacity retention rate of 74.17% after 200 cycles at 3.6 mA/g in an environment at 25 ℃ (with a final discharge specific capacity of 103.3 mA/g). Its superior electrochemical performance and compressibility compared to Li2ZrCl6 electrolyte demonstrate promising application prospects. xLi2S-ZrCl4 (x = 0.4, 0.5, 0.6, 0.7, 0.8) compounds were synthesized via mechanochemical methods. Utilize Li2S (99.9%, Aladdin), LiCl (99.9%, Aladdin), and ZrCl4 (98%, Innochem) powders directly. The powder is mixed with 10 mm tungsten carbide balls for ball milling (Fritsch P7), pre-mixed at 100 rpm for 1 h, and then subjected to high-energy grinding at 500 rpm for 10 h for mechanochemical synthesis. Li2ZrCl6 was similarly synthesized using the aforementioned method. The LSPSCl solid electrolyte was procured from Guilin Electric Appliance Science Research Institute Company. Hereinafter, xLi2S-ZrCl4 and Li2ZrCl6 are collectively denoted as LZCSx and LZC, respectively.
Rigaku D/MAX-2500/PC (Cu Kα) X-ray diffraction (XRD) was conducted using a scanning rate of 3°/min over the range of 10°–80°. Throughout the experiment, the powder was encapsulated onto a sample holder using polyimide film within an argon glove box (H2O≤ 1 ppm, O2 ≤ 1 ppm) to prevent air exposure. Morphological characterization, processing, and elemental mapping of the samples were conducted via focused ion beam scanning electron microscopy (SEM, FIB-Helios G4 Cx, Thermo Fisher Scientific). Mount the sample onto the scanning sample holder within a glove box, and subsequently transfer it via an argon (Ar) atmosphere transfer device, ensuring a seamless transition from the glove box to FIB-SEM without air exposure.
Prior to conducting the conductivity test, 100 mg of solid electrolyte powder was placed into a 10 mm diameter polyether ether ketone (PEEK) mold within an Ar glove box. Subsequently, a hydraulic press (Tianjin Hengchuanglida Technology Development Company, YPH-600B) was utilized on two stainless steel rods (Jiangsu Xinzhi Technology Company, 20230511R1) at a pressure of 500 MPa for 5 min, which was sustained throughout the measurement process. Electrochemical impedance spectroscopy (EIS) measurements were performed at room temperature (25 ± 5 ℃) using the Princeton P1000, spanning a frequency range of 0.1 Hz to 1 MHz with a measurement error within 3%. The electronic conductivity was determined by employing a direct current (DC) polarization measurement with a voltage of 0.5 V.
The electrochemical stability of LZCS0.6 and LZC was evaluated by linear sweep voltammetry (LSV) measurements on Li/LSPSCl-LZCS0.6/LZCS0.6 + C and Li/LPSCL-LZC/LZC + C batteries. Initially, 40 mg of LSPSCl powder (99.0%) was weighed within a glove box and deposited into a 10 mm diameter PEEK mold. The powder was then compressed into an electrolyte sheet under a pressure of 100 MPa. Next, 30 mg of LZCS0.6 powder was evenly distributed onto one side of the electrolyte and compressed under a pressure of 350 MPa. Subsequently, 10 mg of the working electrode (LZCS0.6 or LZC with C (Shenzhen Kejing Zhida Technology Company, 99.9%, 20 nm)) was hand-mixed in a weight ratio of 8:2 onto the opposite side of the electrolyte sheet and pressed under a pressure of 500 MPa. A piece of lithium foil (99.9%, Tianjin Energy Lithium Industry Company) was connected as the counter electrode. LSV measurements were conducted using a Princeton P1000 electrochemical workstation at a scanning rate of 0.1 mV/s and a temperature of 25 ℃.
The assembly of solid-state batteries for cyclic testing was conducted in an Ar glove box. LCO (Shenzhen Kejing Zhida Technology Company) or NMC811 (Shenzhen Kejing Zhida Technology Company) was mixed with LZCS or LZC in the 7:3 wt ratio using the planetary grinder (Mickey Instruments Company, ZQM-4 L) at 200 rpm for 6 h. Initially, the battery assembly utilized a hydraulic press (Tianjin Hengchuang Lida Technology Development Company, YPH-600B) to deposit 40 mg of LSPSCl powder into a 10 mm diameter peek mold and compress it into a sulfide protective layer under 100 MPa of pressure. This layer serves to prevent LZCS0.6 from reacting with the negative electrode. Then, 30 mg of LZCS0.6 powder was sprinkled onto one side of the electrolyte sheet and pressed under 350 MPa of pressure. Subsequently, composite positive electrode was sprinkled onto one side of LZCS0.6 and pressed for 5 min under 500 MPa of pressure. Finally, a piece of indium foil (Alfa Aesar, 99.99%) is placed atop the LSPSCl layer, and a piece of lithium foil is attached. The battery is cycled using the LAND CT2001A battery testing system under 100 MPa of external pressure and at a temperature of 25 ℃. Throughout the cycling process, the battery is placed in a culture incubator (Shanghai Longyue Instrument Equipment Company, LBI-300HT) to maintain a temperature of 25 ℃.
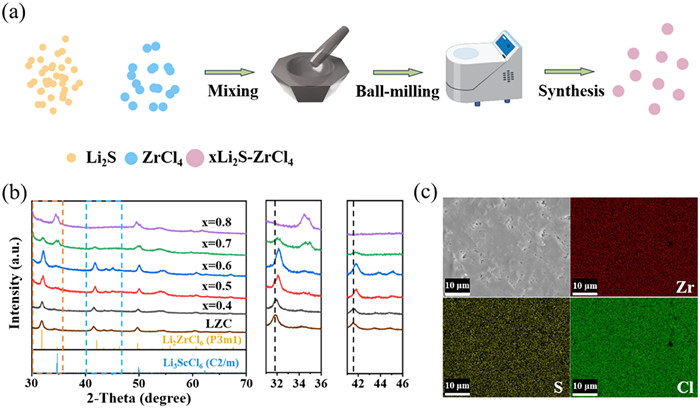
To examine the impact of S doping on the crystal structure of electrolytes, LZCSx (x = 0.4, 0.5, 0.6, 0.7, 0.8) was characterized using XRD. Fig. 1a illustrates the process of one-step ball milling synthesis of LZC and LZCSx (x = 0.4, 0.5, 0.6, 0.7, 0.8). Initially, Li2S and ZrCl4 were weighed according to their nominal composition, mixed uniformly in a mortar, and subsequently introduced into a ball mill for high-energy ball milling. Fig. 1b depicts the XRD pattern of the sample post ball milling. With an increase in the S doping level, the peak shifts towards a higher diffraction angle. In the undoped state (x = 0) to x = 0.6, the sample exhibits a cubic phase crystal structure, with the characteristic Bragg reflection of the cubic phase showing P3m1 [33], resembling the structure of LZC. However, when the doping level exceeds 0.6, the sample undergoes a phase transition, gradually transitioning into a monoclinic phase (C2/m) with a structure akin to Li3ScCl6 [34]. At x = 0.7, the sample exhibits both tripartite and monoclinic phases, while at x = 0.8, the sample exclusively consists of a monoclinic phase. Consequently, with the increase in S content, the crystalline structure gradually transitions from a triangular phase to a monoclinic phase, suggesting a gradual replacement of Cl by S. Simultaneously, owing to the similar radii between Cl- (181 pm) and S2- (184 pm), along with the shift of XRD peaks, it can be inferred that S2- replaces Cl- more readily [35, 36]. Fig. 1c depicts the SEM image of the electrical sample, illustrating uniform element distribution.
Figure 1
Figure 1.
(a) Ball milling synthesis route for xLi2S-ZrCl4 SSE. (b) XRD patterns of the mechanochemically synthesized xLi2S-ZrCl4 with magnified regions of 30°−36°, 41°−46°. (c) EDS after compressing the raw material of xLi2S-ZrCl4 into blocks. Red represents Zr, Yellow represents S, Green represents Cl.
Fullprof was employed to refine the structural data of LZC and LZCS0.6 [37]. The detailed XRD patterns are presented in Figs. S1a and S2 (Supporting information), while the refined results are documented in Tables S1 and S2 (Supporting information). The lattice constant an increased from 10.97100 Å in LZC to 12.73588 Å in LZCS0.6, while the lattice constant c increased from 5.92540 Å to 7.17167 Å This change can be attributed to the longer bond length of Li-S (3.02481 Å) compared to that of Li-Cl (2.91814 Å). The increase in crystal volume widens the channels for Li+ ions and enhances the ion conductivity of the solid electrolyte [29, 38, 39]. As depicted in Fig. S1b (Supporting information), the LZCS0.6 tripartite phase comprises hcp anionic stacking, forming six X (X = Cl or/and S) octahedra with central positions occupied by Zr4+, Li+, or vacancies. Three asymmetric Cl sites were observed, with S selectively occupying the Cl1 (6i), Cl2 (6i), and Cl3 (6i) sites, respectively. This indicates the successful doping of S into the electrolyte, thereby enhancing ion conductivity.
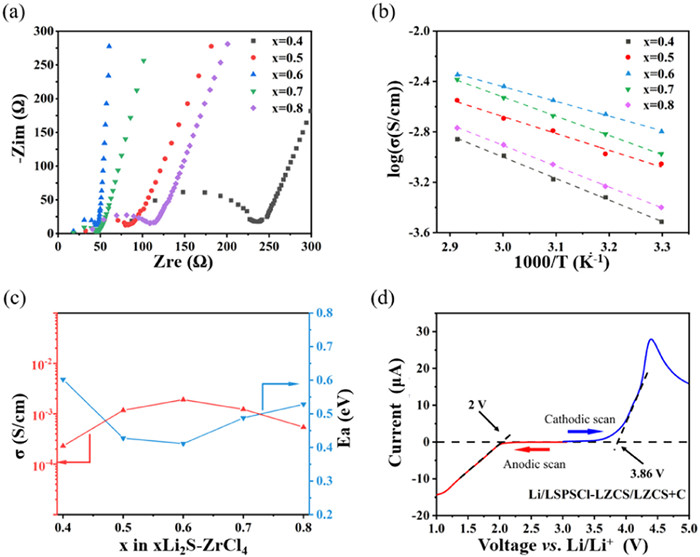
In order to assess its viability as a solid electrolyte, we conducted measurements of the lithium-ion conductivity and electrochemical stability window of LZCSx. We employed AC impedance technology to investigate the impedance of LZCSx SE. The Nyquist plot of impedance at room temperature is depicted in Fig. 2a. The total ionic conductivity of the synthesized SE was calculated based on the local minimum resistance at the intersection of the impedance spectrum. The calculated values are presented in Fig. 2c, indicating that at a doping amount of 0.4, the ion conductivity of LZCS0.4 is 0.23 × 10⁻³ S/cm. The ion conductivity increases with the increasing doping amount, reaching its maximum value at a doping amount of 0.6 (LZCS0.6, 1.91 × 10⁻³ S/cm). As depicted in Fig. S3a (Supporting information), there is a significant improvement compared to LZC (0.34 × 10⁻³ S/cm). Subsequently, the ion conductivity decreases with a further increase in doping concentration. The ion conductivity of LZCS0.8 is 0.54 × 10⁻³ S/cm. Solid-state electrolytes exhibit promising application prospects owing to their high energy density. However, the proliferation of lithium dendrites in solid-state batteries surpasses that in liquid-state batteries. Reports suggest that the primary catalyst for dendritic growth in solid-state batteries is the high ion conductivity of electrolytes [40]. Thus, lower ion conductivity becomes a requisite for an optimal electrolyte. As depicted in Fig. S4a (Supporting information), the electronic conductivity of LZCS0.6 at room temperature is 4.145 × 10⁻¹⁰ S/cm, compared to LZC (Fig. S4b in Supporting information), it exhibits better electronic insulation performance. The reciprocal temperature dependence of LZCSx ion conductivity is illustrated in Fig. 2b. The logarithm of conductivity (logσ) shows a linear correlation with the reciprocal of temperature (1/T), following the Arrhenius law, indicating good thermal stability for all prepared samples. Likewise, LZCS0.8 demonstrates the highest conductivity within the measured temperature range. The activation energy (Ea) is calculated from the slope of the (1/T) graph through the equation σ = Aexp(-Ea/kBT), where σ is the conductivity, A is a pre-exponential factor, and kB is the Boltzmann constant. As depicted in Fig. 2c, at a doping amount of 0.4, the activation energy reaches its maximum value (601.9 meV). At a doping amount of 0.5, the activation energy decreases to 427.6 meV. At the minimum doping amount of 0.6, the activation energy is 411.2 meV. Subsequently, the activation energy increases with the increasing doping amount. At doping amounts of 0.7 and 0.8, the activation energies are 487.8 and 528.4 meV, respectively. As depicted in Fig. S3b (Supporting information), the activation energy of LZCS0.6 is significantly lower than that of LZC (743.2 meV), which also explains its increased ion conductivity.
Figure 2
Figure 2.
(a) Electrochemical property. (b) Arrhenius conductivity plots. The activation energy was measured under conditions of 30, 40, 50, 60, and 70 ℃. (c) Ionic conductivities at 25 ℃ and activation energies of xLi2S-ZrCl4. (d) LSV curves of the Li/LSPSCl-LZCS0.6/LZCS0.6 + C battery. Lithium as negative electrode of battery, LZCS0.6 + C as the positive electrode of battery.
An electrochemical window evaluation was performed on an asymmetric battery using cyclic voltammetry (CV). The battery configuration included a mixture of LZC or LZCS0.6 and C as the cathode, LZC or LZCS0.6 as the electrolyte, LSPSCl as the protective layer, and Li as the anode. The addition of C can enhance the reaction rate on the cathode and improve the detectable current signal [41]. A positive scan of the battery was conducted at a scanning rate of 0.1 mV/s, followed by a negative scan, to obtain oxidation and reduction windows sequentially for evaluating the stability of redox reactions. As depicted in Fig. 2d, the reduction potential and ·oxidation potential of LZCS0.6 are 2 V and 3.86 V [28], respectively, which are wider than the potential windows of LZC (2.05 and 3.75 V) (Fig. S5 in Supporting information). This suggests that the S-doped LZCS0.6 solid electrolyte enables the ASSLB to operate within a wider electrochemical window.
The voltage window of the electrolyte indicates its compatibility with the positive and negative electrodes. Extensive efforts have been made to improve the compatibility of the electrolyte with the positive and negative electrodes [42-45]. Regrettably, halide electrolytes are highly unstable when exposed to the negative electrode. To address this issue, it has been proposed to place sulfide-based materials as protective layers between the halide and the negative electrode [45]. The study aims to investigate whether the addition of sulfur enhances the stability of LZC-based electrolytes towards the negative electrode. Four types of batteries were constructed: Li/LZC/Li, Li/LZCS0.6/Li, Li/LSPSCl-LZC-LSPSCl/Li, and Li/LSPSCl-LZCS0.6-LSPSCl/Li. As depicted in Fig. S6 (Supporting information), the battery equipped with the original LZC electrolyte operates for 100 cycles. Despite the presence of polarization phenomenon, its stability regarding lithium is markedly superior to LZCS0.6. Research has shown that sulfide and halide electrolytes can synergistically complement each other, with sulfide electrolytes typically employed near the positive electrode side and halide electrolytes preferably utilized near the negative electrode side [46]. The addition of LSPSCl as a protective layer on both sides of the LZCS0.6 electrolyte significantly enhances the stability of lithium within LZCS0.6.
Solid electrolytes suitable for ASSLB require not only high ionic conductivity but also good compressibility [47, 48]. Otherwise, it becomes challenging to tightly integrate the solid electrolyte with the positive and negative electrodes, leading to increased interface resistance that affects battery performance [49]. The compressibility of solid electrolytes can be directly measured by the relative density of cold-pressed particles under the same pressure. Materials with better compressibility will exhibit higher relative density in cold-pressed particles. To investigate this characteristic of LZCS, we compressed its powder into particles under a pressure of 500 MPa. For comparison, we prepared these cold-pressed particles using two other widely studied solid electrolytes under the same pressure: LSPSCl and LZC.
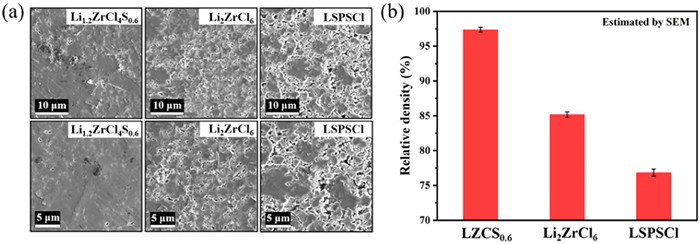
Inspect the surface morphology of the particles using scanning electron microscopy (SEM). The images, captured at two different magnifications, are depicted in Fig. 3a. The particle density of LSPSCl solid electrolyte is the smallest, with numerous large voids present on its surface. Conversely, the pores of chloride solid electrolytes are smaller, indicative of a higher particle density. Conversely, LZCS prepared under the same conditions exhibits an extremely high density. At both magnifications, only a few pores are present. In this study, the porosity of cold-pressed particles was estimated using Image J adjustment threshold plugin based on SEM images from various sample regions. Subtracting the average porosity of the SEM images from 100% provides the relative density. The relative density of cold-pressed particles made from various solid electrolytes was compared using SEM (Fig. 3b). Similar to Fig. 3a, the image in Fig. 3b depicts chloride particles as denser than sulfide particles [48, 50, 51]. The density of LZC is 85.174%, whereas the density of LSPSCl is 76.837%. Conversely, the density of LZCS particles manufactured under identical pressure conditions is 97.37%. Thus, halides exhibit superior compressibility compared to sulfide solid electrolytes, with halide sulfides offering even greater advantages in compressibility than halide solid electrolytes.
Figure 3
Figure 3.
(a) SEM images with low and high magnifications for the cold-pressed pellets of LZCS0.6, Li2ZrCl6, and LSPSC. All the pellets were fabricated under 500 MPa. The scale bars are 10 and 5 µm, respectively. (b) Relative densities for the three solid electrolytes in (a) all of which were estimated from SEM. Each error bar was determined from the standard deviation of the data from three samples.
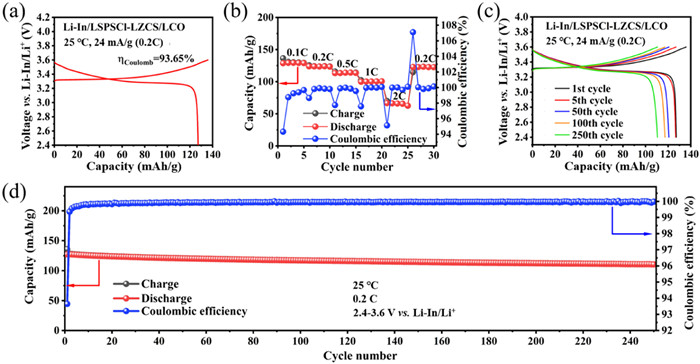
Based on the ESW determined above, LCO or single crystal NMC811 particles were utilized as the positive electrode active material without any additional particle coating. A double-layer solid electrolyte comprising LZCS and LSPSCl, with a Li-In alloy serving as the negative electrode, was employed; LSPSCl is employed to prevent the reaction between LZCS and the negative electrode of the battery. Fig. 4a illustrates the initial charging/discharging voltage curve of the Li-In/LPSCL-LZCS0.6/LCO battery. At a current density of 24 mA/g (0.2 C), within the voltage range of 2.4–3.6 V relative to Li-In/Li+ and under 100 MPa of applied pressure in an environment at 25 ℃; Its initial discharge capacity is 127.2 mAh/g (based on the mass of the positive electrode active material), with a Coulombic efficiency of 93.65%, which exceeds that of most all-solid-state batteries based on LCO reported in the literature. As depicted in Figs. 4c and d, when operating at 0.2 C, the Li In/LPSCL-LZCS0.6/LCO battery exhibited good cycling stability, with only a slight decrease in battery capacity observed in the first 20 cycles. After 250 cycles, it maintained a reversible capacity of 110.5 mAh/g, with a capacity retention rate of 87.16%. Additionally, Li-In/LPSCL-LZCS0.6/LCO batteries demonstrate good rate performance (Fig. 4b). As the specific current gradually increases from 12 mA/g (0.1 C) to 240 mA/g (2 C), the capacity decay diminishes with each rate change. In comparison to Li-In/LPSCL-LZC/LCO batteries (Fig. S7 in Supporting information), when LZCS0.6 is used as an electrolyte, it can release more capacity at different rates and reduce capacity degradation at higher rates. This result indicates that the battery performance will not excessively deteriorate when operated above 0.2 C. During the positive electrode pressing process, we utilize a pressure of 500 MPa. This high pressure facilitates improved contact between the positive electrode and electrolyte, minimizes interface resistance, and diminishes inter-particle gaps within the positive electrode, thereby enhancing performance. However, it is noteworthy that the operational pressure of solid-state batteries is significantly lower, typically at the final holding pressure. Furthermore, in response to your suggestion, we conducted experiments to fabricate solid-state batteries employing LCO as the positive electrode, subjecting the positive electrode to varying pressures (500, 300, 100 MPa). As depicted in Fig. S8 (Supporting information), we found that as the pressure decreases, the capacity released by the positive electrode slightly decreases, leading to a decrease in cycle performance.
Figure 4
Figure 4.
(a) Initial charge and discharge voltage profiles at 24 mA/g (0.2 C), with the Coulombic efficiency ηCoulomb denoted. (b) Rate capability at 0.1, 0.2, 0.5, 1, and 2 C. (c, d) Longterm cycling performance of the Li-In/LSPSCl-LZCS0.6/LCO battery at 24 mA/g. All the cycling tests were conducted between 2.4 V and 3.6 V vs. Li-In/Li+ at 25 ℃ and 100 MPa of applied external pressure.
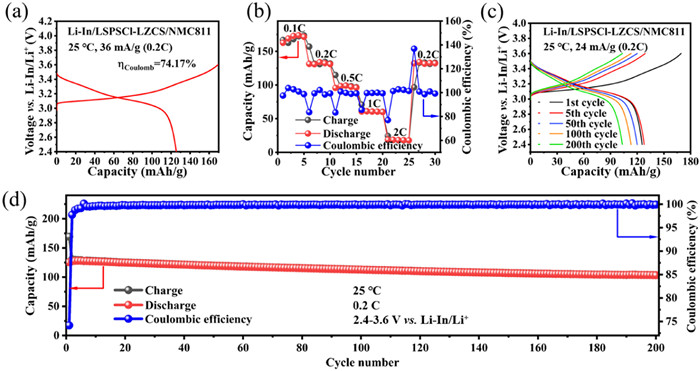
In addition to enhancing the performance of the LCO positive electrode, LZCS also improves the battery performance of NMC811. As depicted in Fig. 5a, during cycling at a current of 36 mA/g (0.2 C) within the voltage range of 2.4–3.6 V (relative to Li-In/Li+) at 25 ℃ under 100 MPa of applied pressure, the Li-In/LPSCL-LZCS0.6/NMC811 battery exhibits an initial discharge capacity of 125.5 mAh/g, with a Coulombic efficiency of 74.17%. Furthermore, as illustrated in Figs. 5c and d, the Li-In/LPSCL-LZCS0.6/NMC811 battery demonstrates robust cycling stability at 0.2 C, retaining a reversible capacity of 103.3 mAh/g after 200 cycles, with a capacity retention rate of 80.69%. Additionally, as depicted in Fig. 5b, the gradual increases in specific current from 18 mA/g (0.1 C) to 360 mA/g (2 C). In comparison to Li-In/LPSCL-LZC/NMC811 batteries (Fig. S9 in Supporting information), when LZCS0.6 is used as an electrolyte, it can release more capacity at different rates.
Figure 5
Figure 5.
(a) Initial charge and discharge voltage profiles at 36 mA/g (0.2 C), with the Coulombic efficiency ηCoulomb denoted. (b) Rate capability at 0.1, 0.2, 0.5, 1, and 2 C. (c, d) Longterm cycling performance of the Li-In/LSPSCl-LZCS0.6/NMC811 battery at 36 mA/g. All the cycling tests were conducted between 2.4 V and 3.6 V vs. Li-In/Li+at 25 ℃ and 100 MPa of applied external pressure.
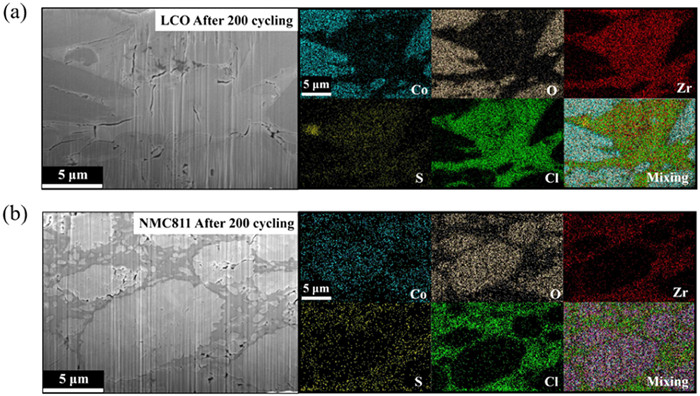
Take the positive electrode out of the Li-In/LPSCL-LZCS0.6/LCO battery, Li-In/LPSCL-LZCS0.6/NMC811, Li-In/LPSCL-LZC/LCO, and Li-In/LPSCL-LZC/NMC811 battery after cycling, then transfer them from the glove box to FIB-SEM via an argon gas transfer device. As depicted in Fig. 6, Figs. S10 and S11, through FIB processing of the battery, it can be observed that the LZCS0.6 electrolyte maintains contact with the positive electrode material, demonstrating its ability to accommodate volume changes during the charging and discharging process. In contrast, after 200 cycles, gaps appeared between LZC and the positive electrode material (Fig. S12 in Supporting information). This prevents the formation of gaps between the active material and electrolyte particles, which can lead to volume shrinkage and loss of contact [52-54]. Additionally, after 200 cycles, cracks appeared inside NMC811. Research has shown that after rolling, non-cyclic NMC811 particles would exhibit partial cracking and fragmentation. It also suggested that cycling and exposure to high voltage in batteries could cause cracks and fragmentation of NMC811 particles [55]. There are also studies indicating that using a series of advanced technologies such as multiscale spatial resolution diffraction and imaging to discover the widespread lattice rotation phenomenon in the NMC811 cathode, demonstrating its crucial role in the degradation of the cathode structure. These lattice rotations are not completely reversible and accumulate over long cycles, ultimately leading to the structural and mechanical degradation of the NMC cathode, as well as rapid capacity loss [56]. Therefore, we weighed 100 mg of the original NMC811 and compressed it into slices at 500 MPa before transferring it to FIB for characterization. As depicted in Fig. S13 (Supporting information), cracks are present inside the non-cycling NMC811 particles. In summary, the cracks and even breakage of NMC811 particles primarily result from intrinsic factors rather than reactions with electrolytes. Therefore, no obvious reaction interface was observed in the Li-In/LPSCL-LZCS0.6/NMC811 batteries, as shown in Fig. S14 (Supporting information), with the remaining energy dispersive spectrometer (EDS) signals of Ni and Mn.
Figure 6
Figure 6.
(a) SEM and EDS mapping images of LCO after 200 cycles of a full battery. Among them, we collected five elements: Co, O, Zr, S, and Cl. (b) SEM and EDS mapping images of NMC811 after 200 cycles of a full battery. Among them, we collected seven elements: Co, O, Zr, S, Cl, Ni, Mn. Ni and Mn are displayed by Fig. S14.
In summary, a novel Li+ superionic conductor has been developed through S doping of LZC, yielding LZCSx (x = 0.4, 0.5, 0.6, 0.7, 0.8). At 25 ℃, it exhibits a maximum conductivity of 1.9 × 10⁻³ S/cm. The results indicate that LZCS exhibits two crystal structures, P3m1 and C2/m, as a result of S addition. Simultaneously, S addition increases the crystal battery volume, expanding the channels for Li+ transport and consequently enhancing the electrolyte's ion conductivity. At a pressure of 500 MPa, its relative density of 97.369% surpasses that of the other two electrolytes (LSPSCl and LZC). The outstanding interface stability of the novel LZCS when combined with LCO or NCM811 electrodes was demonstrated through electrochemical, SEM, and TEM analyses. These findings hold great significance for the design of novel superionic conductors, thereby advancing the field of all-solid-state batteries.
Declaration of competing interest
The authors declare that they have no conflict of interest.
This work was financially supported by Natural Science Foundation of Hebei Province (Nos. B2020203037, F2021203097), Science Research Project of Hebei Education Department (No. JZX2024022), National Natural Science Foundation of China (Nos. 52022088, 51971245).
Supplementary materials
Supplementary material associated with this article can be found, in the online version, at doi:10.1016/j.cclet.2024.110272.
[1]
D.H.S. Tan, A. Banerjee, Z. Chen, et al., Nat. Nanotechnol. 15 (2020) 170–180. doi: 10.1038/s41565-020-0657-x
Figure 1
(a) Ball milling synthesis route for xLi2S-ZrCl4 SSE. (b) XRD patterns of the mechanochemically synthesized xLi2S-ZrCl4 with magnified regions of 30°−36°, 41°−46°. (c) EDS after compressing the raw material of xLi2S-ZrCl4 into blocks. Red represents Zr, Yellow represents S, Green represents Cl.
Figure 2
(a) Electrochemical property. (b) Arrhenius conductivity plots. The activation energy was measured under conditions of 30, 40, 50, 60, and 70 ℃. (c) Ionic conductivities at 25 ℃ and activation energies of xLi2S-ZrCl4. (d) LSV curves of the Li/LSPSCl-LZCS0.6/LZCS0.6 + C battery. Lithium as negative electrode of battery, LZCS0.6 + C as the positive electrode of battery.
Figure 3
(a) SEM images with low and high magnifications for the cold-pressed pellets of LZCS0.6, Li2ZrCl6, and LSPSC. All the pellets were fabricated under 500 MPa. The scale bars are 10 and 5 µm, respectively. (b) Relative densities for the three solid electrolytes in (a) all of which were estimated from SEM. Each error bar was determined from the standard deviation of the data from three samples.
Figure 4
(a) Initial charge and discharge voltage profiles at 24 mA/g (0.2 C), with the Coulombic efficiency ηCoulomb denoted. (b) Rate capability at 0.1, 0.2, 0.5, 1, and 2 C. (c, d) Longterm cycling performance of the Li-In/LSPSCl-LZCS0.6/LCO battery at 24 mA/g. All the cycling tests were conducted between 2.4 V and 3.6 V vs. Li-In/Li+ at 25 ℃ and 100 MPa of applied external pressure.
Figure 5
(a) Initial charge and discharge voltage profiles at 36 mA/g (0.2 C), with the Coulombic efficiency ηCoulomb denoted. (b) Rate capability at 0.1, 0.2, 0.5, 1, and 2 C. (c, d) Longterm cycling performance of the Li-In/LSPSCl-LZCS0.6/NMC811 battery at 36 mA/g. All the cycling tests were conducted between 2.4 V and 3.6 V vs. Li-In/Li+at 25 ℃ and 100 MPa of applied external pressure.
Figure 6
(a) SEM and EDS mapping images of LCO after 200 cycles of a full battery. Among them, we collected five elements: Co, O, Zr, S, and Cl. (b) SEM and EDS mapping images of NMC811 after 200 cycles of a full battery. Among them, we collected seven elements: Co, O, Zr, S, Cl, Ni, Mn. Ni and Mn are displayed by Fig. S14.

 DownLoad:

 下载:
下载:


