Scheme 1.
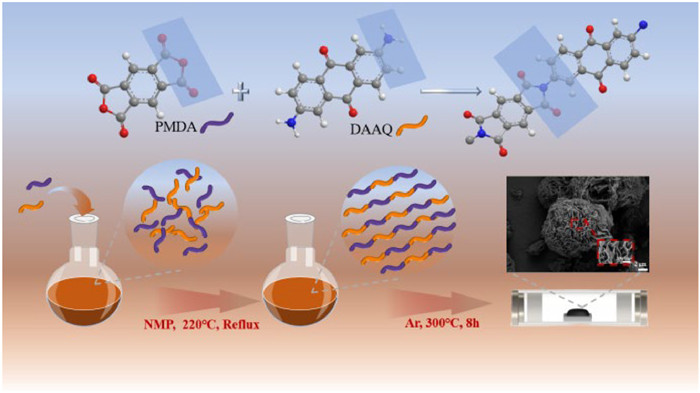
Scheme of the synthetic route of polymer.
Polycarbonyl conjugated porous polyimide as anode materials for high performance sodium-ion batteries
Liangju Zhao , Shiyu Qin , Fei Wu , Limin Zhu , Qing Han , Lingling Xie , Xuejing Qiu , Hongliang Wei , Lanhua Yi , Xiaoyu Cao

Since the beginning of the 21st century, new renewable clean energy sources are gradually replacing traditional fossil fuels to achieve efficient energy utilization and environmental protection, and to realize "carbon peak and carbon neutral" [1]. However, due to the inherent disadvantages of such renewable energy, such as random distribution of energy sources, low efficiency and unsustainable energy supply, the research and development of new energy storage devices has gained traction in the energy field [2-4]. At present, the development of more mature new energy storage devices includes battery energy storage, hydrogen storage, supercapacitor storage, and mechanical storage [5-7]. The accelerated exploitation of new energy resources and miniaturized electronic devices lead to need of large-scale storage, in the meantime, it motivated the development of rechargeable batteries and super-capacitors. Among the several hot research areas that are propitious to large-scale storage, electrochemical energy storages (EESs) technologies on account of rechargeable batteries shows remarkable promise attribute to fast-growing and breakthroughs in many fields. Because the fundamental purpose of researching EESs is to provide the ability to store MW h capacities that are suitable for renewable energy and other kinds of energy storages, rechargeable batteries possessing high round-trip efficiency, long cycling stability and ease of production attracted the most attention of all EESs Lithium-ion batteries (LIBs), as energy storage devices with exceptional performance, have been extensively studied and commercially implemented in recent years [8, 9]. However, the development of LIBs has been significantly hindered by the high cost due to the continuous depletion of non-renewable lithium resources, as well as the inevitable pollution problem during their usage [10-12]. In this context, sodium-ion batteries (SIBs) have been widely anticipated to become the next generation of widely utilized energy storage devices owing to their similar electrochemical properties to LIBs [13-16]. However, the slow reaction kinetics due to the size of the sodium ion and its effect on the electrode materials hinder their practical use, and their effect on the structure of the electrode materials during the sodium ion transfer process. Therefore, it is crucial to address these issues at this stage to promote the development of SIBs [10, 12, 17-19].
After extensive investigation, transition metal oxides [20, 21], Prussian blue analogues [22, 23], polyanionic compounds [24], and carbon-based organic materials [25, 26] have gained widespread recognition as electrode materials in the field of SIBs. The distinctive features of organic electrode materials (OEMs) lie in their eco-friendliness, cost effectiveness, lack of metallic components, flexibility, recyclability, and affordability [27, 28]. Most importantly, the high designability of organic molecules allows direct control of redox properties and provides numerous opportunities to enhance battery performance [29, 30]. The aforementioned advantages position OEMs as a prominent research focus in the realm of large-scale energy storage. Based on their molecular weight, OEMs can be divided into two categories: small organic molecules and macromolecular polymers [31, 32]. Unfortunately, small organic molecules often suffer from weaknesses such as low conductivity and dissolution in organic electrolytes, which affect the sodiation/desodiation processes and their electrochemical stability during charging/discharging cycles [33-35]. Compared to small molecule electrodes, polymers possess long molecular chains with high stability in electrolytes along with multiple functional groups that enable extended conjugated structures within the polymer segments, thereby increasing the reversible specific capacity and conductivity of the material [36-40]. Currently, a variety of predominant macromolecular polymers have been used in SIBs [41-44]. And among these polymers, conjugated mesoporous polyimides (CMPs) stand out due to their structurally specialized organic porous nature, which facilitates the extension of π-conjugation along the backbone and the widespread distribution of carbonyl groups on the main chain [45-47]. This unique spatial structure and arrangement of functional groups in CMPs confers controlled physical morphology, a customizable redox unit, limited solubility in conventional electrolytes, and rapid reaction kinetics [43, 45]. Consequently, SIBs incorporating CMPs demonstrate exceptional rate capabilities, extended cycle life, and high thermal stability. Furthermore, our objective is to optimize the integration of carbonyl groups into the polymer backbone chain through meticulous selection of monomers for polymerization [44, 47]. By ensuring long-term structural stability of electrode materials in conventional electrolytes while introducing additional active sites for sodium ion intercalation, we can significantly enhance the reversible specific capacity of active materials and achieve exceptionally long cycle life [45].
Herein, a polycarbonyl-conjugated porous polyimide (PPD) was synthesized via a facile one-step polycondensation method using pyromellitic dianhydride (PMDA) and 2, 6-diaminoanthraquinone (DAAQ) as reaction monomers. The incorporation of the conjugated structure into PPD enhances its insolubility, electronic conductivity, and spatial structural stability. Moreover, the porous structure significantly increases the contact area between sodium ions and the active sites, facilitating the sodiation/desodiation process and thereby improving its electrochemical performance. In line with our design expectations, PPD exhibits exceptional electrochemical properties when used as an electrode for SIBs.
For the preparation of PPD, equimolar (0.0025 mol) pyromellitic dianhydride (PMDA) and 2, 6-diaminoanthraquinone (DAAQ) were dissolved in N-methylpyrrolidone (NMP 30 mL) and the reaction was refluxed under an argon atmosphere for 6 h. The product was subjected to filtration followed by multiple washes with ethanol. It was then dried under vacuum at 120 ℃ for 12 h. After heat treatment in nitrogen at 300 ℃ for 8 h, the resulting product was ground to give a yellow powder with an average yield of 86.5% (Scheme 1).
The microstructure of the polymer was evaluated by SEM (ZEISS Sigma 300). The chemical structure of the polymer was determined by Fourier transform infrared spectroscopy (FT-IR; Beifen-ruili WQF-530) and solid-state nuclear magnetic resonance (13C NMR, Bruker Avance Neo 400WB) to further confirm the formation of characteristic chemical bonds within the PPD. Thermal stability was characterized by thermogravimetric analysis (TGA; Mettler Toledo TGA/DSC 3+) in a nitrogen atmosphere. The surface area and porous structure of the sample were investigated by N2/CO2 adsorption-desorption isothermal analysis using the Brunauer–Emmett–Teller (BET) method on a Micromeritics ASAP 2460 instrument. The surface elemental state of the PPD was evaluated by X-ray photoelectron spectroscopy (XPS, Thermo Scientific K-Alpha). The UV–vis spectra of the materials were measured using a Shimadzu UV-3600, and the density was checked using an AccuPyc Ⅱ 1340. GPC gel permeation chromatography was performed using Agilent PL-GPC50 & Agilent PL-GPC220. The PPD, Ketjen Black (KB), and polytetrafluoroethylene (PTFE) were combined with NMP in a 6:3:1 ratio to fabricate the working electrodes. These electrodes were then prepared by applying the slurry onto cuprum foil using a coating stick, followed by drying at 60 ℃ for 1 h in a vacuum oven. The coin cell batteries were assembled in an argon-filled glove box (H2O < 0.01 ppm; O2 < 0.01 ppm) using CR2032 type battery components. The electrolyte used for the SIBs consisted of a mixture of 1 mol/L NaClO4 in EC/DEC (1:1, v/v). LAND and NEWARE testers were used to evaluate their electrochemical performance and to perform galvanostatic intermittent titration (GITT). In addition, cycle voltammetry (CV) measurements were performed using the Princeton instrument (PARSTAT MC). The optimization of the materials was first performed using Gaussian 16 software [40] at the B3 LYP-D3(BJ)-6–31g* level, taking into account dispersion interactions. Subsequently, calculations were performed to determine the energy levels of the highest occupied molecular orbital (HOMO) and the lowest unoccupied molecular orbital (LUMO), as well as to analyze the density of states (DOS) and the electron density distribution.
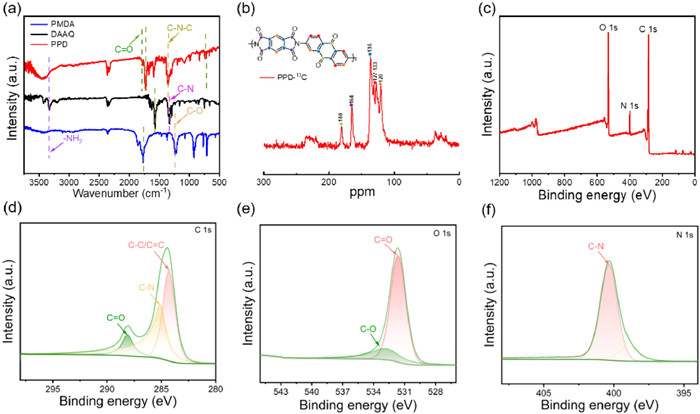
The synthesis of the polyimides was carried out by a previously reported one-step method as described in reference [48]. FT-IR spectral analysis was used to elucidate the chemical structure of the polymers. The monomer DAAQ exhibited a peak at 1571 cm−1 attributed to C═O stretching vibrations, a peak at 3332 cm−1 corresponding to —NH2 stretching vibrations, and a peak at 1332 cm−1 representing C—N stretching vibrations (Fig. 1a), and for the monomer PMDA, the peaks at 1770 and 1238 cm−1 belong to stretching vibrations of C═O and symmetric stretching vibrations of C—O bond, respectively. For homopolymerized polymers from DAAQ and PMDA, the successful polymerization reaction is indicated by the appearance of the characteristic peak at 1318 cm−1 corresponding to the stretching vibrations of the C—N—C bond. Meanwhile, no discernible absorption peaks associated with —NH2 groups were observed. Furthermore, the peaks at 1779 and 1725 cm−1 were individually assigned to the stretching vibrations of C═O bonds, while the bending vibration of C═O bonds was observed at 721 cm−1. Fig. S1 (Supporting information) shows that the polymer has no obvious diffraction peaks, which corresponds to an amorphous structure and is consistent with the characteristics of CMPs. Due to the insolubility of porous polymers in conventional solvents, 13C NMR spectroscopy was employed to investigate the molecular structure (Fig. 1b). The peak at 164.80 ppm corresponds to nitrogen-substituted carbonyl groups on the newly formed imide ring post-polymerization. The aromatic carbons exhibit signals at 136.23 ppm and 127.60−133.56 ppm, while the interstitial carbon on the benzene ring exhibits a peak at 120.34 ppm, and the carbonyl group carbons are identified by the signal at 180.76 ppm. Moreover, the elemental composition and molecular structure of the PPD were elucidated through XPS analysis. The overall survey spectra of PPD (Fig. 1c) confirmed the simultaneous presence of three main elements. The C 1s spectrum in Fig. 1d exhibited three prominent peaks at 288.18, 285.08, and 284.28 eV, contributing to C═O, C—N, and C—C/C═C bonds [36], respectively. Additionally, the individual XPS spectra of O 1s and N 1s (Figs. 1e and f) reveal a dominant peak at 531.68 and 400.38 eV, respectively, that is assigned to C═O and C—N bonds. These test findings collectively indicate the successful preparation of PPD through poly-condensation reaction.
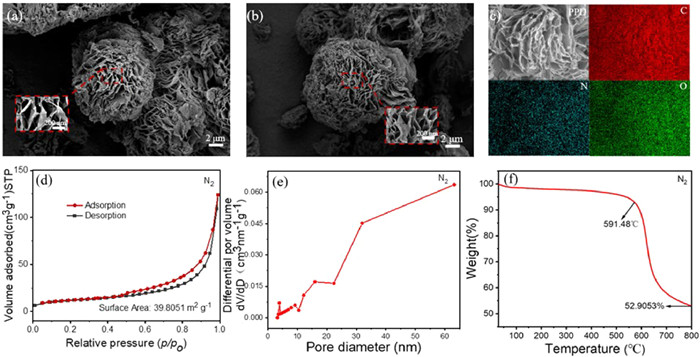
The microstructure of PPD was examined by SEM, revealing the presence of 3D perforated nanostructures composed of stacked 2D pleated nanosheets with varying sizes. These nanosheets exhibited an excellent nanosheet structure arrangement (Fig. S2 in Supporting information). In addition, the presence of interconnected nanoflower-like structures within the PPD were observed (Figs. 2a and b), which can significantly promote electron transport and facilitate faster reaction kinetics due to their interconnection structure and π-conjugated system, ultimately led to the improvement of the specific capacity and rate performance of the batteries. The EDS mapping revealed a homogeneous distribution of C, N, and O elements in the pristine PPD sample (Fig. 2c). The polymers were analyzed by measuring N2 adsorption/desorption isotherms. As depicted in Fig. 2d, the curve indicated the presence of a mesoporous structure. The specific surface area of PPD was determined to be 39.8051 m2/g through calculation. The average pore size of the material, as analyzed by the pore size distribution graph (Fig. 2e), was found to be 19.2821 nm, providing further confirmation of the mesoporous structure exhibited by PPD. Meanwhile, CO2 adsorption-desorption analysis revealed a surface area of 91.0828 m2/g with a pore size of 3.0132 nm (Fig. S3 in Supporting information), indicating the presence of a microporous structure in the material structure [36]. The thermal stability of polymers was examined using TGA under a N2 atmosphere (Fig. 2f). The TGA curve revealed that the evaporation of adsorbed water and small organic molecules within the meso/microporous structure commenced below 200 ℃. Subsequently, the unstable polypyrene oligomer began to evaporate below 591.48 ℃. Ultimately, the decomposition of PPD polymer occurred at higher temperatures, confirming its exceptional thermal stability which ensures both electrode materials and the battery system safety.
The electrochemical characteristics and mechanism of sodium-ion storage in PPD electrodes were examined by constructing 2032 coin-type half-cells, with Na metal utilized as the opposing electrode. The CV curves for the initial five cycles, ranging of 0.01–3.0 V (vs. Na+/Na), as presented in Fig. 3a, indicate that within the first reduction process, two distinct reduction peaks near 0.40 and 1.44 V correspond to the sodiation of C═O bonds and the production of solid electrolyte films (SEI) [49]. The weak oxidation peaks observed within the range of 1.64−2.40 V correspond to the removal of sodium-ion during oxidation, while in the subsequent scans, the reduction peaks were mainly located between 0.61−1.70 V corresponding to the insertion of sodium-ion during reduction. The CV curves maintained quasi-reversible and stable characteristics, indicating the exceptional electrochemical stability of the PPD electrodes. Furthermore, CV tests were also carried out for PPD electrodes with varying numbers of cycle (Fig. S4a in Supporting information). As the number of cycles increased, the repetition rate of the CV curve became higher, which also illustrated the structural stability of the PPD electrode. Fig. 3b exhibited typical galvanostatic discharge/charge (GDC) curves of the PPD electrode at 0.1 A/g. The PPD electrode exhibited an initial discharge/charge capacity 1704.0/538.9 mAh/g, accompanied by the formation of the SEI layer and some side effects, resulting in a low initial CE of 31.63%. The second discharge/charge capacities of the PPD electrode were 609.5/486.0 mAh/g with a CE of 79.74%. Moreover, the subsequent GDC curves displayed increasing reproducibility and demonstrated excellent agreement with the CV test. In parallel, as depicted in Fig. S4b (Supporting information), the GDC curves of the PPD electrode exhibit clear discharging and charging plateaus at various current densities, which also adjuvanted the test results of the CV curves.
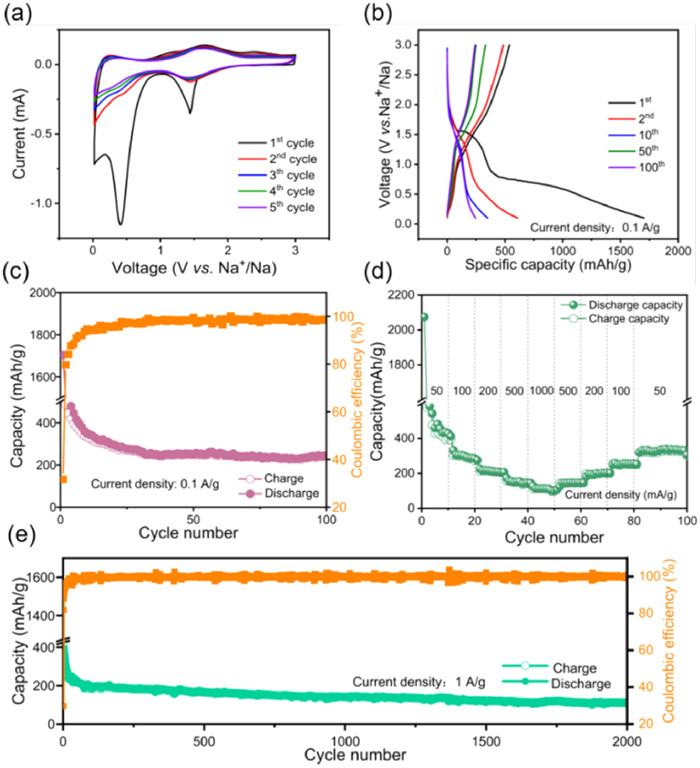
The cycling performance of the PPD electrode following 100 cycles at a current density of 0.1 A/g is illustrated in Fig. 3c. Initially, the PPD electrode exhibited a notably high discharge/charge capacity of 1704.0/538.9 mAh/g, coupled with a modest initial CE of 31.63%, primarily attributed to the formation of the SEI layer and certain ancillary side reactions. After electrochemical activation, the capacity gradually declined, eventually stabilizing to a consistent cycle state characterized by discharge/charge capacities of 264.6/258.1 mAh/g and an enhanced CE of 97.53%. Even after completing 100 cycles, the PPD electrode retained a reversible discharge-specific capacity of 244.6 mAh/g with a CE of 98.48%. Furthermore, the rate performance was assessed (Fig. 3d), revealing that the PPD electrode delivered specific capacities of 412.9, 300.7, 217.0, 148.8, 112.2, 146.6, 201.5, 251.5 and 334.5 mAh/g at current densities of 50, 100, 200, 500, 1000, 500, 200, 100, and 50 mA/g, respectively. Notably, upon reverting the current density to its initial setting, a prompt recuperation of the corresponding specific discharge capacity was observed, underscoring the electrode's exceptional reversibility even after reversion to the original current density, thus affirming its robust cycling performance.
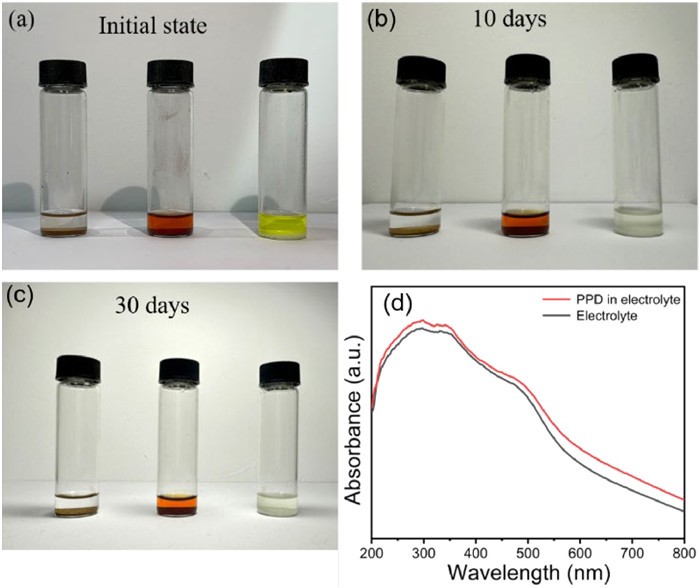
The extended cycling behavior of PPD was investigated as illustrated in Fig. 3e. During the initial discharge/charge cycle, the PPD electrode exhibited a discharge specific capacity of 1546.9 mAh/g, attributed to the formation of the SEI layer, while the subsequent charging resulted in a charge specific capacity of 461.2 mAh/g with an efficiency of 29.81%. The capacity displayed an initial decrease over the first 70 cycles, probably due to SEI evolution and partially irreversible reactions, followed by a gradual increase in subsequent cycles due to improved active site utilization. Notably, after undergoing 2000 cycles at a constant current density of 1 A/g, the PPD electrode delivered a specific capacity of 100.7 mAh/g with the CE approaching close to perfection (100%). This exceptional cycling performance at high current density conditions further underscores the outstanding structural stability possessed by the PPD electrode. Meanwhile, in the ultra-long cycle evaluation at 2 A/g, even after 10, 000 cycles the discharge/charge specific capacity remained at 39.22/39.17 mAh/g with a CE of 99.86% (Fig. S5 in Supporting information), thereby emphasizing the exceptional structural robustness of the PPD electrode. Moreover, the remarkable environmental stability of PPD is demonstrated by its long-term dissolution in the electrolyte and the results obtained from UV testing, which indicate minimal solubility in the electrolyte. The results depicted in Fig. 4 demonstrate that while monomers exhibited initial solubility upon prolonged exposure to the electrolyte, polymers showed no significant solubility even after a standing period of up to 30 days (Figs. 4a–c). To further evaluate the insolubility of PPD in the electrolyte, a UV–vis spectrum analysis was conducted (Fig. 4d), which revealed a smooth curve devoid of any noticeable new absorption peaks. This observation suggests that PPD exhibits a spectral profile similar to that of the electrolyte, thereby providing supplementary evidence for its extremely low solubility [50].
To evaluate the Na+ transport behavior and intrinsic dynamics, the CV curves were further examined at scan rates ranging from 0.1 mV/s to 1.2 mV/s. As illustrated in Fig. 5a, with increasing scan rate, all CV curves exhibited a remarkable similarity, with a slight shift of the reduction and oxidation peaks, demonstrating the exceptional electrochemical stability of the PPD electrode. Also, due to polarization effects, both anodic and cathodic peak currents showed a shift and gradually increased with scan rate. Furthermore, as shown in Fig. S6a (Supporting information), the CV curves maintain a consistent shape and stability even after multiple scanning sweeps, confirming the outstanding reversible electrochemical stability of the PPD electrode. The following equation was applied to determine the controlled response process for the capacitive behavior.
|
|
(1) |
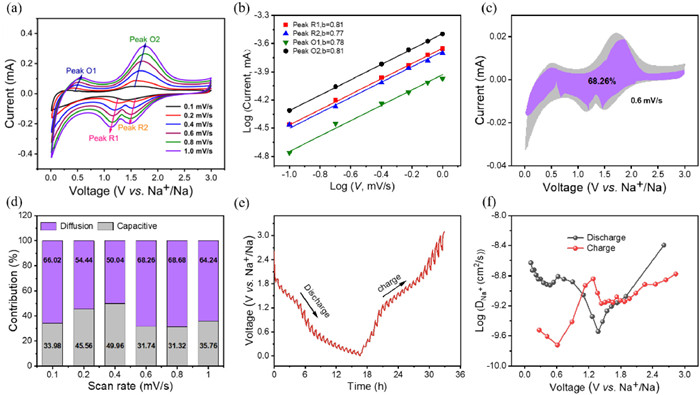
The adjustable constants, a and b, are subject to modification, with the value of b ranging from 0.5 to 1.0. As exhibited in Fig. 5b, the adjustable b-values of 0.81 (peak R1), 0.77 (peak R2), 0.78 (peak O1), and 0.81 (peak O2), respectively, are close to 1.0, indicating the storage performance of sodium is predominantly influenced by a synergistic interplay between the capacitive and diffusion-controlled process. The capacity contribution of Na+ storage can be determined by utilizing the following equation:
|
|
(2) |
|
|
(3) |
which k1v and k2v1/2 stand for the contributions from capacitive and diffusion-controlled processes, respectively. As depicted in Fig. 5b, the capacitive contribution (represented by the grey area) of the PPD electrode at a scan rate of 1.0 mV/s is approximately 68.26%. When the scan rate increased from 0.1 mV/s to 1.0 mV/s, the corresponding capacitive contributions are observed to be 33.98%, 45.56%, 49.96%, 31.74%, 31.32% and 35.76% (Fig. 5c), respectively. The high scan rates demonstrate remarkable rate performance of the electrochemical processes, mainly due to their prominent pseudocapacitive behavior.
The GITT test aims to further examine the dynamics of Na+ diffusion and the calculation of the Na+ diffusion coefficient is based on the equation provided below:
|
|
(4) |
where τ represents the relaxation time (20 min); mB denotes the relative molecular mass of the PPD electrode; S refers to the area of the electrode sheet; ρm is the compacted density of the material; ΔEs and ΔEt are the equilibrium potential and potential change values, respectively (Fig. 5). The results exhibited in Fig. 5f demonstrated that during the eighth charge/discharge cycle, DNa exhibited a consistently high and stable value of approximately 10−9–10−8 cm2/s, indicating the rapid reaction kinetics of the PPD electrode.
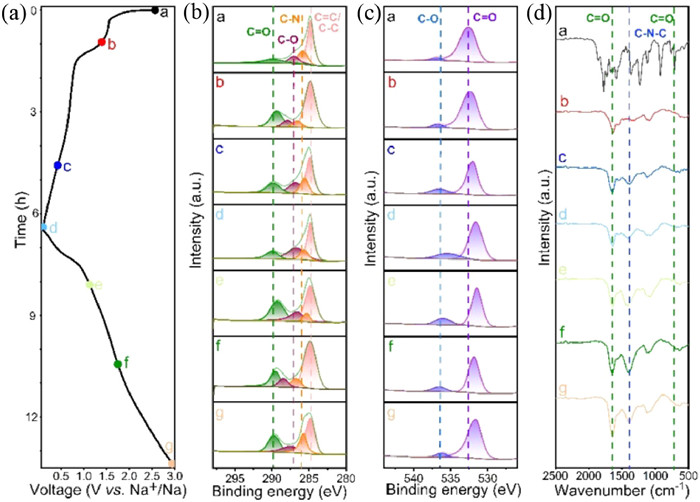
To deepen the understanding of sodium ion storage and chemical structure changes in the PPD electrode, ex-situ XPS characterization was conducted on the electrode in various charge/discharge states (Figs. 6a–c). The ex-situ C 1s spectra displayed four distinct peaks representing different chemical bonds, namely C═O, C—O, C—N, and C═C/C—C bonds. During the discharge process, the C═O peak intensity gradually decreased, while the C—O peak intensity increased, suggesting a reduction reaction of the carbonyl group within the imide. This resulted in the conversion of the C═O double bond to a C—O—Na single bond. Upon subsequent charging, the C—O peak intensity decreased, and the C═O peak intensity returned to its initial level at a charge up to 3 V, indicating the significance of the C═O group as the primary active center for Na+ storage. Minimal fluctuations were observed in the proportions of peak areas associated with C—N, C═C, and C—C bonds, suggesting that reversible redox reactions mainly involve the π-conjugated carbonyl group within the imide structure of the PPD electrode throughout the charging and discharging processes. In addition, the O 1s spectra could be deconvoluted into two distinct peaks corresponding to C—O and C═O bonds. The results demonstrate a reduction in the C═O peak intensity and an increase C—O peak during discharging, with the opposite trend during charging, confirming the reversible interaction between Na+ and carbonyl groups. These results suggest that redox reactions involve the carbonyl group in the imide structure of the PPD electrode [36, 49]. Ex-situ FT-IR spectroscopy was also used to further explain the storage mechanism of sodium ions within the electrode material structure. As depicted in Fig. 6d, a decrease in the characteristic peak at 1641 cm−1 associated with the carbonyl group was observed, which could be restored upon full charging, indicating a reversible redox reaction involving the C—O group and sodium ions. These findings align with those obtained from the XPS analysis.
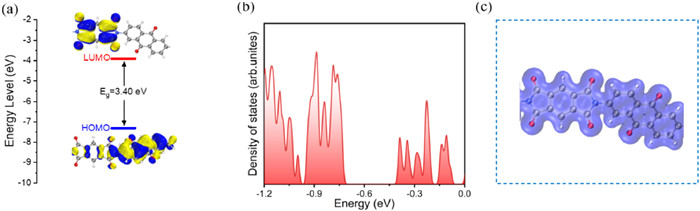
We utilized density functional theory (DFT) for the examination of the structural characteristics of the PPD electrode, aiming to explore its electrochemical reaction mechanism. The HOMO/LUMO energy levels of the PPD electrode are depicted in Fig. 7a. A narrower HOMO-LUMO energy gap (3.40 eV) signifies increased electronic conductivity [51, 52], while the diminished energy gaps observed for the PPD electrode suggest enhancing electronic conductivity and accelerating redox kinetics [38]. The density of states (DOS) was assessed through DFT calculations (Fig. 7b), revealing a pronounced electronic conductivity for the PPD electrode. The electron density distributions of the PPD electrode indicated that it had a relatively extensive range of reactive areas (Fig. 7c). SEM characterization was employed to investigate morphological changes in the polymer electrode. SEM images captured alterations on the electrode surface after cycling (Fig. S7 in Supporting information), demonstrating that from its initial state up until the 20th cycle, structural integrity was maintained with pore-like features resembling those observed in pristine material at each cycle lap; this signifies excellent morphological and chemical stability of the polymer electrode post-cycling. Additionally, the elemental mapping images illustrated a uniform distribution of Na+ within the material and a consistent relative content of Na+ across different numbers of laps after cycling, indicating reversibility in redox processes [53, 54].
The present study involves the synthesis of a novel conjugated microporous/mesoporous polyimide through a conventional solvothermal polycondensation reaction, and the PPD electrode exhibited excellent electrochemical properties in SIB. It delivered a stable capacity of 244.6 mAh/g after undergoing 100 cycles at 100 mA/g, and provided a reversible capacity of 100.7 mAh/g enduring 2000 cycles at a higher current density of 1.0 A/g. It showcased exceptional rate capability with an impressive discharge capacity, while also exhibiting remarkable long-term cycling stability with a discharge capacity retention of 39.2 mAh/g over the course of an extensive cycle life spanning up to 10, 000 cycles at a current density of 2.0 A/g. The DFT calculations demonstrate that PPD exhibits a high ion diffusion coefficient and a low energy gap, indicating its excellent reaction kinetics as an electrode material. The Na+ storage mechanism of the PPD electrode is elucidated through ex-situ XPS and ex-situ FT-IR analyses, revealing the involvements of carbonyl groups on the imide ring in redox reactions. Introducing more carbonyl groups into the structure of organic materials with extended π-conjugation provides a more effective approach for designing new oxide-reduced organic electrode materials.
The authors declare that they have no known competing financial interests or personal relationships that could have appeared to influence the work reported in this paper.
Liangju Zhao: Writing – original draft, Investigation, Data curation. Shiyu Qin: Formal analysis. Fei Wu: Formal analysis. Limin Zhu: Writing – review & editing, Funding acquisition, Formal analysis. Qing Han: Investigation. Lingling Xie: Investigation. Xuejing Qiu: Formal analysis. Hongliang Wei: Resources. Lanhua Yi: Funding acquisition, Formal analysis. Xiaoyu Cao: Writing – review & editing, Project administration, Investigation, Funding acquisition, Conceptualization.
This work was supported by National Natural Science Foundation, China (Nos. 52071132, U21A20284 and 52261135632), Natural Science Foundation of Henan, China (Nos. 232300421080, 242300421035), Program for Innovative Team (in Science and Technology) in University of Henan Province, China (No. 24IRTSTHN006), Key Scientific Research Programs in Universities of Henan Province, China–Special Projects for Basic Research (No. 23ZX008), and the Natural Science Foundation of Hunan Province, China (No. 2023JJ50287).
Supplementary material associated with this article can be found, in the online version, at doi:
N. Lior, Energy 33 (2008) 842–857.
N. Yabuuchi, K. Kubota, M. Dahbi, et al., Chem. Rev. 114 (2014) 11636–11682. doi: 10.1021/cr500192f
X. Yin, S. Sarkar, S. Shi, et al., Adv. Funct. Mater. 30 (2020) 1908445.
Q. Zhao, Y. Lu, J. Chen, Adv. Energy Mater. 7 (2016) 1601792.
M.D. Slater, D. Kim, E. Lee, et al., Adv. Funct. Mater. 23 (2012) 947–958.
H.D. Yoo, E. Markevich, G. Salitra, et al., Mater. Today 17 (2014) 110–121.
Q. Zhao, A.K. Whittaker, X.S. Zhao, Materials 11 (2018) 2567. doi: 10.3390/ma11122567
K.M. Abraham, ACS Energy Lett. 5 (2020) 3544–3547. doi: 10.1021/acsenergylett.0c02181
S.W. Kim, D.H. Seo, X. Ma, et al., Adv. Energy Mater. 2 (2012) 710–721. doi: 10.1002/aenm.201200026
C. Delmas, Adv. Energy Mater. 8 (2018) 1703137.
X. Guo, Z. Wang, Z. Deng, et al., Chem. Mater. 31 (2019) 5933–5942. doi: 10.1021/acs.chemmater.9b02269
J.Y. Hwang, S.T. Myung, Y.K. Sun, Chem. Soc. Rev. 46 (2017) 3529–3614.
T. Kim, W. Song, D.Y. Son, et al., J. Mater. Chem. A 7 (2019) 2942–2964. doi: 10.1039/c8ta10513h
M. Li, J. Lu, Z. Chen, et al., Adv. Mater. 30 (2018) 1800561.
G. Zubi, R. Dufo-López, M. Carvalho, et al., Renew. Sustain. Energy Rev. 89 (2018) 292–308.
M. Sawicki, L.L. Shaw, RSC Adv. 5 (2015) 53129–53154.
A. Eftekhari, D.W. Kim, J. Power Sources 395 (2018) 336–348.
L. Li, Y. Zheng, S. Zhang, et al., Energy Environ. Sci. 11 (2018) 2310–2340. doi: 10.1039/c8ee01023d
R. Rajagopalan, Y. Tang, C. Jia, X. Ji, H. Wang, Energy Environ. Sci. 13 (2020) 1568–1592. doi: 10.1039/c9ee03637g
S. Boyd, V. Augustyn, Inorg. Chem. Front. 5 (2018) 999–1015. doi: 10.1039/c8qi00148k
C. Yuan, H.B. Wu, Y. Xie, et al., Angew. Chem. Int. Ed. 53 (2014) 1488–1504. doi: 10.1002/anie.201303971
J. Peng, W. Zhang, Q. Liu, J. Wang, S. Chou, et al., Adv. Mater. 34 (2022) 2108384.
M.B. Zakaria, T. Chikyow, Coord. Chem. Rev. 352 (2017) 328–345.
L. Xiao, F. Ji, J. Zhang, et al., Small 19 (2022) 2205732.
H. Hou, X. Qiu, W. Wei, et al., Adv. Energy Mater. 7 (2017) 1602898.
M.M. Sabzehmeidani., S. Mahnaee, M. Ghaedi, H. Heidari, et al., Mater. Adv. 2 (2021) 598–627. doi: 10.1039/d0ma00087f
T.B. Schon, B.T. McAllister, F. Li, D.S. Seferos, Chem. Soc. Rev. 45 (2016) 6345–6404.
J.J. Shea, C. Luo, ACS Appl. Mater. Interfaces 12 (2020) 5361–5380. doi: 10.1021/acsami.9b20384
M. Liu, H. Ao, Y. Jin, et al., Mater. Today Energy 17 (2020) 100432.
Y. Park, D.S. Shin, S.H. Woo, K.H. Shin, K.T. Lee, Adv. Mater. 24 (2012) 3562–3567. doi: 10.1002/adma.201201205
S. Qiao, Q. Zhou, M. Ma, H.K. Liu, et al., ACS Nano 17 (2023) 11220–11252. doi: 10.1021/acsnano.3c02892
X. Xiang, K. Zhang, J. Chen, Adv. Mater. 27 (2015) 5343–5364. doi: 10.1002/adma.201501527
D. Bin, F. Wang, A.G. Tamirat, et al., Adv. Energy Mater. 8 (2018) 1703008.
Z. Dai, U. Mani, H.T. Tan, and Q. Yan, Small Methods 1 (2017) 1700098.
W. Deng, X. Liang, X. Wu, J. Qian, Y. Cao, Sci. Rep. 3 (2013) 2671.
L. Chen, Y. Li, X. Wang, et al., Chem. Engin. J. 464 (2023) 142658.
Q. Fang, Z. Zhuang, S. Gu, Nat. Commun. 5 (2014) 4503.
K. Li, Y. Wang, B. Gao, X. Lv, Z. Si, J. Colloid Interface Sci. 601 (2021) 446–453.
Y. Pang, H. Li, S. Zhang, et al., J. Mater. Chem. A 10 (2022) 1514–1521. doi: 10.1039/d1ta06384g
L. Zhang, R. Wang, Z. Liu, et al., Adv. Mater. 35 (2023) 2210082.
P. Barpanda, L. Lander, S. Nishimura, A. Yamada, Adv. Energy Mater. 8 (2018) 1703055.
Y. Chen, H. Dai, K. Fan, et al., Angew. Chem. Int. Ed. 62 (2023) 2302539.
J. Kim, J.H. Kim, K. Ariga, Joule 1 (2017) 739–768.
A.L. Lubis, F. Baskoro, T.H. Lin, et al., ACS Appl. Mater. Interfaces 3 (2023) 10722.
H. Li, J. Wu, H. Li, et al., Chem. Eng. J. 430 (2022) 132704.
K. Koshika, N. Sano, K. Oyaizu, Chem. Commun. 7 (2009) 836–838.
R. Jing, J. Yang, X. Zhao, et al., J. Colloid Interface Sci. 658 (2024) 678–687.
M. Mohammadiroudbari, J. Huang, E.Y. Kim, et al., J. Mater. Chem. A 11 (2023) 16636–16647. doi: 10.1039/d3ta02445h
Y. Yao, M. Pei, C. Su, et al., Small 10 (2024) 2401481.
Y. Ma, C. Hu, H. Guo, L. Fan, S. Yang, Polymer 148 (2018) 356–369. doi: 10.1364/josab.35.000356
Z. Song, H. Zhan, Y. Zhou, Angew. Chem. Int. Ed. 49 (2010) 8444–8448. doi: 10.1002/anie.201002439
K. Li, Q. Li, Y. Wang, Y. Li, Z. Si, Mater. Chem. Front. 4 (2020) 2697–2703. doi: 10.1039/d0qm00335b
Q. Peng, Y. Sun, L. Wang, et al., Small 20 (2018) 2308953.
Q. Peng, Y. Wang, S. Qi, et al., Rare Met. 43 (2024) 622. doi: 10.1109/icws62655.2024.00082

Figure 1 (a) FT-IR (KBr pellets) spectra of PMDA, DAAQ, PPD. (b) Solid-state 13C NMR of PPD. (c) XPS spectrum of PPD. (d) C 1s spectrum of PPD. (e) O 1s spectrum of PPD. (f) N 1s spectrum of PPD.

Figure 2 (a–c) SEM images and elemental mapping images of PPD. (d) N2 adsorption-desorption isotherms, (e) pore-size distribution plots, (f) TGA curves of PPD.

Figure 3 Electrochemical properties of PPD electrodes for SIBs: (a) The first 5 CV curves of PPD at 0.1 mV/s. (b) Charge/discharge profiles of 1st, 2nd, 10th, 50th, and 100th cycles at 0.1 A/g of PPD. (c) Cycling performance of PPD. (d) Rate capabilities of PPD. (e) Long-term cycling performance of PPD at 1.0 A/g after 2000 cycles.

Figure 4 Digital photos of PPD dispersed in the electrolyte of SIBs for different days: (a) Pristine, (b) 10 days, (c) 30 days. (d) The comparison of UV–vis spectra of PPD in electrolyte with that of pure electrolyte (1 mol/L NaClO4 in EC/DEC (1:1, v/v)).

Figure 5 Kinetics analysis of PPD electrode: (a) CV curves at different sweep rate (0.1–1.0 mV/s). (b) Line relationship of log(i, peak current)-log(v, scan rate) for peak R1, R2, O1, and O2. (c) Percentage of pseudocapacitance contribution at different scan rates (0.1–1.0 mV/s) of PPD electrode. (d) The pseudocapacitance contribution for PPD electro de of the CV curve at the sweep rate of 0.6 mV/s. (e) GITT curves of PPD electrodes after 8th cycles at 0.1 A/g. (f) The Na+ diffusion coefficient (DNa+) during discharging-charging process.

Figure 6 (a) Discharge-charge profile of PPD electrode at 0.1 A/g in the voltage range of 0.01–3.0 V (vs. Na+/Na) in the first cycle. (b, c) Ex-situ C 1s XPS spectra and ex-situ O 1s XPS spectra. (d) Ex-situ FT-IR spectra under different electrochemical states of PPD.

 扫一扫看文章

扫一扫关注我们
 DownLoad:

 下载:
下载:
