Received Date:
25 January 2024 Accepted Date:
11 June 2024 Revised Date:
08 May 2024 Available Online:
15 March 2025
Abstract:
In contrast to research on active sites in nanomaterials, lithium tantalate single crystals, known for their exceptional optical properties and long-range ordered lattice structure, present a promising avenue for in-depth exploration of photocatalytic reaction systems with fewer constraints imposed by surface chemistry. Typically, the isotropy of a specific facet provides a perfect support for studying heteroatom doping. Herein, this work delves into the intrinsic catalytic sites for photocatalytic nitrogen fixation in iron-doped lithium tantalate single crystals. The presence of iron not only modifies the electronic structure of lithium tantalate, improving its light absorption capacity, but also functions as an active site for the nitrogen adsorption and activation. The photocatalytic ammonia production rate of the iron-doped lithium tantalate in pure water is maximum 26.95 µg cm−2 h−1, which is three times higher than that of undoped lithium tantalate. The combination of first-principles simulations with in situ characterizations confirms that iron doping promotes the rate-determining step and changes the pathway of hydrogenation to associative alternating. This study provides a new perspective on in-depth investigation of intrinsic catalytic active sites in photocatalysis and other catalytic processes.
Ammonia serves as a crucial industrial raw material, playing an indispensable role in both modern agriculture and industry [1-4]. In the conventional Haber-Bosch industrial ammonia synthesis process, high energy input is typically employed to achieve the direct dissociation of ultra-stable N≡N bonds [5-8]. The significant energy consumption and high pollution associated with this process have prompted the search for a clean and efficient method of synthesizing ammonia under mild conditions [6,9]. Green photocatalytic nitrogen reduction is an attractive strategy as an alternative to traditional ammonia synthesis. This reaction system operates without the need for stringent temperature, pressure, and hydrogen input conditions [10-12]. Instead, it utilizes abundant natural solar energy and available water to directly convert nitrogen to ammonia at room temperature and atmospheric pressure. Fundamentally, photocatalytic nitrogen fixation avoids the high-energy pathway of directly breaking the N≡N bonds, reducing the energy required for the reaction. However, the activation of nitrogen and the subsequent hydrogenation processes remain challenging. Therefore, the crucial challenge in achieving effective photocatalytic nitrogen fixation lies in acquiring a profound understanding and optimizing the intrinsic activity of photocatalytic nitrogen reduction sites and specific nitrogen reduction pathways (associative distal or associative alternating).
The photocatalytic behavior is primarily influenced by the band structure and local electronic structure of the photocatalysts. Heteroatom doping has been extensively employed in promoting light adsorption and controlling catalytic sites for nitrogen reduction in photocatalysts, proving to be a straightforward and effective method. For example, Xiong et al. [13] doped Mo in W10O49, the introduction of Mo active sites activated N2 molecules and promoted the electrons transfer to the adsorbed N2, which achieved a 7 times higher ammonia production rate than that of the pristine W10O49 under visible light. It was worth noting that Fe was a low-cost and widely used transition metal, and it exhibited distinctive properties in promoting nitrogen adsorption and activation for nitrogen reduction [14-16]. Wu et al. [17] found that the local electronic structure could be modulated by the doped iron atoms in TiO2, and then lowering energy battier of the nitrogen reduction rate limiting step. In addition, the Fe doping could also enhance the reduction ability of photogenerated electrons by reducing the work function and increasing the defect band (D-band) center. Typically, all these catalytic models encompass heteroatom-doped nanomaterials. However, the influence of surface chemistry, including specific area, coordination bonds, and defect density, significantly hinders the in-depth investigation of the intrinsic active sites in the material and the corresponding reaction pathways on these sites. Unlike traditional nanomaterials, bulk crystals possess macroscopically controllable specific crystal facets, facilitating a more fundamental exploration of the physicochemical properties. Lithium tantalate (LT) is an important multifunctional single crystal material with a wide range of applications in optics, communications and other fields [18,19]. It has been reported that compared with polycrystalline materials, single-crystal materials with fewer grain boundaries, a long-range ordered lattice structure possess favorable stability and clearer electron transport paths, thus the transfer efficiency of photogenerated electrons was facilitated [20-24]. The excellent crystallinity of single crystal photocatalyst could also reduce the recombination of photogenerated holes and electrons [25]. Furthermore, compared to nanoparticles, the single crystal surface was smooth and single crystal plane, avoiding the influences of other factors such as different crystal planes and different amounts of surface active sites, which was more conductive to study the role of active sites caused by doping elements. Hence, heteroatom-doped LT single crystals provide an excellent platform for a comprehensive investigation into the intrinsic sites of doped materials and the effect of local electrical structure on photocatalytic nitrogen fixation pathways. This is a realm that has yet to be explored in previous studies on heteroatom-doped materials for nitrogen reduction reaction. Especially for the Fe-doped lithium tantalate single crystal, the apparent yellow color determines that it has good absorption under visible region, which is more suitable for photocatalytic reactions.
Herein, we reported a novel single-crystal photocatalyst of Fe-doped lithium tantalate (Fe-LT) wafers for the nitrogen reduction reaction. The presence of iron dopants improved the intrinsic band structure and, acting as the active sites, effectively promoted the nitrogen adsorption and activation. Based on theoretical calculations combined with in-situ characterizations, we found iron doping could adjust the local electron density of LT, lowering the energy barrier of the rate-limiting step and thereby steering hydrogenation along a favorable pathway. Experimental results demonstrated that, without any sacrificial agents, Fe-LT achieved highly selective ammonia synthesis from nitrogen in pure water. This work highlights the role of dopants in optimized catalysts, as well as provides a promising avenue for investigating the intrinsic catalytic sites and reaction mechanisms.
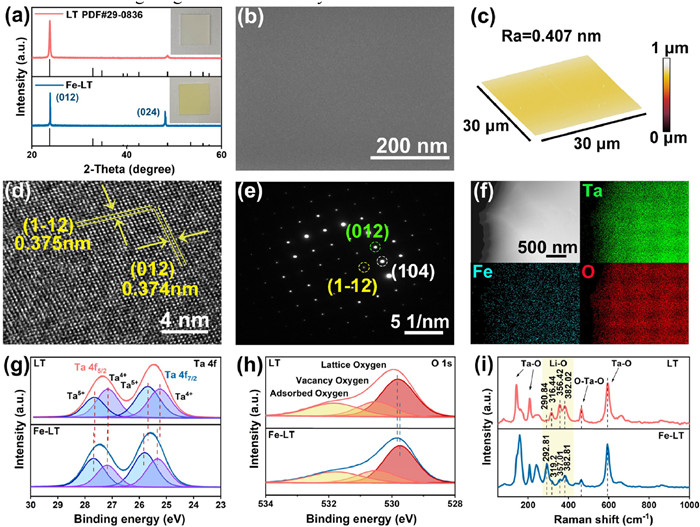
X-ray diffraction pattern was first performed to investigate the crystal structures of Fe-LT and LT. As shown in the Fig. 1a, only two sharp diffraction peaks at 23.72° and 48.62° were detected for both Fe-LT and LT, corresponding to the (012) and (024) parallel crystal planes of lithium tantalate (JCPDS No. 29-0836), which indicated their excellent crystallinity and single crystal characteristic. While the color of lithium tantalate changed from white to light yellow after iron doping, which confirmed the introduction of Fe doping.
Figure 1
Figure 1.
(a) XRD diffraction patterns of Fe-LT and LT. (b) The SEM image of Fe-LT. (c) Three-dimensional image of Fe-LT surface measured by atomic force microscopy (AFM). (d) Lattice structure of Fe-LT determined by high resolution transmission electron microscopy (HRTEM). (e) Selected area electron diffraction (SAED) pattern of Fe-LT single crystal and corresponding (f) EDS profiles of Fe-LT. The high-resolution XPS spectra of (g) Ta 4f and (h) O 1s, and (i) Raman spectrum for Fe-LT and LT.
The surface morphologies of LT and Fe-LT were further examined using atomic force microscopy (AFM) and scanning electron microscopy (SEM). As shown in Fig. 1b and Fig. S1 (Supporting information), the smooth and flat structure morphology for LT and Fe-LT were revealed, and no dents and folds were observed. It was worth noting that the smooth crystal surface could exclude the influences of specific surface area and surface roughness on the catalytic performance, thus it was more suitable to investigate the active site effect regulated by iron doping. The surface morphology of LT and Fe-doped lithium tantalate was also detected by AFM, as shown in Fig. 1c, Figs. S2 and S3 (Supporting information). The average surface roughness (Ra) for LT and Fe-LT was calculated about 0.462 nm and 0.407 nm, respectively, indicating the smooth and flat wafer surface, which was consistent with the SEM result.
As shown in Fig. 1d, the high-resolution transmission electron microscopy (HRTEM) image for Fe-LT showed a highly ordered lattice stripe arrangement and a high degree of crystallinity, without helical dislocations or stacking layer dislocations. It contained two sets of mutually perpendicular interference fringes with lattice spacing corresponding to the (012) and (112) crystal planes, respectively. In addition, the homogeneous diffraction spot distribution obtained by selected area electron diffraction (SAED) in Fig. 1e confirmed the perfect single-crystal structure of Fe-LT, and the calculated lattice parameters were consistent with the HRTEM results [26]. Energy dispersive spectroscopy (EDS) element mapping showed the uniform distribution of Fe, Ta and O elements, verifying the presence of Fe (Fig. 1f and Table S1 in Supporting information). Therefore, the above results confirmed that the obtained Fe-doped lithium tantalate wafers had low iron doping and did not affect the lattice structure of lithium tantalate. In addition, we obtained the doping amount of Fe was 0.002% by inductively coupled plasma (ICP) mass spectrometry in Table S2 (Supporting information).
X-ray photoelectron spectroscopy (XPS) was used to characterize the effect of Fe doping on the internal chemical state and coordination environment of lithium tantalate. Ta, O elements were detected in the survey spectra of both LT and Fe-LT in Fig. S4a (Supporting information) and Li element was detected in the survey spectra of Fe-LT in Fig. S4b (Supporting information), no peaks of Fe were detected in Fe-LT due to the low doping amount. The Ta 4f high-resolution XPS spectra of Fe-LT and LT (Fig. 1g) showed four typical peaks attributed to 4f7/2 and 4f5/2 of Ta5+ and Ta4+. According to the anti-site-defect model proposed by Wilkinson, the volatility of lithium led to the presence of lithium vacancies in lithium tantalate, some Ta5+ would enter the Li+ position to form TaLi4+ anti-site-defects and appeared as Ta4+ [19,27,28]. After doping with Fe, the four typical peaks of lithium tantalate shifted towards higher binding energy from 25.24 eV, 25.7 eV, 27.14 eV, 27.63 eV to 25.33 eV, 25.8 eV, 27.2 eV and 27.68 eV, respectively. Combined with the decrease of Ta4+ and increase of Ta5+, the doped Fe occupying TaLi4+ anti-site-defects could be demonstrated. The O 1s spectra in LT and Fe-LT in Fig. 1h could be resolved into the lattice oxygen peak, vacancy oxygen peak and adsorbed oxygen peak. The negative shift of the lattice oxygen peak from 529.83 eV for LT to 529.75 eV for Fe-LT, further implying the conclusion of doped Fe occupying TaLi4+ anti-site-defects. The Raman spectra were also measured to explore the effect of Fe doping on the chemical bonding in Fe-LT (Fig. 1i), in which the Raman peaks at 141.77 cm−1, 207.15 cm−1 and 595.5 cm−1 in LT were associated with Ta–O bonding. The peak at 464.93 cm−1 was related to the O–Ta–O bond. In addition, the vibrational modes located at 290.84 cm−1, 316.44 cm−1, 356.42 cm−1 and 382.02 cm−1 in LT were associated with Li–O bonding and the peaks shifted to the higher wave number after Fe doping, which were detected at 292.81 cm−1, 319.2 cm−1, 357.01 cm−1 and 382.81 cm−1 in Fe-LT. The lattice strain on the Li–O bond caused by iron doping might result in this phenomenon. As well known for LT, the Li–O octahedron (LiO6) connected with the Ta–O (TaO6) octahedron through a shared face and three oxygen atoms. When Fe took the place of TaLi4+ anti-site-defects, a broadening of the half-peak width of the TaO6 octahedron Raman peak at 141.77 cm−1 for Fe-LT (30.24) than that of LT (14.22) was detected [29-34]. Therefore, combining the XPS and Raman results with the available experimental studies, we speculated that Fe was doped in the LT lattice by occupying the TaLi4+ anti-site-defects sites.
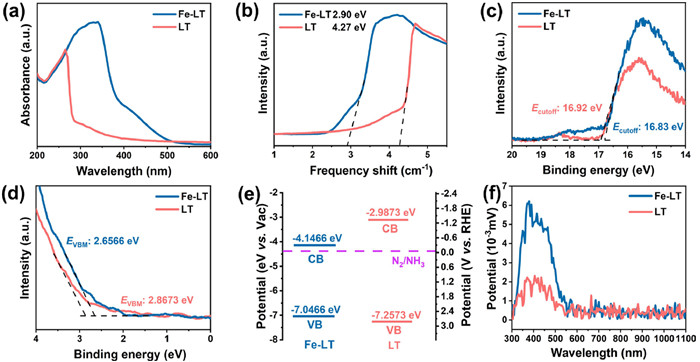
In order to obtain the effect of Fe doping on optical properties of LT, UV–vis absorption spectra were performed to investigate the light absorption performance of the wafers. As shown in Figs. 2a and b, the transparent LT exhibited an absorption edge at about 273 nm with significant UV light absorption, the corresponding band gap width of 4.27 eV was calculated. While regulated by the Fe doping, the yellow color for Fe-LT was exhibited and the light absorption range was widened to the visible region with a corresponding band gap width of 2.9 eV. In this regard, we speculated that the entry of the strongly polarized iron ions into the crystal would enhance the degree of deformation of the electron cloud around the oxygen ions, causing a red shift in the absorption edge. Thus, the Fe-LT had better light absorption ability and wider light absorption range.
Figure 2
Figure 2.
(a) UV–vis absorption spectra and (b) the plots of (F(R)E)1/2 based on the data from UV–vis absorption spectra versus Eg for LT and Fe-LT. The UPS spectra of the (c) secondary electron cutoff energy and (d) the low-energy onset region. (e) Corresponding energy band structure diagrams. (f) Surface photovoltage spectra of LT and Fe-LT.
For further investigating the band structure of LT and Fe-LT, the ultraviolet photoelectron spectroscopy (UPS) was applied [35,36]. As shown in Fig. 2c, the secondary electron cutoff (Ecutoff) of LT and Fe-LT were 16.92 eV and 16.83 eV, respectively. Combined with the onset relative to the Fermi level of the Si substrate (EVBM) obtained in Fig. 2d, the valence band energy (EVB) of LT and Fe-LT were calculated as −7.2573 eV and −7.0466 eV, respectively, from the following equation:
where EVB was the valence band energy, hν was the incident photon energy value of 21.22 eV, Ecutoff was the secondary electron cutoff energy. The conduction band energy (ECB) could be determined from the difference between EVB and band gap width. Thus, the energy band structure diagram of LT and Fe-LT were derived in Fig. 2e and the Fe doping in LT constructed a narrower band gap, which effectively broadening the light absorption range from UV to visible light.
Besides light absorption, the photogenerated carrier separation ability was another important factor affecting photocatalytic activity. So, the light response characteristics of LT and Fe-LT were estimated by the surface photovoltage spectrum (SPV) under different wavelengths of light using xenon lamp as light source in Fig. 2f. The stronger photo-voltage signal for Fe-LT than that of LT implied that more photoelectrons were generated and a longer lifetime of photoinduced electron-hole pairs regulated by Fe doping. In addition, the Kelvin probe force microscopy (KPFM) was also utilized to detect the surface potential of Fe-LT in the dark and Hg lamp illumination (Fig. S5 in Supporting information). Compared with the dark condition, the surface potential increased about 0.49 V under illumination, suggesting that the Fe doping was favor for the separation of photogenerated carriers. Concluded with the above results, the narrower band gap and a longer lifetime of photoinduced electron-hole pairs indicated that iron doping imparted lithium tantalate with enhanced photo response and carrier separation ability. It suggested that the Fe-LT should be an efficient photocatalytic nitrogen reduction system.
The photocatalytic nitrogen reduction experiment with continuous bubbling of N2 was carried out under full spectrum in a saturated aqueous solution of N2 without sacrificial agent in Fig. S6 (Supporting information).
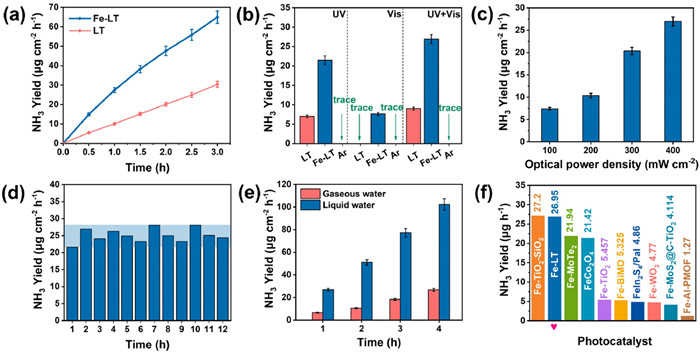
Before entering the reactor, the feed gas was purified with H2SO4 to remove contaminants such as NH3 and NOx. N2 was passed into the reactor for 30 min before light irradiation to establish an adsorption-desorption equilibrium. As shown in Fig. 3a, the amount of ammonia ions detected in the solution increased essentially linearly with the increase of light irradiation time. By fitting the curves, the ammonia yields of LT and Fe-LT under full spectrum irradiation were calculated as 10.01, 26.95 µg cm−2 h−1, respectively. The performance of Fe-doped LT was nearly 2.7 times higher than that of LT, which confirmed the impact of Fe doping in improving the performance of photocatalytic nitrogen reduction. This was also confirmed by the significantly increased absorption intensity of the electrolyte after Fe-LT photocatalytic nitrogen reduction reaction (NRR) than that of LT (Fig. S7 in Supporting information). To further explore the reasons for the improved photocatalytic performance of Fe ping, Fig. 3b also depicted the effects of UV (<380 nm) and visible light (400–700 nm) on the ammonia yields of Fe-LT and LT. Due to the absence of light absorption of LT in the visible region, no ammonia was generated. However, Fe-LT possessed the ammonia yield of 7.63 µg cm−2 h−1 under visible light illumination, indicating that the enhanced light absorption caused by Fe doping contributed to the improved photocatalytic efficiency. Under UV light illumination, although both of LT and Fe-LT showed light absorption, Fe-LT exhibited superior catalytic performance (21.8 µg cm−2 h−1) than that of LT (7.02 µg cm−2 h−1), verifying that Fe as the active site was another reason for improving ammonia production besides of increasing light absorption range. Meanwhile, no NH3 was detected in the control experiment using high purity Ar as feed gas, proving that NH3 was converted from N2. The apparent quantum efficiency (AQE) of ammonia production from Fe-LT under 365 nm, 385 nm, 400 nm, 420 nm, 435 nm, 450 nm illumination was also tested, respectively. The maximum value of 0.16% was achieved at 365 nm (Fig. S8 in Supporting information). As shown in Fig. 3c, the photocatalytic performances of Fe-LT at different optical power densities were also detected, and the ammonia yields gradually increased with the enhancement of optical power density, indicating the conversion of light to chemical energy.
Figure 3
Figure 3.
(a) Photocatalytic ammonia production versus time curves of Fe-LT and LT in the full-spectrum. (b) Photocatalytic nitrogen reduction yields of Fe-LT and LT in different light sources. (c) Catalytic performance of Fe-LT at different optical power densities. (d) Photocatalytic stability cycling test of Fe-LT. (e) Comparison of NH3 yield for Fe-LT in liquid water and in gaseous water environment. (f) Comparison of NH3 yield in this work with other photocatalysts.
In Fig. 3d, under the irradiation, the photocatalytic performance of Fe-LT did not decrease significantly after the 12 h cycling test, and the ammonia yield remained in the range of 21.59 µg cm−2 h−1 ~ 28.08 µg cm−2 h−1, confirming the excellent photocatalytic stability of Fe-LT. The SEM image of the catalyst in Fig. S9a (Supporting information) demonstrated that the surface of the wafer remained smooth structure and the morphology was not changed after the reaction. The X-ray diffraction (XRD) pattern, UV–vis absorption spectra and XPS results of the catalyst after stability testing further proved the high structure stability during photocatalytic reaction (Figs. S9b, S10 and S11 in Supporting information). All these characterizations indicated that the Fe-LT had excellent structure stability. Furthermore, we also compared the performance of Fe-LT in gaseous water condition (Fig. 3e). It was found that the performance in liquid water reaction condition was 4–5 times higher than that in gaseous water. We speculated that it was caused by the inadequate proton source for gaseous water, thus an adequate proton supply was also important for increasing the activity of photocatalytic nitrogen reduction. In addition, the NH3 yield in solution with sacrificial agent (20% methanol) was also detected, which was slightly increased than that in pure water (Fig. S12 in Supporting information). This may be due to the fact that single crystals with fewer grain boundaries promoted carrier transport, which could in turn suppress photogenerated charge recombination, thus the enhancement effect on carrier separation is not obvious. For evaluating the photocatalytic nitrogen reduction performance of Fe-LT in water, the ammonia yield of the recently reported photocatalysts were compared in Fig. 3f and Table S3 (Supporting information), compared with other representative catalysts, the ammonia yields of Fe-LT under full-spectrum illumination were better than or on par with the previously reported catalysts [15-17, 37-42].
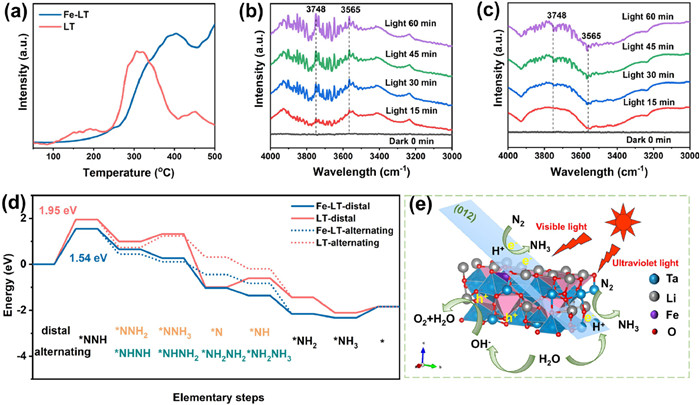
Since Fe as the active site improving ammonia production, further insights into the adsorption and activation process during the NRR of Fe-LT were explored by N2 programmed temperature desorption (N2-TPD) and in situ diffuse reflectance infrared spectroscopy (DRIFTS). As well known, N2 adsorption especially chemical adsorption played a dominant role in the process of photocatalytic NRR [43-45], the N2-TPD of LT and Fe-LT in Fig. 4a showed that the peaks in the 120–200 ℃ range were attributed to the physical adsorption of N2, and the chemisorption of N2 was in the range of 300–500 ℃. Compared with the LT (310 ℃), the desorption peaks of Fe-LT located at 403 ℃ presented the boosted chemical adsorption ability, which accelerating the NRR reaction to occur. The activation of nitrogen as well as the generation of ammonia in the nitrogen reduction process for Fe-LT and LT were also evaluated by the in situ diffuse reflectance infrared Fourier transform spectroscopy (DRIFTS), which detecting the intermediates produced during the reaction. Generally, the photogenerated electrons would be donated to the anti-bond orbitals of N2 molecules, which weakened the N≡N bond energy and then intermediates formed, the combined state (NH3) gradually produced. As shown in Fig. 4b, for Fe-LT, the peak at 3565 cm−1 corresponded to the stretching vibration peak of N—H bond, and the peak at 3748 cm−1 was attributed to the stretching vibration peak of –OH. After under light illumination, these two peaks gradually increased with the illumination time from 15 min to 60 min, implying the activation of H2O and the appearance of intermediates [46,47]. While for LT in Fig. 4c, the stretching vibration peak of N—H bond was not obvious, which might be due to the absence of Fe active sites leading to poor ammonia production activity.
Figure 4
Figure 4.
(a) N2-TPD spectra of LT and Fe-LT. In situ DRIFT spectra of (b) Fe-LT and (c) LT. (d) The free-energy diagram of the nitrogen reduction process for LT and Fe-LT. (e) Schematic diagram of photocatalytic nitrogen reduction on Fe-LT under illumination.
The density functional theory (DFT) calculations were further carried out to elucidate the effects of Fe doping on the N2 hydrogenation reaction pathway in NRR. As known, associative alternating pathway and associative distal pathway are the two widely accepted pathways in photocatalytic nitrogen reduction (Fig. S13 in Supporting information). We simulated the Gibbs free energies of both alternating and distal pathways using the (012) crystalline surface of Fe-LT and LT as a flat plate model (Fig. S14 in Supporting information) [17,40,48,49]. Fe atoms were taken as the adsorption sites in Fe-LT, while those in LT were the Ta atoms (Figs. S15-S18 in Supporting information). As shown in Fig. 4d, for both LT and Fe-LT, the reaction of N2 to *NNH (N2 + H+ + e− = *NNH) had the highest Gibbs free energy change, which was determined as the rate-determining step of NRR reaction. The values of this free energy change for Fe-LT and LT were 1.54 eV and 1.95 eV, respectively, implying the Fe doping facilitated the protonation of N2 to form *NNH. In the subsequent reaction steps, no matter for associative distal pathway or for associative alternating pathway, Fe-LT proceeded with a negative Gibbs free energy change, indicating the subsequent NRR reaction for Fe-LT proceeded readily. Considering that Fe-LT tends to more spontaneously occur with a lower free energy change (0.889 eV) in the second hydrogenation step of alternating pathway (*NNH + H+ + e− = *NHNH), the associative alternating pathway was considered to be the main nitrogen reduction pathway for Fe-LT. While for LT, the third hydrogenation step had an up-slope energy barrier for formation of *NHNH2 (0.498 eV) within the associative alternating pathway and *NNH3 (0.328 eV) within the associative distal pathway, and the further hydrogenation steps proceeded with a spontaneous reaction. Hence, LT preferred the hydrogenation of N2via the distal pathway with a lower up-slope energy barrier. The barrier of rate-determining step for Fe-LT was substantially lower than that of LT, implying that doping iron changed the pathway of hydrogenation and favored the hydrogenation reaction, which enhanced the photocatalytic activity in NRR.
Considering the light absorption properties as well as the ammonia yields comparison under different light zones, the catalytic enhancement of photocatalytic N2 fixation over the Fe-LT was schemed in Fig. 4e. Firstly, the Fe doping could broaden the absorbing light region of lithium tantalate from UV light to the visible region. Secondly, the electronic structure of lithium tantalate was regulated by introducing Fe doping defects to accelerate the charge carrier separation. Lastly, iron element could also act as a catalytic active site for promoting nitrogen adsorption, nitrogen activation and subsequent hydrogenation process.
This study proposed a Fe-doped single-crystal LT photocatalyst for the nitrogen reduction reaction. Leveraging the long-range ordered structure and flat surface of the single crystal material, it enhanced the electron transfer efficiency and achieved excellent stability for Fe-LT. Furthermore, the smooth single crystal plane mitigated the influences of other factors such as crystal planes and surface active site, facilitating a more focused investigation into the role of active sites induced by doping elements. Thus, the impact of Fe doping on the photocatalytic nitrogen reduction performance was clearly investigated by performance comparison in different light wavelength ranges and theoretical calculations. The Fe doping extended the light absorption range of lithium tantalate from UV to the visible light region. In addition, iron dopants acted as active sites for nitrogen reduction, lowering the energy barrier of the rate-limiting step and thereby steering hydrogenation along a favorable pathway.
Declaration of competing interest
The authors declare that they have no known competing financial interests or personal relationships that could have appeared to influence the work reported in this paper.
This work was supported by Natural Science Foundation of Shandong Province (Nos. ZR2022YQ42, ZR2021JQ15, ZR2021QE011, ZR2021ZD20, 2022GJJLJRC-01), Innovative Team Project of Jinan (No. 2021GXRC019), the National Natural Science Foundation of China (Nos. 52022037, 52202366).
Supplementary materials
Supplementary material associated with this article can be found, in the online version, at doi:10.1016/j.cclet.2024.110107.
Figure 1
(a) XRD diffraction patterns of Fe-LT and LT. (b) The SEM image of Fe-LT. (c) Three-dimensional image of Fe-LT surface measured by atomic force microscopy (AFM). (d) Lattice structure of Fe-LT determined by high resolution transmission electron microscopy (HRTEM). (e) Selected area electron diffraction (SAED) pattern of Fe-LT single crystal and corresponding (f) EDS profiles of Fe-LT. The high-resolution XPS spectra of (g) Ta 4f and (h) O 1s, and (i) Raman spectrum for Fe-LT and LT.
Figure 2
(a) UV–vis absorption spectra and (b) the plots of (F(R)E)1/2 based on the data from UV–vis absorption spectra versus Eg for LT and Fe-LT. The UPS spectra of the (c) secondary electron cutoff energy and (d) the low-energy onset region. (e) Corresponding energy band structure diagrams. (f) Surface photovoltage spectra of LT and Fe-LT.
Figure 3
(a) Photocatalytic ammonia production versus time curves of Fe-LT and LT in the full-spectrum. (b) Photocatalytic nitrogen reduction yields of Fe-LT and LT in different light sources. (c) Catalytic performance of Fe-LT at different optical power densities. (d) Photocatalytic stability cycling test of Fe-LT. (e) Comparison of NH3 yield for Fe-LT in liquid water and in gaseous water environment. (f) Comparison of NH3 yield in this work with other photocatalysts.
Figure 4
(a) N2-TPD spectra of LT and Fe-LT. In situ DRIFT spectra of (b) Fe-LT and (c) LT. (d) The free-energy diagram of the nitrogen reduction process for LT and Fe-LT. (e) Schematic diagram of photocatalytic nitrogen reduction on Fe-LT under illumination.

 DownLoad:

 下载:
下载:


