Figure 1.
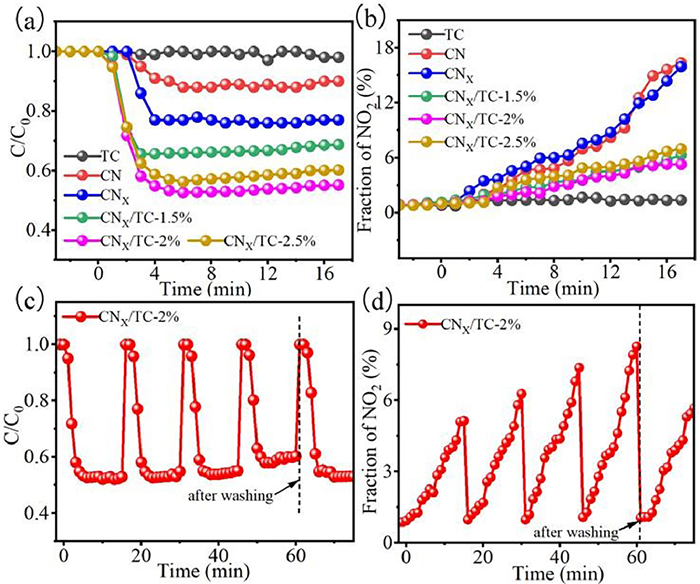
(a) NO removal rate of synthesized samples. (b) NO2 generation rate (initial concentration of NO stabilized at 780 ppb, λ > 420 nm). (c) Photocatalytic cycle test. (d) NO2 generation rate of photocatalytic cycle test.
Amorphous titanium carbide on N-defective g-C3N5 for high-efficiency photocatalytic NO removal
Ke Zhang , Yajing Wei , Linhua Xie , Sha Kang , Fei Li , Chuanyi Wang

Nitric oxide (NO) is recognized as one of the typical gas pollutants which are harmful to human health and the environment. Several common methods have been proposed for NO removal including physical adsorption [1], biological filtration [2,3], thermal catalytic reduction [4], photocatalysis [5–7]. In these technologies, photocatalysis is the most promising and environmentally friendly approach to removal of ppb-grade NO [8,9]. Nowadays, photocatalytic purification of NO is faced with various challenges, such as low efficiency of NO removal and higher byproduct generation. In particular, the toxic NO2 by-products produced during photocatalytic oxidation are even more harmful than NO. To address these problems, the design and construction of efficient catalysts are crucial for the photocatalytic oxidation of NO.
Currently, C3N5 with a narrow band gap (~2.2 eV) has been successfully synthesized for efficient hydrogen production and photocatalytic degradation of organic pollutants [10,11]. Compared to the widely used g-C3N4 with only a triazine structure, C3N5 consisting of triazole and triazine increases the π-π conjugate and the pyrrole N position, leading to an increase in the number of electrons and redox activity [12]. However, C3N5 still suffers from photo charge carrier recombination and lack of active sites, limiting its photocatalytic performance and practical applications.
Vacancy engineering has been recognized as one of the most effective strategies to improve the activity of photocatalysts [13]. This is because the vacancy cannot only extend the light absorption range, but also improve the electrical conductivity of g-C3N5 [10–12, 14–17]. Unfortunately, the limited active sites available for adsorption and activation reaction molecules still affect the photocatalytic performance. Therefore, further modification methods are needed to perfect g-C3N5. Reasonable loading of cocatalyst is another effective method to improve the activity of photocatalyst, where the built-in electric field formed at the two-phase interface drives the separation and transfer of photogenerated carriers, additionally, the cocatalyst can also serve as the active site for photocatalytic reaction. Ti3C2 is an emerging two-dimensional layered material, showing great potential in the field of photocatalysis [18–20]. Some studies have shown that amorphous structures with a large number of unsaturated electronic sites can provide abundant active sites for the adsorption and reaction of reactants [21,22]. It is speculated that amorphous Ti3C2 may facilitate the adsorption of NO and O2, thus promoting the photocatalytic removal of NO.
Herein, we used an efficient and facile reaction route to synthesize g-C3N5 nanosheets with N vacancy. Then, the CNX/TC composite was fabricated via self-assembly of TC on N-vacancy g-C3N5 nanosheets. Interestingly, TC in CNX/TC hybrid transforms into an amorphous state under visible light irradiation. The removal rate of NO in the optimal CNX/TC-2% catalyst is up to 48%, which is about 2 and 4 times higher than those of pure CNX and CN, respectively. This can be attributed to the high-speed distribution of photoproduced electrons from CNx to amorphous TC and the abundant active sites in amorphous TC for the reactant adsorption and reaction. This work reveals the catalytic role of N-defect and amorphous on photocatalysts during the removal of NO.
The NO removal performance of the photocatalysts were evaluated under visible light irradiation (Figs. 1a and b). As shown in Fig. 1a, the NO concentration in the cavity was stable at about 780 ppb (0.78 mg/m3) after adsorption-desorption equilibrium in dark conditions. After 20 min photocatalytic reaction, NO concentration did not change in the presence of TC, indicating that TC had no photocatalytic removal effect on NO. The CN exhibited limited photocatalytic NO removal activity (11%) and produced 80 ppm toxic by-product NO2 (Fig. 1b), which means that almost all of the removed NO converted into NO2. The NO removal rate of the photocatalyst was enhanced along with NaBH4 treatment (23%), but it did not reduce the production of the toxic byproduct NO2. The photocatalytic activity of CNX was significantly improved with the addition of TC. The optimized catalyst (CNX/TC-2%) achieved the highest NO removal rate of 48% after 6 min of visible light irradiation and maintained the dynamic equilibrium state for the rest of the time (Fig. S1 in Supporting information). The generation of toxic by-product NO2 decreased to around 40 ppm (around 5%). The DeNOx index of each photocatalyst was calculated to reflect the relative toxicity, As shown in Fig. S2 (Supporting information), the DeNOx index values for all catalysts are positive. Notably, too much TC in the composite catalysts resulted in decreased photocatalytic performance because it blocks the absorption of light by carbon nitride.
The photocatalytic cycle test was performed to investigate the stability of CNX/TC-2% (Figs. 1c and d). After 4 cycles, the photocatalytic NO removal rate of CNX/TC-2% decreased slightly, while the NO2 generation rate increased from 5% to 8%, which can be attributed to the resulting oxidation products (such as nitrate) covering active sites on the catalyst surface. After the removal of these adsorbed nitrates with deionized water washing, the photocatalytic performance of CNX/TC-2% was effectively restored.
The morphology of the sample was characterized by SEM and TEM. As shown in Figs. 2a and b, the MXene after Al stripping shows a loose accordion shape, and the CNX with sheet structure is absorbed on the surface of TC [23]. The morphology was further investigated by TEM. As expected, Fig. 2c shows that CNX sheets are dispersed on the TC sheets and there is abundant contact between them. It is noteworthy that the lattice fringes of TC quickly disappear under HRTEM, and ultimately neither CNX nor TC sheets exhibit lattice fringes (Fig. 2d). Figs. 2e and f shows the selected area electron diffraction of TC in the CNX/TC nanocomposites. In the beginning, the TC exhibits an electron diffraction pattern, but it quickly disappears under electron irradiation, leaving only three bright diffraction rings, indicating that the TC shifted from a crystal structure to an amorphous structure. The amorphous structure means that there is a lack of long-range atomic order and has many defects, which could offer more active sites and promote charge transfer and thus lead to an enhanced photocatalytic activity of NO removal.

The phase structures of the CNX, TC and CNX/TC-2% photocatalysts were characterized by X-ray diffraction (XRD). As shown in Fig. 2g, the two diffraction peaks at 2θ values of 18.1° and 60.7° indexed to the (004) and (110) facets of TC, respectively. The peak located at 27.3° with the highest intensity corresponds to the (002) plane of the aromatic structure of CNX. The XRD patterns of CNX/TC-2% exhibited all the diffraction peaks of CNX and TC, indicating the successful preparation of the composite catalysts. Fig. 2h shows XRD patterns of CNX/TC-2% before and after light irradiation. The diffraction peak at the 2θ values of 60.7° is significantly smaller and broader, indicating a decrease in the crystallinity of TC [24].
The surface chemical composition and elemental valence states of CN, CNX and CNX/TC-2% were investigated by X-ray photoelectron spectroscopy (XPS). Fig. 3a shows the XPS survey spectra of the samples. The corresponding binding energies of C 1s (Fig. 3b) at 288.4, 286.1 and 284.8 eV are attributed to the nitrogen-containing aromatic ring (N-C=N), adsorbed water (C-OH), and adsorbed carbon species (C-C) [11]. The corresponding binding energies of N 1s at about 403, 400, 398.4, and 397.5 eV are attributed to the π-π*, C–NH2, C–N=N–C and C=N-C bonds, respectively (Fig. 3c). After NaBH4 treatment, the ratio of C–N=C to C–N=N–C decreased from 2.98 to 1.55, manifesting that nitrogen vacancy (Nv) was preferentially engineered in C–N=C group. According to the formation energy data, the possible structure of N defective C3N5 is proposed in Fig. S3 (Supporting information). Compared with CNX, the peak area of C-NH2 in CNX/TC-2% increased, which can be attributed to the newly formed C-NH2 bond by the interaction between CNX and TC. The peaks of C–N=N–C and C-NH2 in CNX/TC-2% shift toward the low-binding energy direction. This is because the Fermi level (EF) of CN is lower than that of TC, electrons are transfer from TC to CN until the EF in TC and CN are equal. Fig. 3d shows the O 1s XPS spectrum of CNX/TC-2%, the peak can be deconvoluted into two peaks at about 528.4 eV and 529.7 eV, which correspond to C=O and C-O, respectively. In addition, the content of Ti in the composite is too small to be detected in the fine spectrum (Fig. S4 in Supporting information).

Surface functional groups of the prepared samples were determined by Fourier transform infrared (FTIR) spectroscopy. As shown in Fig. 4a, there is a distinct peak around 808 cm−1, which can be attributed to the stretch of the triazine ring [19]. The tensile vibration of 1200 to 1600 cm−1 belongs to the stretching of the triazine ring. The broad peak at ca. 3200 cm−1 is due to the tensile vibration of the -OH and –NH groups [25]. CNX reveals a similar infrared spectrum to CN, indicating that the structure integrity of CN remains intact after sodium borohydride treatment. Compared with CNX, the peaks of CNX/TC nanocomposites are basically unchanged, possibly due to the low content of TC and the overlap of peak position.

The optical response ability of TC, CN, CNX and CNX/TC was measured using UV-visible diffuse reflection spectroscopy (Fig. 4b). Both CN and CNx exhibit good absorption in the visible light range. The TC shows a characteristic of full-spectrum absorption from 300 nm to 800 nm [24]. Although TC cannot generate the photoinduced carriers after absorbing photons, the photothermal effect from black TC is beneficial for photocatalytic NO removal. Compared with CNX, the CNX/TC-2% exhibits absorption in the broad spectrum from UV to visible light, this phenomenon is related to the full spectrum absorption of TC. The band gap energy (Eg) of CNX is obtained from its corresponding Tauc plot, which is derived from the UV-vis spectrum. As shown in Fig. 4c, the calculated Eg of CNX is 2.28 eV.
Considering that the specific surface area is an important factor affecting the photocatalytic performance of the material, we measured the nitrogen adsorption isotherm of the photocatalyst. Fig. 4d shows the N2 adsorption and desorption curves of TC, CN, CNX and CNX/TC-2% composite, all the catalysts exhibit type IV isotherms. The calculated specific surface area value of the TC, CN, CNX and CNX/TC-2% composite was 2.3789, 1.4883, 8.0609 and 19.5750 m2/g, respectively. The increased specific surface area is beneficial for the adsorption and conversion of NO. The aperture distribution curve was obtained on the basis of the N2 desorption curve (Fig. 4e), as shown, the pore size distribution reveals a broad range of 1–200 nm, and the highest pore concentration of TC, CN, CNX, CNX/TC-2% are 1.6, 3.1, 2.35 and 11.9 nm, respectively. The large specific surface area CNX/TC-2% composite can provide more transport channels to adsorb gas molecules, thus improving the gas removal performance.
The flat potential of CNx was determined by Mott–Schottky. As depicted in Fig. 4f, CNx shows a positive slope, indicating that it is an n-type semiconductor. The flat band potential of CNX relative to SCE is −1.10 V, which was converted to −0.86 V vs. normal hydrogen electrode (NHE). Generally, the flat band potential calculated using Mott–Schottky is 0.1–0.3 V higher than the conduction band (CB) potential [19,26]. So, the CB potential of CNX is about −1.06 V. Combining the data of diffuse reflectance spectroscopy (DRS) and Mott–Schottky, the valence band (VB) potential of CNX is 1.22 V.
Electrochemical tests were performed to further understand the electron transfer kinetics of the synthesized catalysts. As shown in Fig. 5a, transient photocurrent response curves were obtained by switching the light on and off. All the photocatalysts possess high photo-sensitivity and efficient spatial charge separation. Compared to CN and CNX, CNX/TC-2% nanocomposite exhibited the maximum charge separation efficiency, indicating that the TC can effectively accelerate the charge separation on the photocatalyst. The Nyquist plots of the electrochemical impedance are shown in Fig. 5b, the half-circle of CNX/TC-2% is smaller than that of CN and CNX, indicating the minimum surface charge transfer resistance.

Photoluminescence (PL) spectroscopy is used to identify the separation efficiency of photogenerated electron/hole pairs [20]. As can be seen from Fig. 5c, the fluorescence intensity decreased after introducing N vacancy, and further with the addition of TC indicating that the photoexcited electron-hole pair is more easily separated on CNX/TC-2%, thus facilitating the photocatalytic removal of NO. Fig. 5d shows the time-resolved transient PL decay spectra of CN, CNX, and CNX/TC-2%. The resulting lifetime values and their fractional components are shown in Table S2 (Supporting information). The average lifetime of CN, CNX and CNX/TC-2% are 22.28, 13.04, and 7.19 ns, respectively. Compared with CN and CNX, the PL lifetime of CNX/TC-2% is remarkably reduced, this phenomenon is probably due to the existence of the more efficient nonradiative decay pathway, which is caused by the electron transfer process from CNX to TC.
To identify the active species, radical scavenging experiments were performed in photocatalytic reactions with CNX/TC-2%. The photocatalyst (50 mg) containing different capture agents (1 mmol) was dispersed in absolute ethanol (10 mL) and evenly mixed by ultrasonic. The catalyst ink was evaporated in a 60 ℃ oven to form a uniform film. Ascorbic acid (AA), tert-butanol (TBA), potassium dichromate (K2Cr2O7), and potassium iodide (KI) are used as scavengers to capture superoxide radicals, hydroxyl radicals, electrons and holes, respectively. As shown in Fig. 5e, NO removal efficiencies decreased to 1.2%, 5.8%, 8.1% and 18.1% corresponding to the addition of K2Cr2O7, KI, AA and TBA, respectively.
Electron paramagnetic resonance (EPR) spectra of CN, CNX, and CNX/TC-2% were collected to analyze the unpaired electrons generated from the structural defects. As shown in Fig. 5f, all of the samples exhibit a strong Lorentz EPR signal at a g-factor of 2.003, resulting from the unpaired electrons on carbon atoms in π conjugated rings. The signal intensity of CNX and CNX/TC-2% were significantly stronger than that of CN, which implies more structural defects and unpaired electrons. After the photocatalytic reaction, there is a slight decrease in the signal of CNX/TC-2% (Fig. S5 in Supporting information).
As shown in Figs. 6a–c, the CNX/TC-2% did not generate any signals in dark conditions. By contrast, the characteristic signals of DMPO-•OH, DMPO-•O2− and TEMP-1O2 adduct were detected in the photocatalytic system under visible light irradiation, suggesting the presence of •OH, •O2− and 1O2.
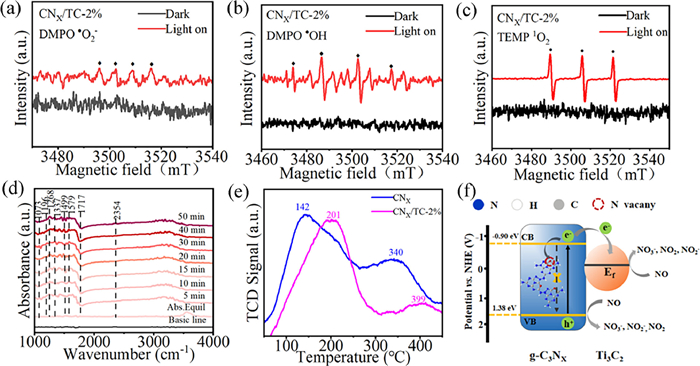
The photocatalytic NO removal in CNX/TC-2% was investigated using in situ diffused reflection Fourier transform infrared spectroscopy (in-situ DRIFTS) (Fig. 6d). Under visible light irradiation, various characteristic peaks belonging to NO derivatives appeared. NO3− bands were observed at 1268, 1337, 1499 and 2354 cm−1, the bands at 1073 and 1717 cm−1 are assigned to NO2−, the peak at 1196 cm−1 was attributed to the NO+ band, and its reaction products are related to the nitrate and nitrite species [27–29].
The premise of photocatalytic removal of NO is the adsorption of target molecules on the catalyst surface. The adsorption state of NO and O2 on the catalyst surface was studied by NO and O2 temperature programmed desorption (NO-TPD, O2-TPD) method [30]. The position of the peak indicates the adsorption strength, and the area of the peak represents the adsorption capacity. As shown in Fig. 6e, there are two distinct peaks at 142 ℃ and 340 ℃ over CNX, the peak at 142 ℃ is attributed to the physical adsorption or weak chemisorption of NO, and the other peak is attributed to strong chemisorption. Compared with CNX, all the peaks in CNX/TC-2% were shifted toward a higher temperature, which suggests an increase in the adsorption strength of NO. Additionally, the area of the peak at 399 ℃ decreased, indicating a decrease in the number of NO molecules that were strongly chemisorbed with the catalyst. CNX/TC-2% possesses a moderate adsorption strength for NO, which is beneficial for reactant molecules to participate in the subsequent reactions and desorption.
Based on the above experiment results, the possible photocatalysis mechanisms for NO removal were proposed, as illustrated in Fig. 6f. Under visible light irradiation, charge carriers are separated in CNX, part of excited electrons is captured by nitrogen vacancies, and the rest of excited electrons are transferred to TC due to the lower Fermi level. The adsorbed O2 or H2O molecules reacted with separated charges in the TC layer to generate •O2– or •OH radicals, which participate in the photocatalytic NO removal process [31]. The speculated reaction process of NO removal by CNX/TC-2% are described as follow (Eqs. 1–8):
|
|
(1) |
|
|
(2) |
|
|
(3) |
|
|
(4) |
|
|
(5) |
|
|
(6) |
|
|
(7) |
|
|
(8) |
In this work, TC modified N-defective g-C3N5 photocatalysts were synthesized successfully. The NO removal rate of CNX/TC-2% was the highest (48%) and the photocatalytic activity could be recovered by washing after the cyclic test. The greatly improved photocatalytic performance may be due to the existence of N vacancies and TC inhibiting the charge carrier's recombination. In particular, the catalyst structure was reconstructed during the photocatalytic process, changing from crystal to amorphous structure, thanks to the long-range atomic disorder, amorphous TC possesses abundant unsaturated edge sites, which are conducive to the removal of NO. Furthermore, the possible photocatalytic pathways of NO removal were proposed. This study brings new insights into the role of amorphous TC in promoting activity and byproduct inhibition during NO photocatalytic oxidation, expanding the application of TC and g-C3N5 in the field of photocatalysis.
Ke Zhang: Conceptualization, Funding acquisition, Project administration, Resources, Writing – review & editing. Yajing Wei: Data curation, Investigation, Writing – original draft, Visualization. Linhua Xie: Writing – review & editing. Sha Kang: Validation. Fei Li: Formal analysis. Chuanyi Wang: Supervision, Resources.
The authors acknowledge the support from the Scientific Research Program Funded by Education Department of Shaanxi Provincial Government (No. 23JP011), Guangzhou Fundamental Research Program (No. 2023A04J0697), the scientific research startup fund of Shaanxi University of Science and Technology.
Supplementary material associated with this article can be found, in the online version, at doi:
R. Ben-Mansour, M.A. Habib, O.E. Bamidele, et al., Appl. Energy 161 (2016) 225–255. doi: 10.1016/j.apenergy.2015.10.011
I. Phillips, M. Greenway, C. Henderson, Water Sci. Technol. 55 (2007) 183–191.
J. Read, T. Wevill, T. Fletcher, A. Deletic, Water Res. 42 (2008) 893–902. doi: 10.1016/j.watres.2007.08.036
J. Liu, G. He, W. Shan, et al., Appl. Catal. B: Environ. Energy 291 (2021) 120125. doi: 10.1016/j.apcatb.2021.120125
V.H. Nguyen, B.S. Nguyen, C.W. Huang, et al., J. Clean. Prod. 270 (2020) 121912. doi: 10.1016/j.jclepro.2020.121912
M.M. Ballari, M. Hunger, G. Hüsken, H.J.H. Brouwers, Appl. Catal. B: Environ. Energy 95 (2010) 245–254. doi: 10.1016/j.apcatb.2010.01.002
V. Khanal, N.O. Balayeva, C. Günnemann, et al., Appl. Catal. B: Environ. Energy 291 (2021) 119974. doi: 10.1016/j.apcatb.2021.119974
H. Medina, J.G. Li, T.Y. Su, et al., Chem. Mater. 29 (2017) 1587–1598. doi: 10.1021/acs.chemmater.6b04467
C.H. Ao, S.C. Lee, J.C. Yu, J. Photochem. Photobiol. A 56 (2003) 171–177.
G.P. Mane, S.N. Talapaneni, K.S. Lakhi, et al., Angew. Chem. Int. Ed. 56 (2017) 8481–8485. doi: 10.1002/anie.201702386
J. Zhang, B. Jing, Z. Tang, et al., Appl. Catal. B: Environ. Energy 289 (2021) 120023. doi: 10.1016/j.apcatb.2021.120023
P. Kumar, E. Vahidzadeh, U.K. Thakur, et al., J. Am. Chem. Soc. 141 (2019) 5415–5436. doi: 10.1021/jacs.9b00144
J. Wu, J. Wang, T. Guan, et al., Fuel 292 (2021) 120251. doi: 10.1016/j.fuel.2021.120251
S.A. Ghasemi, H. Mirhosseini, T.D. Kühne, Phys. Chem. Chem. Phys. 23 (2021) 6422–6432. doi: 10.1039/d0cp06185a
S. Vadivel, S. Hariganesh, B. Paul, et al., Colloid Surf. A 592 (2020) 124583. doi: 10.1016/j.colsurfa.2020.124583
I.Y. Kim, S. Kim, X. Jin, et al., Angew. Chem. Int. Ed. 57 (2018) 17135–17140. doi: 10.1002/anie.201811061
B. Mortazavi, F. Shojaei, M. Shahrokhi, et al., Carbon 167 (2020) 40–50. doi: 10.1016/j.carbon.2020.05.105
P. Huang, W.Q. Han, Nano Micro Lett. 15 (2023) 68. doi: 10.1007/s40820-023-01039-z
H. Wang, R. Zhao, H. Hu, et al., ACS Appl. Mater. Interfaces 12 (2020) 40176–40185. doi: 10.1021/acsami.0c01013
Z. Cao, Q. Yin, Y. Zhang, et al., J. Alloy. Compd. 918 (2022) 165681. doi: 10.1016/j.jallcom.2022.165681
H. Jiang, T. Shang, H. Xian, et al., Small Struct. 2 (2020) 2000057.
D. Gao, W. Zhong, X. Wang, et al., J. Mater. Chem. A 10 (2022) 7989–7998. doi: 10.1039/d2ta00686c
B. Li, H. Song, F. Han, L. Wei, Appl. Catal. B: Environ. Energy 269 (2020) 118845. doi: 10.1016/j.apcatb.2020.118845
S. Liu, M. Wang, G. Liu, et al., Appl. Surf. Sci. 567 (2021) 150747. doi: 10.1016/j.apsusc.2021.150747
J. He, J. Yang, F. Jiang, et al., Chemosphere 258 (2020) 127339. doi: 10.1016/j.chemosphere.2020.127339
Y. Chen, X. Liu, L. Hou, et al., Chem. Eng. J. 383 (2020) 123132. doi: 10.1016/j.cej.2019.123132
W.C. Huo, X.A. Dong, J.Y. Li, et al., Chem. Eng. J. 361 (2019) 129–138. doi: 10.1016/j.cej.2018.12.071
J. Nie, Q.U. Hassan, Y. Jia, et al., Inorg. Chem. Front. 7 (2020) 356–368. doi: 10.1039/c9qi01152h
P. Chen, H. Liu, Y. Sun, et al., Appl. Catal. B: Environ. Energy 264 (2020) 118545. doi: 10.1016/j.apcatb.2019.118545
B. Chen, Y. Ma, L. Ding, et al., Chin. J. Catal. 34 (2013) 964–972. doi: 10.1016/S1872-2067(12)60585-3
L. Wang, D. Lv, F. Dong, et al., ACS Sustain. Chem. Eng. 7 (2019) 3010–3017. doi: 10.1021/acssuschemeng.8b04454

Figure 1 (a) NO removal rate of synthesized samples. (b) NO2 generation rate (initial concentration of NO stabilized at 780 ppb, λ > 420 nm). (c) Photocatalytic cycle test. (d) NO2 generation rate of photocatalytic cycle test.

Figure 2 (a, b) SEM and (c, d) TEM images of CNX/TC-2%. (e, f) Selected area electron diffraction of TC in CNX/TC. (g) XRD patterns of TC, CNX, CNX/TC-2%. (h) XRD patterns of CNX/TC-2% before and after light irradiation.

Figure 3 (a) The XPS survey spectra and (b-d) the XPS spectra of CN, CNX and CNX/TC-2%.

Figure 4 (a) Fourier transform infrared (FTIR) spectrometry, (b) UV-vis DRS, (d) nitrogen adsorption/desorption isotherms and (e) distribution of pore size of TC, CN, CNX and CNX/TC-2%. (c) The plot of (αhv)2 vs. photon energy based on UV–vis DRS spectra and (f) Mott–Schottky plots of CNX.

Figure 5 (a) Transient photocurrent responses, (b) electrochemical impedance spectra, (c) PL spectra, (d) time-resolved transient PL decay spectra and (f) EPR spectra of CN, CNX and CNX/TC-2%. (e) Capture experiments on CNX/TC-2%.

 扫一扫看文章

扫一扫关注我们
 DownLoad:
 下载:
下载:
