Received Date:
26 January 2024 Accepted Date:
02 June 2024 Revised Date:
17 April 2024 Available Online:
15 March 2025
Abstract:
Iron-porphyrin metal-organic frameworks (MOFs) have emerged as a remarkable class of semiconductors with adjustable photoelectrical properties and peroxidase-mimicking activities, yet their full potential remains largely unexplored. The organic photoelectrochemical transistor (OPECT) has been proven to be a prominent platform for diverse applications. Herein, iron-porphyrin MOFs, as bifunctional photo-gating module and horseradish peroxidase-mimicking nanozyme, is explored for novel OPECT bioanalysis. Exemplified by alpha-fetoprotein (AFP)-dependent sandwich immunorecognition and therein glucose oxidase (GOx)-generated H2O2 to etch CdS quantum dots on the surface of iron-porphyrin MOFs, this OPECT bioanalysis achieved high-performance AFP detection with a low detection limit of 24 fg/mL. This work featured a bifunctional iron-porphyrin MOFs gated OPECT, which is envisioned to inspire more interest in developing the diverse MOFs-nanozymes toward novel optoelectronics and beyond.
Nanozymes represent a family of functional nanomaterials with innate enzyme-mimicking activities, which have attracted substantial attention in various fields, including biosensing, cancer theranostics, anti-bacterial and anti-viral agents [1-3]. Benefiting from the tuned Lewis acidity of the metal clusters and structural diversity of active ligands, metal-organic frameworks (MOFs) as nanozymes displayed unique advantages over their natural counterparts, such as facile synthesis, low-cost, long-term stability, and adjustable activities [4]. Among various MOFs-based nanozymes, iron-porphyrin MOFs have raised significant research interest [5,6]. The confined iron ions in the porphyrin structure can serve as biomimetic catalyst centers, while porphyrin ligands act as electron mediators [7]. On the other hand, besides the enzyme-mimicking activities, iron-porphyrin MOFs have inherent photoinduced charge separation and semiconductor-like band-bending behavior [8,9], which has been used for photocatalysis, photoelectrochemical (PEC) water splitting, CO2 reduction, etc. [10,11] Despite the promising perspective, the full potential of iron-porphyrin MOFs remains to be explored, especially the simultaneous utilization of enzyme-mimicking activity and semiconductor-like behavior in a single device has not been reported.
PEC bioanalysis represents a burgeoning technology with a low background and high sensitivity [12-17]. Based on the integration between PEC bioanalysis and the organic transistor [18-23], organic photoelectrochemical transistor (OPECT) presents an advanced platform for probing photo-electric-biological events with intrinsic amplification [24-28], which has been increasingly explored for biosensing, opto-logics, and neuromorphic studies [29-32]. Principally, OPECT is composed of source (S), drain (D), photogate (PG), electrolyte (E), and organic channel (C), e.g., poly(3,4-ethylene dioxythiophene):poly(styrene sulfonate) (PEDOT:PSS) [33]. Upon light illumination, a slight voltage variation of PG (VPG) could redistribute the potential drop within the two interfaces (PG/E and C/E) and regulate the volumetric ionic doping state of the PEDOT:PSS channel with altered channel current (IDS) [34].
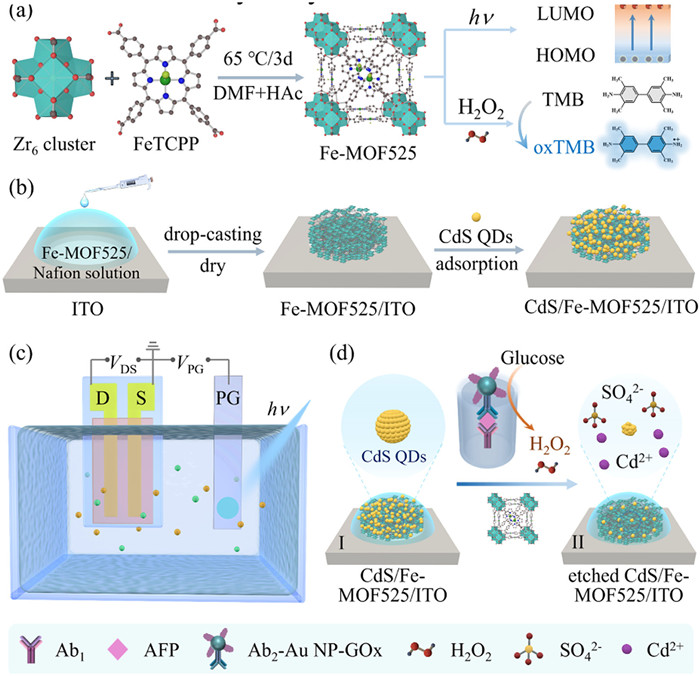
Herein, we report the cascading functionality of iron-porphyrin MOFs to gate the OPECT as a semiconductor and to catalyze the biorelevant reaction as horseradish peroxidase (HRP)-mimicking nanozymes for bioanalytical application, which was exemplified by the biocatalytic etching of CdS quantum dots (QDs) on the surface of Fe-MOF525 toward protein detection. Specifically, as shown in Scheme 1a, Zr6 clusters and iron tetrakis(4-carboxyphenyl)-porphyrin (FeTCPP) ligands were used to prepare the Fe-MOF525, which possessed photoresponsibility and peroxidase-mimicking activity that could catalytic oxidate 3,3′,5,5′-tetramethylbenzidine (TMB) in the presence of H2O2. As shown in Scheme 1b, Fe-MOF525 was drop-casted onto an indium tin oxide (ITO) glass, followed by adsorption of CdS QDs on the surface of Fe-MOF525, which was then used as PG to assemble the three-terminal OPECT as shown in Scheme 1c. By linking with a glucose oxidase (GOx)-labeled sandwich immunorecognition event in a 96-well plate, as illustrated in Scheme 1d, the GOx-generated H2O2 was steered to participate in the Fe-MOF525-enabled etching of CdS QDs into sulfate anions and Cd2+ cations. Such a process could sensitively modulate the OPECT via the altered PG current (IPG) and IDS, thus making possible the quantitative detection of alpha-fetoprotein (AFP) as the modal target. This work reported the bifunctionality of iron-porphyrin MOFs to optically gate the OPECT and catalytically alter its characteristics.
Scheme 1
Scheme 1.
(a) Synthetic scheme of Fe-MOF525 with photoresponsibility and peroxidase-mimicking properties. (b) Fabrication procedure of CdS/Fe-MOF525/ITO PG. (c) Structure of the proposed OPECT device. (d) H2O2-assisted etching of CdS QDs by Fe-MOF525.
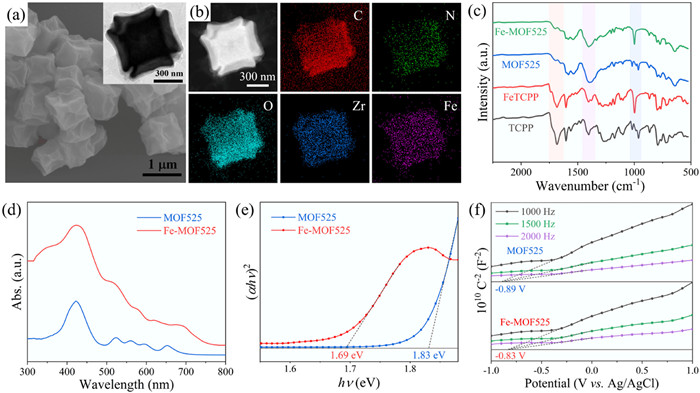
As shown in Fig. 1a, scanning electron microscope (SEM) and transmission electron microscope (TEM) images illustrated that the as-synthesized Fe-MOF525 exhibited a distorted cubic morphology with an average size of 0.7 µm. The energy-dispersive spectroscopy (EDS) mapping in Fig. 1b revealed that the C, N, O, Zr, and Fe elements were evenly dispersed in the structure, indicating the successful synthesis of Fe-MOF525. Incidentally, by substitution of FeTCPP ligand with TCPP as shown in Fig. S1 (Supporting information), MOF525 without confined Fe ions was prepared as a control which displayed a similar morphology to Fe-MOF525 but with a larger size of 1.2 µm, as shown in Fig. S2 (Supporting information). The corresponding EDS mapping in Fig. S3 (Supporting information) verified the C, N, O, and Zr elemental composition. Next, as shown in Fig. 1c, Fourier transform infrared spectroscopy (FTIR) was employed to investigate the structural properties of Fe-MOF525 and MOF525. Clearly, TCPP (black curve) possessed the typical N–H stretching at 963 cm–1, whereas the Fe-TCPP (red curve) possessed the typical Fe-N bonds at 998 cm–1. After coordination between their carboxylic acids and Zr6 clusters, a new vibration at 1700 cm–1 owning to the C=O stretching appeared in both spectra of MOF525 (blue curve) and Fe-MOF525 (green curve), accompanied by a stronger band at 1403 cm–1 ascribed to the carboxylate (COO) symmetric stretching [35]. X-ray photoelectron spectroscopy (XPS) was applied to study elemental composition and chemical evolution. As shown in Figs. S4 and S5 (Supporting Information), the spectrum of MOF525 (black curve) exhibited the characteristic C, O, N and Zr peaks, and the weak Fe peak appeared for Fe-MOF525 (blue curve). After the adsorption of CdS QDs, the spectrum of CdS/Fe-MOF525 (red curve) showed characteristic peaks of Cd and S, demonstrating that CdS QDs were successfully modified on the Fe-MOF525.
Figure 1
Figure 1.
(a) SEM and TEM image (inset) of Fe-MOF525. (b) EDS elemental mapping of Fe-MOF525. (c) FTIR spectra of TCPP, FeTCPP, MOF525 and Fe-MOF525. (d) UV–vis DRS and (e) Tauc plots of MOF525 and Fe-MOF525. (f) Mott−Schottky plot of MOF525 and Fe-MOF525.
To evaluate the semiconductor properties and energy band structures of Fe-MOF525 and MOF525, UV–vis diffuse reflectance spectroscopy (UV–vis DRS) and Mott-Schottky (M-S) plots were employed. As shown in Fig. 1d, both spectra of Fe-MOF525 (red curve) and MOF525 (blue curve) displayed an intense Soret band centered at 423 nm in the visible-light region and four Q-bands from 500 nm to 750 nm, which could be attributed to the absorption of the porphyrin ligands [36]. Compared to MOF525, the bands of Fe-MOF525 had a slight red shift due to increased symmetry and electron delocalization after the metalation of the porphyrin ring with Fe ion [37]. The corresponding derived Tauc plots based on the Kubelka−Munk function were shown in Fig. 1e, which reveals the bandgaps of Fe-MOF525 (red curve) and MOF525 (blue curve) were 1.69 and 1.83 eV, respectively. The M–S plots were used to calculate their lowest unoccupied molecular orbital (LUMO) and highest occupied molecular orbital (HOMO). As shown in Fig. 1f, the LUMO positions of Fe-MOF525 and MOF525 were estimated to be −0.63 and −0.69 V (vs. NHE), and their corresponding HOMO positions were 1.06 and 1.14 V (vs. NHE), respectively.
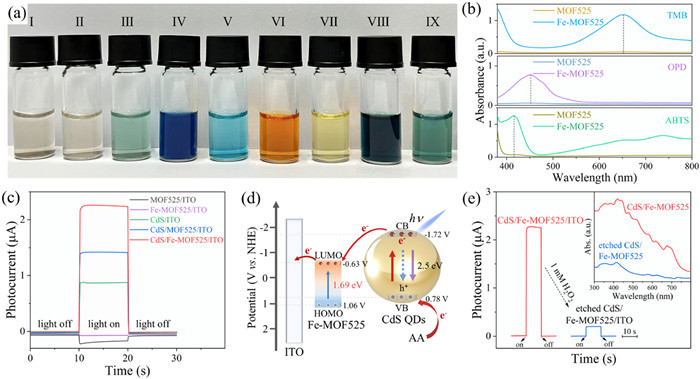
To study the HRP-mimicking activities of Fe-MOF525 and MOF525, the chromogenic assays were carried out by the catalytic oxidation of three peroxidase substrates in the presence of H2O2, including TMB, o-phenylenediamine (OPD) and 2,2′-azino-bis(3-ethylbenzothiazoline-6-sulfonic acid) (ABTS). As shown in Fig. 2a, the original light-grey Fe-MOF525 (Ⅰ) did not change after the addition of H2O2 (Ⅱ) and changed to light blue-green after the addition of TMB (Ⅲ). However, the co-addition of H2O2 and TMB led to the significant color change to dark blue (Ⅳ), indicating its good HRP-mimicking activities, which was superior to that of MOF525 (Ⅴ) in the same condition. Similar phenomena were observed in OPD (Ⅵ and Ⅶ) and ABTS (Ⅷ and Ⅸ) assays, i.e., Fe-MOF525 could catalyze H2O2 to oxidate OPD and ABTS into darker colors (Ⅵ and Ⅷ) than those of MOF525 (Ⅶ and Ⅸ). As shown in Fig. 2b, the chromogenic solutions were studied by UV–vis absorption spectroscopy, and the Fe-MOF525-catalyzed products displayed intense absorbance at 652 nm for oxTMB (blue curve), 452 nm for OPD (purple curve) and 416 nm for ABTS (green curve), respectively.
Figure 2
Figure 2.
(a) Optical images of Fe-MOF525 (Ⅰ), Fe-MOF525/H2O2 (Ⅱ), Fe-MOF525/TMB (Ⅲ), Fe-MOF525/TMB/H2O2 (Ⅳ), MOF525/TMB/H2O2 (Ⅴ), Fe-MOF525/OPD/H2O2 (Ⅵ), MOF525/OPD/H2O2 (Ⅶ), Fe-MOF525/ABTS/H2O2 (Ⅷ), MOF525/ABTS/H2O2 (Ⅸ). (b) UV–vis spectra of TMB, OPD and ABTS oxidation by MOF525 and Fe-MOF525. (c) PEC responses of the MOF525/ITO, Fe-MOF525/ITO, CdS/ITO, CdS/MOF525/ITO and CdS/Fe-MOF525/ITO. (d) Charge transfer routes upon light illumination. (e) PEC responses and UV–vis DRS (inset) of the CdS/Fe-MOF525/ITO before and after etching with 1 mmol/L H2O2 at 37 ℃ for 2 h.
Subsequently, the photoelectric properties were evaluated in 10 mmol/L phosphate-buffered saline (PBS) with 0.1 mol/L ascorbic acid (AA) upon transient 450 nm illumination (15.4 mW/cm2). As shown in Fig. 2c, the Fe-MOF525/ITO (purple curve) and MOF525/ITO (black curve) generated cathodic photocurrents of −18 and −113 nA, respectively, while the photocurrent of CdS/ITO (green curve) was 0.9 µA. Significantly, the photocurrent of CdS/Fe-MOF525/ITO (red curve) was increased to 2.3 µA, which was higher than 1.4 µA of CdS/MOF525/ITO (blue curve), indicating the superior photoresponse of CdS/Fe-MOF525/ITO PG. As presented in Fig. 2d, a typical type-Ⅱ heterojunction between Fe-MOF525 and CdS QDs was formed. Under light illumination, the photoinduced electrons of CdS QDs were excited from the valence band (VB, 0.78 V vs. NHE) to the conduction band (CB, −1.72 V vs. NHE) [38], transferring to the LUMO of Fe-MOF525 and then to the ITO. Furthermore, as shown in Fig. S6 (Supporting information), the CdS/Fe-MOF525/ITO exhibited reproducible anodic signals, suggesting its good photoresponse stability and reproducibility with a relative standard deviation of 1.2%. Moreover, the electrochemical impedance spectroscopy (EIS) Nyquist plots of the CdS/Fe-MOF525/ITO PG before and after light illumination were investigated in Fig. S7 (Supporting information), the diameter of the semicircle of the CdS/Fe-MOF525/ITO decreased after light illumination, indicating the good charge-transfer ability between electrolyte and PG.
To verify the HRP-mimic enzymatic etching by Fe-MOF525 in the presence of H2O2, the PEC responses of the CdS/Fe-MOF525/ITO before and after etching were recorded. As shown in Fig. 2e, upon the presence of 1 mmol/L H2O2, a photocurrent response of 0.2 µA was measured at the etched CdS/Fe-MOF525/ITO (blue curve), which was significantly lower than 2.3 µA of the pristine CdS/Fe-MOF525/ITO (red curve). UV–vis DRS and atomic absorption spectrum (AAS) were employed to confirm the etching mechanism. As shown in Fig. 2e inset, the intensity of UV–vis DRS was remarkably reduced after 1 mmol/L H2O2 etching. Simultaneously, the etched solution was detected by AAS, as presented in Tables S1 and S2 (Supporting information), the Cd2+ ions of 4.59 mg/L was detected in the etched solution. Together these results not only validated the successful etching of CdS QDs but also revealed the etching-induced formation of sulfate anions and Cd2+ cations [39].
The fabrication process of the transistor was displayed in Fig. S8 (Supporting information) and its performance was tested by gating with an Ag/AgCl electrode [40,41]. As presented in Fig. S9 (Supporting information), the IDS decreased significantly with increased gate voltage from 0 to 0.7 V, indicating the gate voltage-dependent regulation capability. The overlapped curves revealed good stability of the PEDOT:PSS channel during long-term sequential test. Fig. S10 (Supporting information) displayed the corresponding output characteristic curves with the gate voltage varying from 0 V to 0.6 V, indicating the gate voltage-controlled responses of IDS. As shown in Fig. S11 (Supporting information), the IDS responded rapidly to specific pulsed gate voltage with no obvious decay during 10 cycles, suggesting the channel's reversibility and good operational stability [42,43].
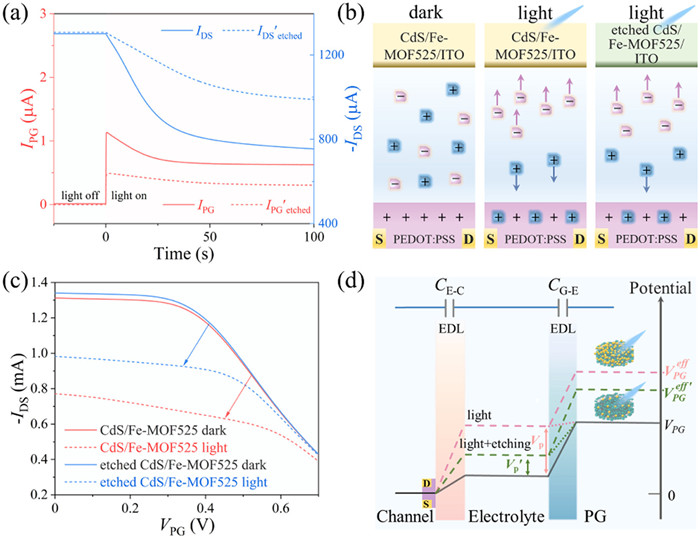
Next, the CdS/Fe-MOF525/ITO PG was combined with the PEDOT:PSS channel to construct the proposed OPECT. By connecting to an immunosandwich complexation in a 96-well plate, the biologically produced H2O2 from the GOx label was then directed for the etching on the CdS/Fe-MOF525/ITO. Corresponding to the AFP of 10 pg/mL, the altered IPG and IDS of OPECT were recorded as shown in Fig. 3a. The IPG of 13 nA was obtained in the dark, which suddenly enhanced to 1.14 µA and gradually decreased to 0.63 µA under light illumination (solid red curve). Accordingly, the −IDS of 1300 µA was steadily reduced to 754 µA (solid blue curve). After etching, the IPG promptly increased to 0.49 µA and then stabilized at 0.3 µA under light illumination (dotted red curve), while the corresponding −IDS of 1310 µA was reduced to 990 µA (dotted blue curve). The calculated current gain (ΔIDS/ΔIPG) of OPECT after light illumination was 600. The operation rationale could be explained by the VPG-dependent volumetric ionic injection of the polymeric channel. As illustrated in Fig. 3b, the polymeric channel maintained its good conductivity state in the dark by the oxidized PEDOT+. Under light illumination, the positive VPG would drive the cations into the channel and anions toward the PG, which generated the reduced PEDOT0, rendering decreased channel conductivity and IDS. After etching, the inferior VPG could only drive fewer cations into the channel, leading to a smaller ΔIDS response.
Figure 3
Figure 3.
(a) Time-dependent IPG and IDS signals of the CdS/Fe-MOF525/ITO PG gated OPECT device before and after etching (corresponding to 10 pg/mL of AFP). (b) Operation rationale of the proposed OPECT device under light illumination. (c) Transfer curves of the CdS/Fe-MOF525/ITO PG gated OPECT device before and after etching. (d) Potential distribution of the proposed OPECT device under light illumination. The test was conducted in 10 mmol/L PBS with 0.1 mol/L AA under 450 nm illumination and VDS = 0.05 V.
The transfer characteristics before and after etching were further studied to unveil the gating capability. As shown in Fig. 3c in the dark, the OPECT exhibited similar transfer characteristics before etching (solid red curve) and after etching (solid blue curve). Upon light illumination, the pristine CdS/Fe-MOF525/ITO PG (dotted red curve) presented a much obvious negative movement than that of the etched one (dotted blue curve). As shown in Fig. 3d, such a gating effect was due to the corresponding interfacial potential distribution. Generally, the applied potential of VPG was distributed at the electric double layers of two interfaces (PG/E and C/E), which could be referred to as corresponding capacitors of CPG and CC, respectively [44]. In the absence of light, the potential drop in CC was VC = VPG/(1 + γ) (γ = CC/CPG), and it would be switched to VPG/(1 + γ) + VP under light illumination [45]. The actual effective PG voltage VPGeff could be calculated by the following equation (Eq. 1):
(1)
After etching, lower VP′ and thus lower VPGeff′ were produced, causing an inferior VC and thus a minor shift of the transfer curve.
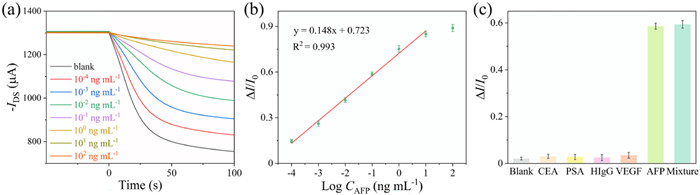
The proposed OPECT was then employed to detect AFP because the IDS response was correlated with the AFP-dependent generation of H2O2 and thus the etching effect. As shown in Fig. 4a, the IDS step values decreased gradually with the increase of AFP concentrations, demonstrating the generation of more H2O2 and thus lower VP′. The ΔIDS calculated by the difference in IDS step with and without light illumination and the as-derived calibration curve was displayed in Fig. 4b with an expansive linear range from 0.1 pg/mL to 10 ng/mL. The corresponding linearity of the fitting curve was expressed as ΔIDS/I0 = 0.148*log CAFP + 0.723 (R2 = 0.993), and the resulting detection limit was achieved to 24 fg/mL (S/N = 3), which was significantly lower than that of many recent AFP biosensors (Table S3 in Supporting information). The selectivity was evaluated against several interferents, i.e., 100 pg/mL of carcinoembryonic antigen (CEA), prostate specific antigen (PSA), human immunoglobulin G (HIgG), vascular endothelial growth factor (VEGF), and their mixture. As shown in Fig. 4c, only the target AFP or their mixed specimen could cause apparent responses, suggesting the good specificity of the OPECT detection.
Figure 4
Figure 4.
(a) The time-dependent IDS responses toward different concentrations of AFP. (b) As-derived calibration curve. (c) Selectivity toward 100 pg/mL AFP against interfering samples of 100 pg/mL CEA, PSA, HIgG, and VEGF and their mixture.
In summary, iron-porphyrin MOFs was explored as bifunctional photo-gating module and horseradish peroxidase-mimicking nanozyme for innovative OPECT biodetection. Serving simultaneously as semiconductor and sensing element, the representative Fe-MOF525 could not only facilitate the light absorption for modulation of the channel but also initiate the enzymatic etching in the presence of H2O2. By linking with GOx-labeled sandwich immunorecognition, the OPECT system was applied to detect AFP as the model target. The light illumination upon the CdS/Fe-MOF525/ITO PG after etching would produce inferior VPG, which could alter the charge-transfer resistance of the device, resulting in the inhibited IDS value depending on the AFP level. The as-developed OPECT achieved high-performance AFP detection in terms of an expansive linear range from 0.1 pg/mL to 10 ng/mL and a detection limit of 24 fg/mL. This work developed a bifunctional iron-porphyrin MOFs gated OPECT, which is envisioned to inspire more interest in exploring the diverse nanozymes toward novel optoelectronics and bioelectronics.
Declaration of competing interest
The authors declare that they have no known competing financial interests or personal relationships that could have appeared to influence the work reported in this paper.
This research was financially supported by the National Natural Science Foundation of China (Nos. 22034003, 22374066), the Fundamental Research Funds for the Central Universities (No. 2022300285), the Excellent Research Program of Nanjing University (No. ZYJH004), State Key Laboratory of Analytical Chemistry for Life Science (No. 5431ZZXM2203).
Supplementary materials
Supplementary material associated with this article can be found, in the online version, at doi:10.1016/j.cclet.2024.110080.
Scheme 1
(a) Synthetic scheme of Fe-MOF525 with photoresponsibility and peroxidase-mimicking properties. (b) Fabrication procedure of CdS/Fe-MOF525/ITO PG. (c) Structure of the proposed OPECT device. (d) H2O2-assisted etching of CdS QDs by Fe-MOF525.
Figure 1
(a) SEM and TEM image (inset) of Fe-MOF525. (b) EDS elemental mapping of Fe-MOF525. (c) FTIR spectra of TCPP, FeTCPP, MOF525 and Fe-MOF525. (d) UV–vis DRS and (e) Tauc plots of MOF525 and Fe-MOF525. (f) Mott−Schottky plot of MOF525 and Fe-MOF525.
Figure 2
(a) Optical images of Fe-MOF525 (Ⅰ), Fe-MOF525/H2O2 (Ⅱ), Fe-MOF525/TMB (Ⅲ), Fe-MOF525/TMB/H2O2 (Ⅳ), MOF525/TMB/H2O2 (Ⅴ), Fe-MOF525/OPD/H2O2 (Ⅵ), MOF525/OPD/H2O2 (Ⅶ), Fe-MOF525/ABTS/H2O2 (Ⅷ), MOF525/ABTS/H2O2 (Ⅸ). (b) UV–vis spectra of TMB, OPD and ABTS oxidation by MOF525 and Fe-MOF525. (c) PEC responses of the MOF525/ITO, Fe-MOF525/ITO, CdS/ITO, CdS/MOF525/ITO and CdS/Fe-MOF525/ITO. (d) Charge transfer routes upon light illumination. (e) PEC responses and UV–vis DRS (inset) of the CdS/Fe-MOF525/ITO before and after etching with 1 mmol/L H2O2 at 37 ℃ for 2 h.
Figure 3
(a) Time-dependent IPG and IDS signals of the CdS/Fe-MOF525/ITO PG gated OPECT device before and after etching (corresponding to 10 pg/mL of AFP). (b) Operation rationale of the proposed OPECT device under light illumination. (c) Transfer curves of the CdS/Fe-MOF525/ITO PG gated OPECT device before and after etching. (d) Potential distribution of the proposed OPECT device under light illumination. The test was conducted in 10 mmol/L PBS with 0.1 mol/L AA under 450 nm illumination and VDS = 0.05 V.
Figure 4
(a) The time-dependent IDS responses toward different concentrations of AFP. (b) As-derived calibration curve. (c) Selectivity toward 100 pg/mL AFP against interfering samples of 100 pg/mL CEA, PSA, HIgG, and VEGF and their mixture.

 DownLoad:

 下载:
下载:


