Figure 1.
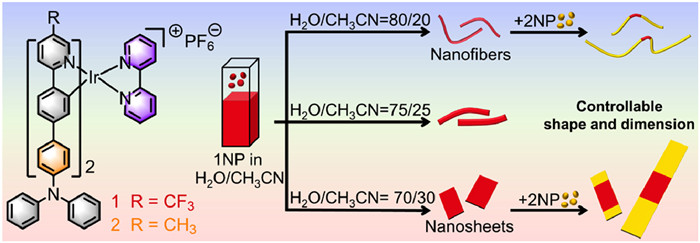
Chemical structures of Ir(Ⅲ) complexes 1 and 2. Cartoon representation of the solvent-dependent self-assembly behavior of 1, and the 2–1–2 block heterostructures with controllable shape and dimension.
Shape/dimension-controllable organic heterostructures from one monomer pair
Yan Chen , Xinnan Wang , Yifan Lin , Chun Liu

Organic heterostructures, as a class of promising and fascinating structures, are fertile ground for discovering novel functions [1-5]. Among them, supramolecular block copolymers (BCPs) constructed from small molecules have always been attractive [6-8]. In recent years, the electron/energy transport properties of organic heterostructures have been successfully applied in many fields such as energy conversion [9-13], catalysis [14], and different types of optoelectronic circuits [15-19]. Some awesome studies have shown that the shapes and dimensions of block heterostructures directly affected their final performances [20-23]. Therefore, precise control of block heterostructures at the nano/microscale is essential [24]. Currently, crystallization-driven self-assembly (CDSA) [25-27] and living supramolecular polymerization (LSP) [28-30] have provided powerful tools for constructing organic heterostructures. However, block microstructures built from the same monomer pair usually represent specific shapes and dimensions. Unless monomers are replaced, the construction of block heterostructures with controllable shape/dimension from the same monomer pair remains a formidable challenge. Thus, the development of effective shape/dimension control strategies may facilitate breakthroughs of organic heterojunctions.
It has been established that the delicate balance between cooperative or competitive interactions between monomers is the key to controlling the outcome of self-assembly [31-35]. However, the influence of the solvation effect remains mysterious in the context of complex energy landscapes [36-38]. This understanding is especially necessary in aqueous media, given the inspiration from the self-assembly process in living systems. As recently reported by Ogi's group [39] and Fernández's group [40], their results have demonstrated the influence of solute-solvent effects on the conformation of hydrophilic chains as well as the pathway complexity. For ionic metal complexes, Che's group observed chirality transfer caused by changes in solvent components in aqueous media [41]. Yam's group studied the effects of different solvent systems on self-assembly results [42]. Our group is committed to the study of self-assembly of Ir(Ⅲ) complexes in aqueous media [43-47]. Recently, our group and Che's group have realized the preparation of 1D three-component multiblock copolymers in aqueous media [48]. These interesting results motivate us to develop novel strategies to control the morphology of heterostructures. Thus, the unexpected solvent component-dependent self-assembly of Ir(Ⅲ) complex 1 was discovered. By applying the influence of solvation effects to the construction of heterostructures, block microstructures with tunable shapes and sizes were constructed, which is crucial for the development of block heterostructures.
Specifically, by fine-tuning the ratio of H2O/CH3CN (Fig. 1), the assemblies exhibited a change in morphology from nanofibers (1NF) to nanosheets (1NS). Fig. S2 (Supporting information) demonstrates that cations are arranged along the length via π-π clamp interactions, while the hexafluorophosphate anions are distributed around the cations to balance the charge and fix the cations. Therefore, we hypothesized that the degree of hydration of anions might affect their ability to fix cations. Just as too much water in cement cannot fix bricks, the anions with a higher degree of hydration cannot effectively fix cations, which eventually leads to the formation of 1D 1NF, while 2D 1NS are formed at the lower degree of hydration. More importantly, the heterogeneous nucleation-elongation of 2 was completed smoothly by using 1NF and 1NS as seeds, respectively. Finally, dual control on the length and width of BCPs was realized successfully. This work is an important advance towards the challenge of fabricating block heterostructures with controllable morphologies.
The time-dependent UV–vis absorption spectra show that complex 1 could rapidly reach self-assembly equilibrium within 3 min when the H2O/CH3CN ratios were 70/30 and 75/25 (Figs. 2a and b), respectively. Under the above solvent composition, it can be seen from the spectra that the thermodynamic species are all transformed from nanoparticles 1NP, accompanied by a huge change in the absorption spectrum. For example, when H2O/CH3CN is 70/30, the absorbance of the long-wave band increases, and a new absorption peak is formed at 462 nm. When H2O/CH3CN reaches 80/20 (Fig. 2c), self-assembly will reach equilibrium more slowly, and the absorption spectra are accompanied by an increase in absorbance at 450 nm and a change in peak shape. The corresponding time-dependent emission spectra also demonstrate the self-assembly process, accompanied by a gradual enhancement of emission (Fig. S3 in Supporting information).
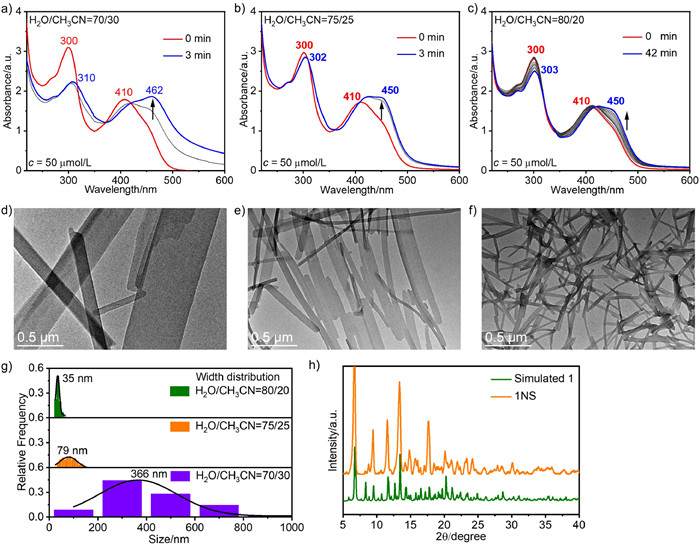
Subsequently, the morphologies of the assemblies in the self-assembly process were studied (Figs. 2d-f). TEM images sampled at different times confirmed the conversion process of 1NP to 1NS or 1NF when H2O/CH3CN were 70/30, 75/25, and 80/20 (Figs. S4-S6 in Supporting information), respectively. The results show that 1 can self-assemble into 2D nanosheets 1NS with an average width of 366 nm and 1D nanofibers 1NF with an average width of 35 nm at 70% and 80% water content, respectively (Fig. 2g).
The average width of the assemblies formed at 75% water content was 79 nm. This interesting phenomenon reminds us of the relationship between the width of the assemblies and the solvent composition. A higher proportion of water results in a narrower width of 1NF, thus it is reasonable to assume that a higher proportion of water would lead to a higher degree of hydration of the anion. This leads to a weakened ability of anions to bind cations, while the π-π interactions between cations are less affected by this, which eventually leads to a tendency towards the formation of NF with increasing water content. This hypothesis is also consistent with our previous results that the length direction of NS/NF is attracted by π-π interactions and the width direction is attracted by electrostatic interactions between anions and cations [48]. Powder X-ray diffraction (PXRD) patterns of 1NS match well with the simulated from the crystal data of 1, indicating that the self-assembly mode of 1 in 1NS is similar to that of the corresponding crystal (Fig. 2h).
As one of the most promising composite functional materials, the synthesis of supramolecular BCPs has been an exciting and essential research topic. According to the shape complementarity proposed by Würthner's group [6,49], monomer 2 was selected for block copolymerization with 1. Firstly, the construction of 1D nanofibrous BCPs was carried out (see Supporting information for details on preparing 1NF). Keeping the H2O/CH3CN ratio at 80:20, 2NP have a sufficiently long lag time (Fig. S7a in Supporting information, at least 100 min). The addition of 1NF to 2NP at different volume ratios at the 6th minute resulted in an instantaneous elongation without a lag time as clearly illustrated by time-dependent UV–vis absorption spectra (Fig. 3a and Fig. S7, [1NF]/[2NP] = 1:1, 1:3, and 1:5, v/v, [1]+[2] = 50 µmol/L). The change in absorbance at 385 nm demonstrates a prolonged transformation time with the increasing proportion of 2NP. The absence of a lag time indicates that the monomer of 2 skips the spontaneous nucleation process and directly nucleates at the end of 1NF (Fig. 3b). The above results were also verified by the time-dependent emission spectra (Fig. S8 in Supporting information). These results clearly reveal the living characters of 1NF.
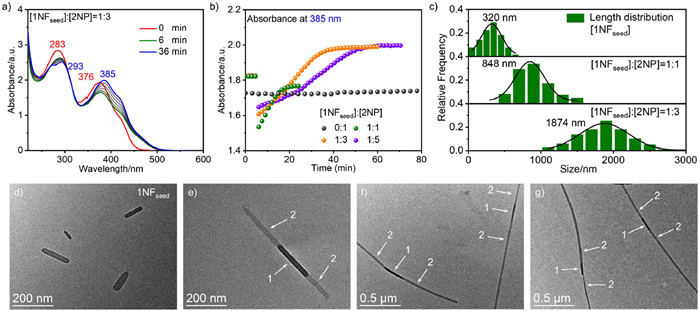
More importantly, the successful construction of block microstructure of 2–1–2 BCPs was confirmed by TEM images. Figs. 3d-g show the TEM images of 1NF and 2–1–2 BCPs formed under different [1NF]:[2NP] ratios, and their lengths are significantly longer than those of 1NF. It can be seen that the length-controllable 2–1–2 BCPs can be obtained by adjusting the ratio of [1NF]:[2NP]. The average lengths of 2–1–2 BCPs were 848 and 1874 nm when [1NF]:[2NP] were 1:1 and 1:3 (Fig. 3c), respectively. Compared with 1NF, the lengths of 2–1–2 BCPs are increased by 528 nm and 1554 nm, respectively (length increase ratio is about 1:2.9), which is also consistent with the ratio of [1NF]:[2NP]. Further increasing the ratio of [1NF]:[2NP] to 1:5 resulted in longer 2–1–2 BCPs (Fig. 3g and Fig. S9 in Supporting information). At the same time, the block microstructure of 2–1–2 BCPs can also be observed from the SEM images (Fig. S10 in Supporting information).
So far, the shape and dimension control of block heterostructures formed by the same molecular pair is still unprecedented. The development of effective strategies for dual control of the shape and dimension of the assemblies will facilitate the construction of various shape-tunable block copolymers. Inspired by the above results, we tried to construct block heterostructures with different morphologies by rationally utilizing the solvation effect. First, heterogeneous nucleation of 2 was induced by using 1NS as seeds, specifically, 1NS with a 70% water content was added to 2NP with an 80% water content. Time-dependent UV–vis absorption and emission spectra indicated that the addition of different volumes of 1NS to the solution of 2NP at the 6th minute immediately eliminated the lag time of 2NP (Fig. 4a, Figs. S11 and S12 in Supporting information, [1NS]:[2NP] = 1:1, 1:2 and 1:3, v/v). The change in absorbance at 425 nm indicated that 2 skipped the spontaneous nucleation process and proceeded directly to the continuous heterogeneous nucleation-elongation (Fig. 4b). And increasing the solution volume of 2NP could further prolong the transformation time.
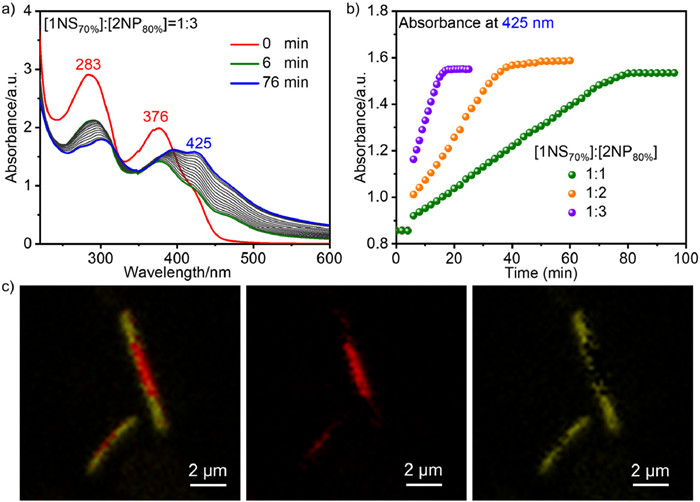
Compared with 1D BCPs with an average width of only 35 nm, the large size of the nanosheets allows us to characterize the block heterostructures by confocal laser scanning microscope (CLSM). At the same time, 1NS exhibits a single emission peak with a maximum emission wavelength of 585 nm, while 2NS has a shoulder peak with a maximum emission wavelength of 550 nm (Fig. S13 in Supporting information). The difference in emission properties of 1NS and 2NS facilitates the characterization of block heterostructures by fluorescence microscopy. As depicted in Fig. 4c and Fig. S14 (Supporting information), imaging from the red channel, yellow channel, and their merged channel clearly confirmed the sheet-like yellow-red-yellow triblock BCPs. Because 1NS and 2NS have overlapping emissions, the extended 2NS at the end of 1NS in the red channel has a weak signal, and the 2NS at both ends of the yellow channel also has a weak yellow connecting segment of 1NS.
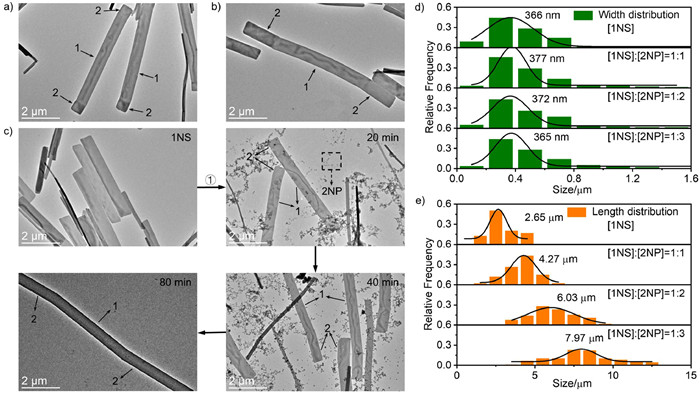
Subsequently, TEM was used to observe the heterogeneous nucleation-elongation process of 2 at the end of 1NS. It can be seen from Figs. 5a-c that compared with 1NS, 2 will grow at the end of the length direction of 1NS. The heterostructure shows a slightly bent microstructure, and the bent epitaxial component 2 will elongate with the increase of the added 2NP (Figs. S15 and S16 in Supporting information). When the ratio of [1NS]:[2NP] was 1:3, the TEM images of the heterostructures sampled at different assembly times showed more vividly the heterogeneous nucleation-elongation of 2 at the end of 1NS. As shown in Fig. 5c and Fig. S17 (Supporting information), there are only 1NS in the initial system, and ① represents the addition of 1NS to 2NP. After 20 min, a bent microstructure appeared at the end of 1NS, and NS and 2NP existed in the system at the same time. After 40 min of assembly, the bent epitaxial components became longer. After 80 min of assembly, the 2NP were completely used up and finally formed 2–1–2 type nanosheets with block heterostructures. The width and length measured and analyzed from the corresponding SEM images show that 2 is only elongated in the length direction of 1NS (Figs. 5d and e, Figs. S18 and S19 in Supporting information), and the average width is always about 370 nm. The average lengths of 2–1–2 nanosheets were 4.27, 6.03 and 7.97 µm when [1NS]:[2NP] were 1:1, 1:2 and 1:3 (Fig. 5e), respectively. Compared with 1NS, the average lengths of 2–1–2 nanosheets are increased by 1.62, 3.38, and 5.32 µm, respectively (length increase ratio is about 1:2.1:3.3), which is also consistent with the amount of 2NP. From the height measurement of the AFM results, it can be seen that the epitaxial 2NS has the same height as 1NS (Figs. S20 and S21 in Supporting information), which confirms that the heterogeneous nucleation-elongation of 2 can only be realized at the length end of 1NS and cannot grow in the height/width direction of 1NS.
In summary, 1D and 2D block heterostructures with controllable shapes and dimensions have been successfully constructed from the same molecular pair, focusing on tuning the solvent composition of H2O/CH3CN. Different volume ratios of H2O/CH3CN led to controllable morphologies from nanofibers to nanosheets. Finally, efficient control on the length and width of BCPs was realized unprecedentedly. Time-dependent UV–vis absorption and emission spectra confirmed the heterogeneous nucleation-elongation process, and each segment of the fibrous and sheet-like BCPs was clearly identified by TEM, SEM, and CLSM.
This work fully demonstrates the impact of subtle changes in solvent composition on self-assembly and its potential in building heterostructures. Therefore, the mysterious solvation effect should be given sufficient attention during the self-assembly process, which may lead to unexpected interesting results. We envision that this strategy can be generalized to construct organic heterostructures with various shapes and dimensions for diverse optoelectronic applications and charge transport, which will be an important advance towards the great challenge in fabricating organic heterostructures with controllable microstructures.
The authors declare that they have no known competing financial interests or personal relationships that could have appeared to influence the work reported in this paper.
Yan Chen: Conceptualization, Data curation, Formal analysis, Writing – original draft. Xinnan Wang: Resources. Yifan Lin: Writing – review & editing. Chun Liu: Funding acquisition, Project administration, Writing – review & editing.
The authors thank the financial support from the National Natural Science Foundation of China (No. 21978042) and the Fundamental Research Funds for the Central Universities (No. DUT22LAB610). C. L. thanks Prof. Chi-Ming Che and Dr. Qingyun Wan at The University of Hong Kong for their beneficial discussions. Y. C. thanks Dr. Zhanming Gao and Dr. Rui Cai at Dalian University of Technology for their assistance with TEM and photophysical tests.
Supplementary material associated with this article can be found, in the online version, at doi:
W. Zhang, W. Jin, T. Fukushima, et al., Science 334 (2011) 340–343. doi: 10.1126/science.1210369
B. Adelizzi, N.J. Van Zee, L.N.J. de Windt, et al., J. Am. Chem. Soc. 141 (2019) 6110–6121. doi: 10.1021/jacs.9b01089
M. Wehner, F. Würthner, Nat. Rev. Chem. 4 (2020) 38–53.
C. Zhu, J. Wu, J. Yan, et al., Adv. Fiber Mater. 5 (2023) 12–35. doi: 10.1007/s42765-022-00212-0
X. Lv, Y. Liu, J. Yu, et al., Adv. Fiber Mater. 5 (2023) 401–428. doi: 10.1007/s42765-022-00236-6
W. Wagner, M. Wehner, V. Stepanenko, et al., J. Am. Chem. Soc. 141 (2019) 12044–12054. doi: 10.1021/jacs.9b04935
Q. Wan, W.P. To, X. Chang, et al., Chem 6 (2020) 945–967. doi: 10.1016/j.chempr.2020.01.021
A. Sarkar, R. Sasmal, C. Empereur-Mot, et al., J. Am. Chem. Soc. 142 (2020) 7606–7617. doi: 10.1021/jacs.0c01822
M.J. Sun, Y.W. Zhong, J. Yao, Angew. Chem. Int. Ed. 57 (2018) 7820–7825. doi: 10.1002/anie.201803546
Y. Han, X. Zhang, Z. Ge, et al., Nat. Commun. 13 (2022) 3546. doi: 10.1038/s41467-022-31094-w
Y.J. Lv, C. Yang, Chin. Chem. Lett. 34 (2023) 108089. doi: 10.1016/j.cclet.2022.108089
T. Xiao, X. Li, L. Zhang, et al., Chin. Chem. Lett. 35 (2024) 108618. doi: 10.1016/j.cclet.2023.108618
Z. Lian, J. He, L. Liu, et al., Nat. Commun. 14 (2023) 2752. doi: 10.1038/s41467-023-38405-9
J. Tian, Y. Zhang, L. Du, et al., Nat. Chem. 12 (2020) 1150–1156. doi: 10.1038/s41557-020-00580-3
M.J. Sun, Y. Liu, W. Zeng, et al., J. Am. Chem. Soc. 141 (2019) 6157–6161. doi: 10.1021/jacs.9b02055
A.J. Sneyd, T. Fukui, D. Palecek, et al., Sci. Adv. 7 (2021) eabh4232. doi: 10.1126/sciadv.abh4232
Q. Wan, K. Xiao, Z. Li, et al., Adv. Mater. 34 (2022) e2204839. doi: 10.1002/adma.202204839
Z. Li, K. Xiao, Q. Wan, et al., Angew. Chem. Int. Ed. 62 (2023) e202216523. doi: 10.1002/anie.202216523
J. He, Y. Fan, Z. Lian, et al., Adv. Opt. Mater. 12 (2024) 2302221. doi: 10.1002/adom.202302221
H. Najafov, B. Lee, Q. Zhou, et al., Nat. Mater. 9 (2010) 938–943. doi: 10.1038/nmat2872
A.T. Haedler, K. Kreger, A. Issac, et al., Nature 523 (2015) 196–199. doi: 10.1038/nature14570
X.H. Jin, M.B. Price, J.R. Finnegan, et al., Science 360 (2018) 897–900. doi: 10.1126/science.aar8104
Q. Wan, D. Li, J. Zou, et al., Angew. Chem. Int. Ed. 61 (2022) e202114323. doi: 10.1002/anie.202114323
Q. Lv, X.D. Wang, Y. Yu, et al., Nat. Chem. 16 (2024) 201–209. doi: 10.1038/s41557-023-01364-1
X. Wang, G. Guerin, H. Wang, et al., Science 317 (2007) 644–647. doi: 10.1126/science.1141382
J.B. Gilroy, T. Gadt, G.R. Whittell, et al., Nat. Chem. 2 (2010) 566–570. doi: 10.1038/nchem.664
Z.M. Hudson, C.E. Boott, M.E. Robinson, et al., Nat. Chem. 6 (2014) 893–898. doi: 10.1038/nchem.2038
S. Ogi, K. Sugiyasu, S. Manna, et al., Nat. Chem. 6 (2014) 188–195. doi: 10.1038/nchem.1849
J. Kang, D. Miyajima, T. Mori, et al., Science 347 (2015) 646–651. doi: 10.1126/science.aaa4249
S. Ogi, V. Stepanenko, K. Sugiyasu, et al., J. Am. Chem. Soc. 137 (2015) 3300–3307. doi: 10.1021/ja511952c
M. Wehner, M.I.S. Rohr, M. Buhler, et al., J. Am. Chem. Soc. 141 (2019) 6092–6107. doi: 10.1021/jacs.9b02046
J. Matern, N. Baumer, G. Fernández, J. Am. Chem. Soc. 143 (2021) 7164–7175. doi: 10.1021/jacs.1c02384
Z. Wang, A. Hao, P. Xing, Chin. Chem. Lett. 32 (2021) 1390–1396. doi: 10.1016/j.cclet.2020.10.032
C. Naranjo, S. Adalid, R. Gomez, et al., Angew. Chem. Int. Ed. 62 (2023) e202218572. doi: 10.1002/anie.202218572
Z. Wang, C. Liu, Y. Ge, et al., Chin. Chem. Lett. 34 (2023) 109127.
P.A. Korevaar, S.J. George, A.J. Markvoort, et al., Nature 481 (2012) 492–496. doi: 10.1038/nature10720
J. Matern, Y. Dorca, L. Sánchez, et al., Angew. Chem. Int. Ed. 58 (2019) 16730–16740. doi: 10.1002/anie.201905724
M.F.J. Mabesoone, A.R.A. Palmans, E.W. Meijer, J. Am. Chem. Soc. 142 (2020) 19781–19798. doi: 10.1021/jacs.0c09293
N. Fukaya, S. Ogi, H. Sotome, et al., J. Am. Chem. Soc. 144 (2022) 22479–22492. doi: 10.1021/jacs.2c07299
L. Borsdorf, L. Herkert, N. Baumer, et al., J. Am. Chem. Soc. 145 (2023) 8882–8895. doi: 10.1021/jacs.2c12442
Q. Wan, X.S. Xiao, W.P. To, et al., Angew. Chem. Int. Ed. 57 (2018) 17189–17193. doi: 10.1002/anie.201811943
H.L. Au-Yeung, S.Y.L. Leung, V.W.W. Yam, CCS Chem. 1 (2019) 464–475. doi: 10.31635/ccschem.019.20190041
Y. Chen, L. Zhang, L. Wang, et al., Mater. Chem. Front. 5 (2021) 7808–7816. doi: 10.1039/d1qm01012c
Y. Chen, Z. Gao, L. Wang, et al., ACS Appl. Polym. Mater. 4 (2022) 1055–1065. doi: 10.3390/rs14051055
Y. Chen, Y. Shi, Z. Gao, et al., Angew. Chem. Int. Ed. 62 (2023) e202302581. doi: 10.1002/anie.202302581
Y. Lin, Y. Chen, R. Cai, et al., Mater. Chem. Front. 7 (2023) 5915–5923. doi: 10.1039/d3qm00797a
Y. Chen, C. Liu, ChemPlusChem 89 (2024) e202300623.
Y. Chen, Q. Wan, Y. Shi, et al., Angew. Chem. Int. Ed. 62 (2023) e202312844. doi: 10.1002/anie.202312844
W. Wagner, M. Wehner, V. Stepanenko, et al., CCS Chem. 1 (2019) 598–613. doi: 10.31635/ccschem.019.20190061

Figure 1 Chemical structures of Ir(Ⅲ) complexes 1 and 2. Cartoon representation of the solvent-dependent self-assembly behavior of 1, and the 2–1–2 block heterostructures with controllable shape and dimension.

Figure 2 Time-dependent UV–vis absorption spectra of 1 in H2O/CH3CN (70:30 for (a), 75:25 for (b) and 80:20 for (c), v/v) at 50 µmol/L, 293 K. TEM images of 1NS and 1NF in H2O/CH3CN (70:30 for (d), 75:25 for (e) and 80:20 for (f), v/v) at 50 µmol/L. (g) Width distribution analysis of 1NS and 1NF. (h) PXRD diffraction patterns of 1 and 1NS obtained by centrifugation.

Figure 3 (a) Time-dependent UV–vis absorption spectra observed upon mixing 1NFseed and 2NP under [1NFseed]:[2NP] = 1:3 (v/v, in H2O/CH3CN = 80:20, v/v, [1]+[2] = 50 µmol/L). (b) Time-dependent absorbance change at 385 nm after adding 1NFseed to 2NP under [1NFseed]:[2NP] = 0:1, 1:1, 1:3, and 1:5. (c) Length distribution analysis of 1NFseed and [1NFseed]:[2NP] = 1:1 and 1:3, v/v, respectively. (d) TEM image of 1NFseed. TEM images of the 2–1–2 under [1NFseed]:[2NP] = 1:1 (e), 1:3 (f) and 1:5 (g), the white arrows indicate the different components.

Figure 4 (a) Time-dependent UV–vis absorption spectra observed upon mixing 1NS and 2NP under [1NS]:[2NP] = 1:3 (v/v, [1]+[2] = 50 µmol/L), 1NS with H2O/CH3CN = 70:30 and 2NP with H2O/CH3CN = 80:20. (b) Time-dependent absorbance change at 425 nm after adding 1NS to 2NP under [1NS]:[2NP] = 1:1, 1:2, and 1:3. (c) Confocal images of the sheet-like 2–1–2 under [1NS]:[2NP] = 1:3. From left to right: merged channel, red channel, and yellow channel.

Figure 5 TEM images of nanosheet-like 2–1–2 under [1NS]:[2NP] = 1:1 (a) and 1:2 (b), v/v. (c) TEM images of 2 assembled at the end of 1NS. ① Add 1NS to 2NP at a ratio of [1NS]:[2NP] = 1:3, then TEM samples were prepared from the mixed solution after standing for 20 min, 40 min and 80 min. Width (d) and length (e) distribution analysis of 1NS and [1NS]:[2NP] = 1:1, 1:2 and 1:3, v/v, respectively.

 扫一扫看文章

扫一扫关注我们
 DownLoad:
 下载:
下载: