Institute of Fundamental and Frontier Science, University of Electronic Science and Technology of China, Chengdu 611731, China
b.
Department of Materials Science and Engineering, Zhejiang University, Hangzhou 310027, China
c.
College of Materials Science & Engineering, Zhejiang University of Technology, Hangzhou 310014, China
d.
School of Chemistry and Materials Engineering, Changshu Institute of Technology, Changshu 215500, China
e.
State Key Laboratory of Electronic Thin Film and Integrated Devices, University of Electronic Science and Technology of China, Chengdu 611731, China
f.
Department of Engineering Technology, Huzhou College, Huzhou 313000, China
g.
Key Laboratory of Engineering Dielectric and Applications (Ministry of Education), School of Electrical and Electronic Engineering, Harbin University of Science and Technology, Harbin 150080, China
h.
State Key Laboratory of Photocatalysis on Energy and Environment, Fuzhou University, Fuzhou 350116, China
i.
State Key Laboratory of New Textile Materials and Advanced Processing Technologies, Wuhan Textile University, Wuhan 430200, China
Received Date:
29 January 2024 Accepted Date:
12 April 2024 Revised Date:
11 April 2024 Available Online:
15 November 2024
Abstract:
Highly active transition metal nitrides are desirable for electrocatalytic reactions, but their long-term stability is still unsatisfactory and thus limiting commercial applications. Herein, for the first time, we report a unique and universal room-temperature urea plasma method for controllable synthesis of N-doped carbon coated metal (Fe, Co, Ni, etc.) nitrides arrays electrocatalysts. The preformed metal oxides arrays can be successfully converted into metal nitrides arrays with preserved nanostructures and a thin layer of N-doped carbon (N-C) via one-step urea plasma. Typically, as a representative case, N-C@CoN nanowire arrays are illustrated and corresponding formation mechanism by plasma is proposed. Notably, the designed N-C@CoN catalysts deliver excellent electrocatalytic activity and long-term stability both in oxygen evolution reaction (OER) and urea oxidation reaction (UOR). For OER, a low overpotential (264 mV at 10 mA/cm2) and high stability (>50 h at 20 mA/cm2) are acquired. For UOR, a current density of 100 mA/cm2 is achieved at only 1.39 V and maintain over 100 h. Theoretical calculations reveal that the synergetic coupling effect of CoN and N-C can significantly facilitate the charge-transfer process, optimize adsorbed intermediates binding strength and further greatly decrease the energy barrier. This strategy provides a novel method for fabrication of N-C@ metal nitrides as highly active and stable catalysts.
With the rapid development of industrial society, electrocatalytic chemistry pervades every aspect of our lives and is playing an important role in “Carbon peak and carbon neutrality” [1,2]. Typically, electrocatalytic reactions can help to increase energy efficiency and reduce pollution. Among the various anode half-reactions, the oxygen evolution reaction (OER) is the most frequently employed, despite its challenges of high theoretical potential and sluggish reaction kinetics [3]. Additionally, the urea oxidation reaction (UOR) serves as an alternative anode reaction with relatively low theoretical potential that can also facilitate wastewater treatment; however, it is also hampered by slow kinetics [4]. Therefore, highly active catalysts with long service life are highly desirable to optimize reaction pathways and reaction rate, and thereby boosting efficiency and modulating catalytic products [5]. Noble metal-based materials are working as the state-of-the-art catalysts in general, but their large-scale applications are seriously limited by scarcity [6]. Given all that, alternative catalysts including carbon materials [7], transition metal alloys [8], metal carbides/nitrides/chalcogenides [9], have been developed with tremendous efforts to design and construct high efficient and stable electrocatalysts.
Of the explored candidates, transition metal nitrides (TMNs) have attracted great attention in the field of electrocatalysis, such as hydrogen evolution reaction [10], OER [11,12], oxygen reduction reaction [13], UOR [4], because of their excellent catalytic activity, good electrical conductivity [9,14]. However, TMNs catalysts still surfer from a common problem, namely, unfavorable stability under atmospheric environment and harsh operation conditions, leading to decayed catalytic activities and short life [15]. To address this problem, doping and coating are two popular ways [16]. Especially, armed active materials with a protective thin layer is a general and facile strategy to protect from structure collapse and phase transformation. To date, lots of coating materials such as metal compounds, and carbon have been reported as outer shell materials to suppress the unfavorable phase transformation and side reactions [17]. Among them, carbon materials have been proven to be the best candidates due to their superior chemical stability and high electronic conductivity [18]. Specifically, Bao's group proposed a concept that some unique electrons from the encapsulated metal core can penetrate through the carbon shell layer to stimulate a catalytic reaction on the outermost surface of the carbon layer [19]. This effect is beneficial to design and fabricate advanced metal nitrides for various catalytic reactions under harsh conditions [20]. Meanwhile, the carbon layer has been aptly termed as “chain mail” for catalysts [21]. For instance, Bao and co-workers presented an approach to encapsulate FeNi binary metal nanoalloy in ultrathin graphene layers to achieve enhanced electrical performance and OER activity on the graphene surface [22]. In addition, Yuan et al. found that compared with pure carbon, the nitrogen-doped carbon not only serves as the conductive protection network, but also promote the density of electrons in the Fermi level to endow Co4N@NC-700 with a low OER overpotential of 257 mV at 10 mA/cm2 [23]. However, till now, most of TMNs have been synthesized via an annealing method in ammonia atmosphere with long duration (≥1 h) and high temperature (≥400 ℃) [13]. These fabrication processes are tedious with high energy consumption and pollution. Moreover, their carbon shells or matrixes come from carbonized organics, whose thickness is uncontrollable. Therefore, it is urgent to develop a controllable and efficient synthetic strategy to produce TMNs with tailored N-doped carbon.
Over the past decades, plasma emerges as a new powerful method to fabricate metal compounds with high efficiency, controllable microstructure and tunable electronic structure [10]. Previously, our group employed a N2 plasma method to obtain metal nitrides at room temperature in 1 min [11]. Qiu et al. reported a SF6 plasma method to construct an artificial SEI layer consisting of LiF and Li2S on Li metal [24]. Nevertheless, all the reported works focus on gas plasma (such as N2) to prepare pure metal compounds, and there is no report on solid-source plasma for synthesis of carbon@metal nitrides and their application in electrocatalytic field is still awaiting to be studied.
In this work, we report a new room-temperature solid-source urea plasma method, which is a powerful and burgeoning tool for fabrication of N-doped carbon@metal nitride arrays. In our case, the preformed metal oxides can be rapidly converted into corresponding nitrides with a thin N-doped carbon coating by one-step plasma process. Our method can accomplish two tasks with only one effort in just a few minutes at room temperature and the morphologies of preformed metal oxides precursors can be well preserved. Representative examples including N—C@FexN, N—C@CoN and N—C@Ni3N are prepared, demonstrating its generality and universality, and also offering the possibility for fast and efficient synthesis of metal nitrides with high stability and good electrochemical performance. Taking the N—C@CoN arrays for example, it is verified with greatly enhanced OER and UOR performance. It shows a low overpotential of 264 mV at 10 mA/cm2 for OER in 1 mol/L KOH. Notably, the N—C@CoN can be stably cycled for 50 h at 20 mA/cm2 with only 8% degradation, much better than that of uncoated cobalt nitride prepared via NH3 annealed (14% degradation for 30 h). Moreover, the N—C@CoN also shows excellent UOR catalytic performance. A current density of 100 mA/cm2 can be achieved at only 1.39 V and maintain over 100 h. The enhanced electrocatalytic performance is due to activated sites by plasma and favorable electronic structure of cobalt nitride as well as the protective effect of N—C layer. Theoretical calculations indicate that the CoN and N—C coupling effect can significantly benefit the charge-transfer process. The d-band center of Co atoms in the N—C@CoN system shifts to a higher energy compared to the bare CoN system, indicating that the N—C@CoN and adsorbed intermediates occupy less space, resulting in the optimization of their binding strength and catalytic activity. Moreover, N—C@CoN exhibits the lowest energy barrier for the rate-determining step of OER and has a high adsorption capacity for both H2O and urea molecules. This characteristic feature promotes the succeeding oxidation reactions of H2O and urea. Our work opens up a novel room-temperature urea plasma method for high-efficiency construction of stable metal nitrides with high activity and long cycling life.
As shown in Scheme S1 (Supporting information), N-doped carbon@metal nitride (N—C@TMN) arrays are prepared by urea plasma technology at room temperature, using a plasma system (Hangzhou Zhehe Co., Ltd.) (Fig. S1 in Supporting information). In our case, transition metal oxide (TMO) arrays prepared by hydrothermal methods are chosen as the preformed precursors. Then, urea vapor is utilized as the plasma source to realize the conversion from TMO to N—C@TMN arrays. When exposed in the urea plasma, TMOs (e.g., Co3O4, NiO, and Fe2O3) can be converted to corresponding TMNs with a thin layer of N-doped carbon layer as a protective shell (e.g., N—C@CoN, N—C@Ni3N, and N—C@FexN), which endows the obtained TMNs a highly chemical stability under harsh conditions. In particular, it should be noted that our urea plasma method is very efficient and the whole reaction can be finished in several minutes at room temperature. Compared to traditional nitridization methods, our method is much greener without tedious processes and NH3 gas. Furthermore, the array morphology of N—C@TMN can be well preserved after nitridization and N—C coating. To illustrate the formation mechanism and enhanced performance more clearly, N—C@CoN nanowire arrays are selected as the representative case to further demonstrate the corresponding formation mechanism and study their electrochemical performance as the OER and UOR catalysts.
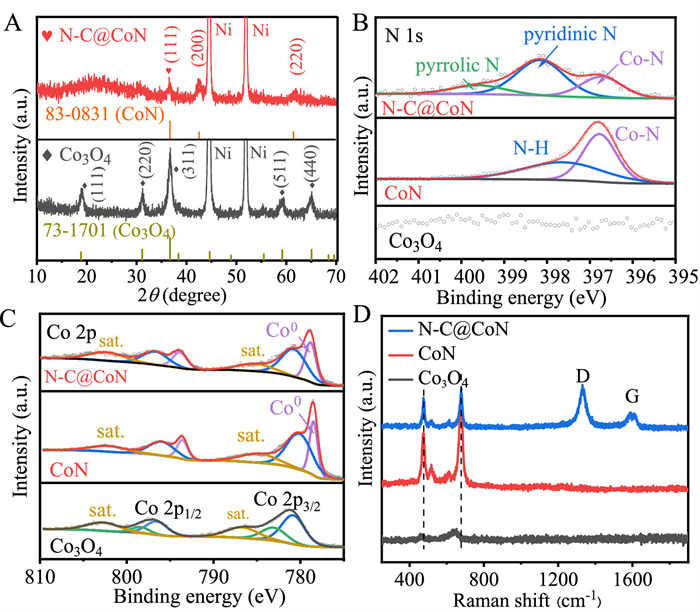
The phases of samples before and after urea plasma reaction were characterized by X-ray diffraction (XRD). As shown in Fig. 1A, the characteristic diffraction peaks corresponding to the preformed Co3O4 (JCPDS No. 73–1701) vanish and new peaks indexed to CoN (JCPDS No. 83–0831) are detected, verifying the successful conversion from Co3O4 to CoN after urea plasma treatment in 3 min. It is noteworthy that the Co3O4 nanowires treated under urea plasma at room temperature for different time (1, 3, 5 and 7 min) are denoted as urea-1, urea-3, urea-5 and urea-7, respectively. The phase and composition of these samples were studied by XRD (Fig. S2 in Supporting information). For the urea-1, the peaks for both Co3O4 and CoN coexist. For the urea-3, only peaks indexed to CoN remain (red line). Beyond that, there is no difference among urea-3, urea-5 and urea-7, implying that pure CoN nanowire arrays are formed after only 3 min via urea plasma treatment. In the following discussion, all CoN samples are obtained via urea plasma with 3 min. For comparison, we also prepared CoN phase via NH3 annealing treatment for 2 h at 500 ℃ (Fig. S3 in Supporting information).
Figure 1
Figure 1.
Phase and composition characterization. (A) XRD patterns of Co3O4 and N—C@CoN. (B) N 1s XPS spectra of Co3O4, CoN and N—C@CoN. (C) Co 2p XPS spectra of Co3O4, CoN and N—C@CoN. (D) Raman spectra of Co3O4, CoN and N—C@CoN.
Furthermore, the surface chemical compositions were investigated via X-ray photoelectron spectroscopy (XPS). After urea plasma treatment, the XPS survey spectra (Fig. S4 in Supporting information) shows that the peak of N element appears and the peak intensity of C 1s becomes stronger while that of O 1s becomes weaker. The high-resolution N 1s spectrum of N—C@CoN in Fig. 1B reveals the existence of Co-N (396.7 eV), pyridinic N (398.2 eV), and pyrrolic N (399.6 eV), reconfirming the successful fabrication of CoN and introduction of N-doped carbon [25]. Furthermore, the quantity of graphitic nitrogen relates to the temperature when N-doped carbon forms. Therefore, the amount of graphitic nitrogen significantly decreases when synthesized at lower temperature [26]. Urea plasma treatment is carried out at room temperature, which results in a minimum content of graphitic nitrogen at 401 eV, hence not identified in this result. On contrary, no C—N peaks (pyridinic N and pyrrolic N) are detected in the sample of CoN—NH3 annealing and no any peaks are detected in the sample of Co3O4 in this rang. Fig. 1C presents the high-resolution spectra of Co 2p for Co3O4, CoN and N—C@CoN, respectively. For Co3O4, the binding energies of 781.2 and 783.6 eV correspond to Co(Ⅲ) 2p3/2 and Co(Ⅱ) 2p3/2, respectively. And the peak at 785.6 eV is attributed to the satellite peaks. For CoN and N—C@CoN, the peak at 778.8 eV corresponds to Co0, fitting nicely with the metallic Co0 in CoN [27]. The peak at 781.0 eV is attributed to Co(III)-O bonds, which are formed by the unavoidable surface oxidation when contacted with air [28]. In the high-resolution spectra of C 1s (Fig. S5A in Supporting information), the peaks of C—C, C—N, C—O and C=O bonds appear at the binding energies at 284.8, 285.5, 286.7 and 289.0 eV, respectively [14]. The C—N bond can derive from the N doping of carbon. The peaks of Co-O, H—O and adsorbed oxygen bond appear at 529.6, 531.2 and 533.0 eV in the high-resolution spectra of O 1s (Fig. S5B in Supporting information), respectively. In contrast, the peak at 529.6 eV, derived from Co-O resulting from inevitable surface oxidation, decreases significantly for CoN and N—C@CoN after nitrogenization [11]. Furthermore, the research examined the N-carbon and CoN layer utilizing Raman spectra, illustrated in Fig. 1D. The CoN and N—C@CoN samples manifested typical Raman scattering peak stretching vibrations (Co−N), specifically the peaks at 475, 515 and 678 cm−1 [29]. Similarly, the ~1350 cm−1 peak, “D band”, is linked to vibrations at defects, and the 1580 cm−1 peak, "G band," indicates in-plane lattice sheets of graphitic carbon. The ID/IG value estimated the carbon's crystallinity and is commonly used as a parameter. The ratio value of urea-derived carbon is 2.2, illustrating a low graphitization where there are lots of defects (like edges, vacancies and heteroatoms) in carbon sheets, which in general is beneficial to promote the catalytic process [30].
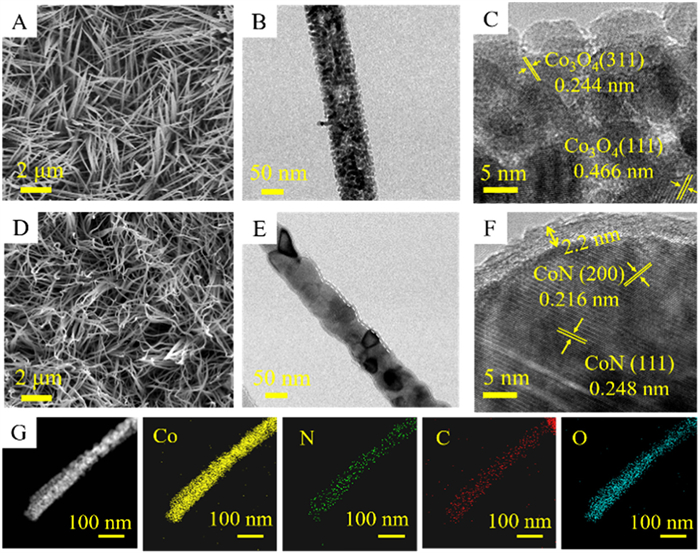
The morphologies of the pristine Co3O4 and N—C@CoN were examined using scanning electron microscopy (SEM) and transmission electron microscopy (TEM). As the images shown in Fig. 2A, the pristine Co3O4 nanowires have a diameter of 50–100 nm with an acicular morphology. After urea plasma treatment, the nanowires of N—C@CoN become curvature and entanglement (Fig. 2D). The room-temperature urea plasma process effectively preserves the morphology of the nanowire array, resulting in a relatively independent open space for the catalyst. This configuration is advantageous because it not only increases the utilization rate of the active material, but also ensures that the material is fully engaged in the reaction. From the TEM, it can be found that the Co3O4 nanowires are further composed of numbers of nanoparticles (Fig. 2B) and after urea plasma treatment, a thin carbon layer is coated on the surface of the nanowire (Fig. 2E). In high-resolution TEM image (HRTEM) (Fig. 2F), the thickness of carbon layer is around 2.2 nm and the inside lattice fringes measured to be 0.216 and 0.248 nm can be well indexed to (200) and (111) crystal planes of CoN, which is different from that of Co3O4 in Fig. 2C. And the energy-dispersive X-ray spectroscopy (EDS) elemental mapping analysis shows the Co, N, C and O elements are homogeneously distributed throughout the whole N—C@CoN nanowire (Fig. 2G). As the HRTEM images show in Fig. S6 (Supporting information), the thickness of the coated carbon layer increases with the treatment duration and the treatment N—C@CoN was successfully obtained over 3 min. Therefore, precise control of the carbon layer thickness can be achieved by adjusting the treatment time of the urea plasma. For comparison, SEM images show that the morphologies CoN nanowires via the NH3 annealing treatment become excess curvature and entanglement (Fig. S7A in Supporting information). In the HRTEM image, the inside lattice fringes measured to be 0.248 nm can also be well indexed to (111) crystal planes of CoN. But the CoN nanowires via the NH3 annealing does not have the carbon layer on the surface (Figs. S7B and C in Supporting information).
Figure 2
Figure 2.
Morphology and microstructure characterization. (A–C) SEM, TEM and HRTEM images of Co3O4. (D–F) SEM, TEM and HRTEM images of N—C@CoN. (G) EDS elemental mapping of Co, N, C, O elements in N—C@CoN.
In addition, we also successfully converted the NiO nanosheets and Fe2O3 into N—C@Ni3N and N—C@FexN via urea plasma. As shown in Fig. S8 (Supporting information), those characteristic diffraction peaks corresponding to the NiO (JCPDS No. 44–1159) and Fe2O3 (JCPDS No. 89–0599) were vanished, and these peaks indexed to Ni3N (JCPDS No. 83–0831) and FexN (JCPDS Nos. 76–0091, 72–2126 and 77–2006) were emerged verifying the successful and complete conversion of NiO and Fe2O3 to Ni3N and FexN after urea plasma treatment. Then, XPS spectra (Fig. S9 in Supporting information) shows that metallic M0 (Ni0 and Fe0) valence peaks in the nitrides (Ni3N and FexN), as well as the corresponding C—N (pyridinic N and pyrrolic N) and M-N (Ni-N and Fe-N) bonds. Thus, XPS spectra also demonstrates the successful synthesis of N—C@Ni3N and N—C@FexN. In addition, SEM images show that N—C@Ni3N nanosheets are sparser and more porous than NiO nanosheets, as well as N—C@FexN nanowires are rougher than Fe2O3 nanowires (Fig. S10 in Supporting information). HRTEM image of N—C@Ni3N shows the clear lattice fringes with an interplanar distance of 0.203 nm corresponding to (111) planes of Ni3N and the thickness of carbon layer is about 2.1 nm (Figs. S11A and B in Supporting information). The representative EDS elemental mapping analysis also shows the Co, N, C and O elements are evenly dispersed throughout the whole N—C@Ni3N nanowire (Fig. S11C in Supporting information). Therefore, based on the SEM and TEM images, we confirm the Ni3N with a N-doped carbon layer, further illustrating the feasibility of urea plasma method to fabricate N-doped carbon@metal nitride. Table S1 (Supporting information) displays the estimated content of every element in the three N—C@ metal nitride samples.
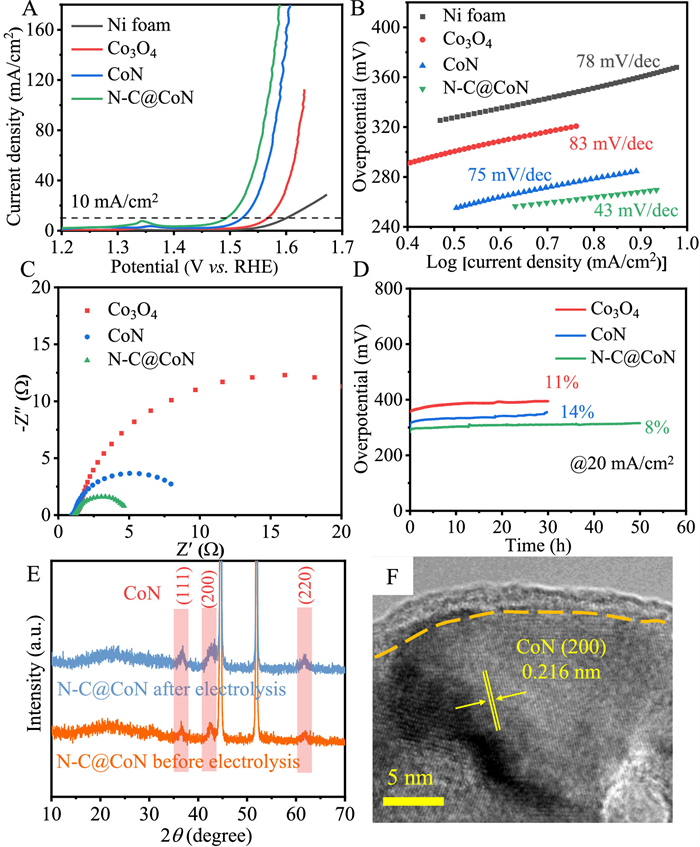
The catalytic activities of all synthesized samples for OER were evaluated in 1 mol/L KOH using a standard three-electrode system (Fig. 3). All potentials are referred to the reversible hydrogen electrode (RHE) without specification. Fig. 3A illustrates the linear sweep voltammogram (LSV) collected at 1 mV/s for all electrodes after iR correction. It can be observed that the N—C@CoN sample shows the highest catalytic activity (highest current density) throughout the potential window. The N—C@CoN sample requires an overpotential of only 264 mV to reach a current density of 10 mA/cm2 (η10), which is lower than that of Co3O4 (338 mV) and CoN (293 mV). Compared to the CoN, the enhanced activity of N—C@CoN is mainly attributed to the N-doped carbon, which can highly promote the charge transfer. Nickel foam was also measured for comparison. The effect of nickel foam on the catalytic activity is almost negligible. In addition, as mentioned above, we prepared N—C@CoN with different treatment durations, and the urea-3 sample shows the best electrochemical performance (Fig. S12 in Supporting information). Note that the sample with urea plasma treatment of less time period (1 min) and more time period (5 min and 7 min) display inferior OER performance to the urea-3 sample, on account of the inadequate nitridation and excessively thick carbon layer hindering electron penetration, respectively. The Tafel slope was used to investigate the reaction kinetics of electrodes. Compared with Ni, Co3O4 and CoN, N—C@CoN performs the lowest Tafel slope of 43 mV/dec, indicating the fastest OER reaction kinetic of N—C@CoN (Fig. 3B). This shows clearly that the N—C@CoN sample can markedly improve the catalytic activity (larger current density and faster reaction kinetics). Compared with previous literatures, N—C@CoN obtained by urea plasma surpass most of the samples in terms of OER catalysis (Table S2 in Supporting information).
Figure 3
Figure 3.
OER performance evaluation of Ni, Co3O4, CoN and N—C@CoN. (A) The iR-corrected polarization curves, (B) Tafel plots, (C) Nyquist plots recorded at 1.5 V versus RHE curves, (D) stability tests (voltage versus time), (E) the XRD patterns and (F) HRTEM image of N—C@CoN after stability testing.
The electrode kinetics was evaluated by electrochemical impedance spectroscopy (EIS). It is found that the N—C@CoN shows the smallest charge transfer resistance (Rct) in Fig. 3C. Electrochemically active surface areas (EASAs) were evaluated by applying electrochemical double layer capacitance (Cdl; Figs. S13 and S14 in Supporting information). The EASAs of each sample were in a rank of N—C@CoN (121.8 mF/cm2) > CoN (106 mF/cm2) > Co3O4 (84 mF/cm2), illustrating that there are more active sites after urea plasma treatment. The LSV curves were normalized by ECSAs to compare their intrinsic activity. It can be seen that the catalytic activity of N—C@CoN is much improved (Fig. S14D). This result directly supports that urea plasma is an effective method to design efficient OER catalysts.
Cycling stability is another essential factor in the assessment of an electrocatalyst. The stability of the Co3O4, CoN and N—C@CoN catalysts were evaluated at 20 mA/cm2 (Fig. 3D). The N—C@CoN can stably run about 50 h with just 8% increase of the overpotential. For Co3O4 and CoN catalysts, after 30 h test, their overpotential increased by 11% and 14%, respectively. In the polarization curves of Co3O4, CoN and N—C@CoN catalysts before and after OER, especially the curves of N—C@CoN nearly overlap with each other (Fig. S15 in Supporting information). Thus, N—C@CoN catalyst has more excellent stability, primarily because of its protective thin N—C layer to protect N—C@CoN from structure collapse and phase transformation.
To probe the origin of good stability, the phase and morphology stability of catalysts can also be confirmed by the XRD, HRTEM and XPS of the cycled N—C@CoN electrode. After cycling at 20 mA/cm2 for 50 h, the XRD of N—C@CoN electrode shows no significant changes (Fig. 3E). The carbon layer and the cobalt nitride are well preserved (Fig. 3F), demonstrating that N—C@CoN has a more stable crystal structure during electrolysis. The surface chemical state in CoN (NH3 annealing) and N—C@CoN before and after OER at 20 mA/cm2 were investigated via XPS (Fig. S16 in Supporting information). The signal of the metallic Co0 valence peak (778.8 eV) dramatically decreased after the OER, indicating that CoN is unstable under harsh operation conditions. On contrary, for N—C@CoN, the signal of the metallic Co0 valence peak (778.8 eV) only slightly weaker after the OER, suggesting that N—C@CoN is more tolerant to the oxidation of the OER due to the protective effect of N—C layer.
Furthermore, we have also demonstrated the OER performance of N—C@Ni3N, which outperforms the NiO (Figs. S17 and S18 in Supporting information). Therefore, higher catalytic activity of metal nitrides can be obtained after urea plasma treatment. In addition, N—C@Ni3N also shows better cycling stability than pristine Ni3N (NH3 annealing) (Figs. S19 and S20 in Supporting information). The conversion of NiO via urea plasma not only improve the OER catalytic activity but also the longtime stability.
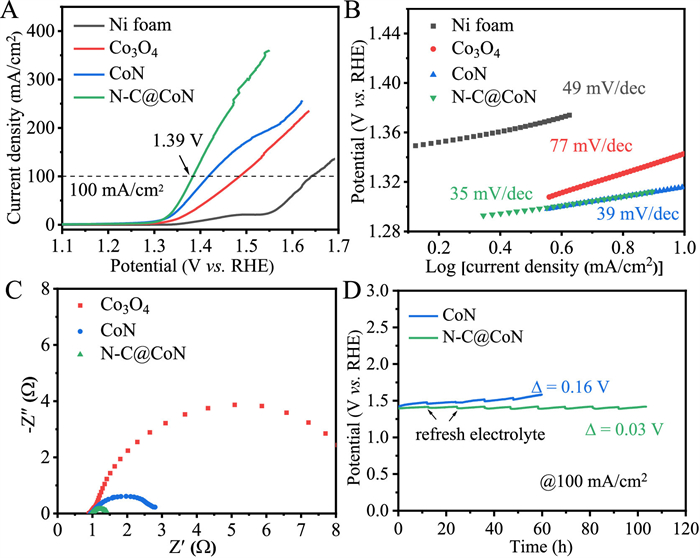
Despite the N—C@CoN showing the well performance in the area of OER, there is still space for improvement in the production of hydrogen due to high OER overpotential [31]. Anodic UOR is a simple method for lowering the energy required for hydrogen production. UOR has been considered to be a favourable prospect of energy-related applications thanks to its advantages of low-cost and relatively low thermodynamic potential (0.37 V). Moreover, urea-enriched wastewater from industrial and agriculture can be degraded simultaneously through UOR. In 1.0 mol/L KOH with 0.33 mol/L urea, the UOR performance of the samples was evaluated using the same setup of OER (Fig. 4). For comparison, the UOR performance of Ni, Co3O4, CoN and N—C@CoN also examined in Fig. 4A. In particular, among these electrodes, the N—C@CoN exhibits the lowest potentials of 1.39 V to reach 100 mA/cm2, which outperforms Ni (1.64 V), Co3O4 (1.49 V) and CoN (1.42 V) catalysts. Furthermore, the Tafel slope was utilized to study the reaction kinetics of electrodes. N—C@CoN possesses the smallest Tafel slope of 35 mV/dec, much smaller than those of Ni (49 mV/dec), Co3O4 (77 mV/dec) and CoN (39 mV/dec) (Fig. 4B), indicating a faster UOR reaction kinetics of N—C@CoN. This shows clearly that the N—C@CoN sample can significantly improve the UOR activity (larger current density and faster reaction kinetics). Our N—C@CoN nanowire arrays obtained by urea plasma treatment is superior to most of those reported samples in terms of UOR catalysis (Table S3 in Supporting information). The Rct between electrolyte and electrode was estimated by EIS to further investigate the charge transfer kinetics (Fig. 4C). As expected, the N—C@CoN because of the metallic CoN and N-doped carbon exhibits a smaller charge-transfer kinetics than those of Ni, Co3O4 and CoN, which is in accordance with the lowest Tafel slope.
Figure 4
Figure 4.
UOR performance evaluation of Ni, Co3O4, CoN and N—C@CoN. (A) The iR-corrected polarization curves, (B) Tafel plots, (C) EIS Nyquist plots recorded at 1.4 V versus RHE, and (D) stability tests.
Additionally, the ECSA of the electrocatalyst can be evaluated by the Cdl to reveal the number of active sites. (Figs. S21 and S22 in Supporting information). In comparison to the initial Co3O4 (153 mF/cm2) and CoN (165 mF/cm2), the EASA of N—C@CoN (206 mF/cm2) rises noticeably after the urea plasma treatment, as a result of the rougher surface that was attained during the urea plasma treatment. The LSV curves were normalized by ECSAs to compare the intrinsic UOR activity. It can be seen that the UOR activity of N—C@CoN is much improved by urea plasma (Fig. S22D). This reveals that urea plasma treatment improves its catalytic activity for UOR, providing a new option for designing efficient UOR catalysts. Meanwhile, we compared the UOR longtime stability of CoN and N—C@CoN at 100 mA/cm2 (Fig. 4D). The N—C@CoN runs at 100 mA/cm2 for 100 h with a potential slightly increase of only 0.03 V, however, the CoN runs for 60 h with a voltage increase of 0.16 V. Furthermore, the LSV curve responses the well-maintained activity after longtime stability test at 100 mA/cm2 (Fig. S23 in Supporting information). This reveals the well longtime stability. The good UOR performance of N—C@CoN can be ascribed to the metallic CoN species and a thin layer of N-doped carbon on its surface to protect internal CoN from corrosion.
To elucidate the universality of the urea plasma strategy for the preparation of highly active and stable catalysts, the UOR electrochemical properties of N—C@Ni3N have also been examined. In UOR, Ni3N@N—C obtained after urea plasma treatment has a better UOR activity (Figs. S24 and S25 in Supporting information). Also, Ni3N@N—C possesses superior longtime stability attributed to the protective effect of the N-doped carbon layer (Figs. S26 and S27 in Supporting information). The above proves that this work provides a facile and universal strategy for the preparation of efficient and stable transition metal nitride -based electrocatalysts.
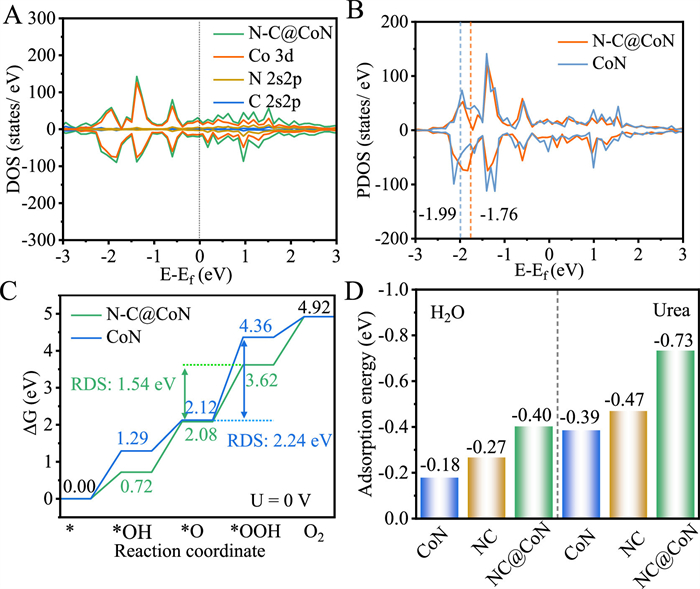
The atomistic interaction of CoN and N—C was further investigated by density functional theory (DFT) calculations based on spin polarized first principles. Based on the previous theoretical research and experimental results, the (111) specific plane was chosen as the representative surface for modelling the CoN interfacial model, and single layer N-doped graphite was used to construct the N—C@CoN interfacial heterojunction model [29]. The model structures of N—C@CoN, CoN and N—C are shown in Figs. S28 and S29 (Supporting information). Due to the effects of N—C, the Co atoms of N—C@CoN are more positively charged than bare CoN, resulting in a built-in electric field, and thus the charges can be rapidly transferred between CoN and N—C. The synergistic effects of CoN and N—C lead to an increase in electron mobility, which improves the calculation of the total density of states (DOS) (Fig. 5A). The continuous distribution of the DOS and a substantial amount of electronic states near the Fermi level indicate that N—C@CoN is in the metallic state with strong electrical conductivity indicating that N—C@CoN promotes fast electron transfer during the electrocatalytic process. Furthermore, since the OER kinetics is related to the d-orbital of transition metal active centres, the projected density of states (PDOS) of Co 3d orbitals is used to gain deeper insights into the electronic structure regulation (Fig. 5B). The d-band centre of the Co atoms in the N—C@CoN system is shifted to a higher energy of −1.76 eV compared to that in the bare CoN system (−1.99 eV) (the dotted lines indicate the d-band centre for each system). The antibonding states between the N—C@CoN and the adsorbed intermediates would be less occupied as a result of the d-band centre shift, thus optimizing their binding strength and enhancing the catalytic activity [32]. The DOS and PDOS results demonstrate the favourable role of the synergistic coupling effects of CoN and NC. Then, the N—C@CoN with facilitated charge transfer and enhanced binding strength with intermediates can significantly enhance the OER and UOR activity.
Figure 5
Figure 5.
Theoretical calculation of N—C@CoN, CoN and N—C. (A) Density of states in material N—C@CoN. (B) Projected density of states of the Co 3d orbitals from CoN and N—C@CoN. (C) The calculated free energy diagrams for the OER of CoN and N—C@CoN. (D) Water and urea adsorption energy of N—C, CoN and N—C@CoN.
The DFT calculation was also conducted to simulate the Gibbs free energy of various OER intermediates for N—C@CoN, CoN and N—C (Fig. 5C, and Fig. S30 in Supporting information). The optimized structures of the intermediates in the Gibbs free energy profiles for N—C@CoN, CoN and N—C, which base on the 4e− adsorbate evolution mechanism (*, *OH, *O and *OOH, * denotes the active sites). We noticed that N—C@CoN exhibited lower free energy for the generation of *OH, *O, and *OOH immediate than bare CoN and N—C, revealing a more favourable OER kinetics in N—C@CoN structures. For both N—C@CoN, CoN and N—C, the formation of *OOH group from *O group (step *OOH→*O) was found to be the rate-determining step (RDS) in OER. The energy barrier of RDS is calculated to be 1.54, 2.24 and 1.91 eV for N—C@CoN, CoN and N—C, respectively. The low energy barrier of RDS for N—C@CoN is favourable for optimizing the intermediate adsorption, and thus, boosting the OER catalytic activity. In Fig. 5D, the adsorption energy of H2O on N—C@CoN (−0.40 eV) surface is larger than that of CoN (−0.18 eV) surface and N—C (−0.27 eV) surface. Besides, the adsorption energy of Urea on N—C@CoN (−0.73 eV) surface is also larger than that of CoN (−0.39 eV) surface and N—C (−0.47 eV) surface. This imply that N—C@CoN can improve the adsorption capacity of H2O and urea molecules, which is conducive to the subsequent H2O and urea oxidation reaction.
In summary, we have demonstrated a powerful room-temperature solid-source urea plasma method to realize the rapid conversion of transition metal oxide precursors to N—C coated metal nitrides. Our proposed plasma method is highly efficient, safe and green, and can be used to construct stable transition metal nitride based electrocatalysts. Different metal nitrides (such as N—C@FexN, N—C@CoN and N—C@Ni3N) have been prepared via urea plasma with N and C radicals. Thin N—C shell can be simultaneously formed on metal nitride core in one-step plasma process. Owing to good electrical conductivity and protection of N—C layer, the designed N—C@CoN exhibits good OER and UOR properties with lower overpotential and better long-term life, superior to the performance in the literature and other metal nitride counterparts prepared by NH3 annealing, due to boosted electrocatalytic activity and reinforced stability. Theoretical calculations demonstrate that the CoN and N—C synergetic coupling effect greatly enhances the charge-transfer process. The d-band centre of Co atoms in the N—C@CoN system is shifted to a higher energy, optimizing their binding strength between N—C@CoN and intermediates. Moreover, N—C@CoN exhibits the lowest energy barrier for the rate-determining step in OER, and has high adsorption capacity for both H2O and urea molecules, making it favorable for H2O and urea oxidation reactions. Our work provides a novel plasma method for fabrication of carbon/metal compound composites for applications in energy conversion.
Declaration of competing interest
The authors declare that they have no known competing financial interests or personal relationships that could have appeared to influence the work reported in this paper.
Acknowledgments
This work is supported by National Natural Science Foundation of China (No. 52073252), Science and Technology Department of Zhejiang Province (No. 2023C01231), Key Research and Development Project of Science and Technology Department of Sichuan Province (No. 2022YFSY0004), Key Laboratory of Engineering Dielectrics and Its Application (Harbin University of Science and Technology), Ministry of Education (No. KFM 202202), and the Open Project Program of the State Key Laboratory of New textile Materials and Advanced Processing Technologies (No. FZ2021009).
Supplementary materials
Supplementary material associated with this article can be found, in the online version, at doi:10.1016/j.cclet.2024.109887.
[1]
Z. Wang, C. Zhu, H. Tan, et al., Adv. Funct. Mater. 31 (2021) 2104735. doi: 10.1002/adfm.202104735
[2]
C. Li, H. Wang, S. Yang, et al., Chin. Sci. Bull. 67 (2022) 2950–2957. doi: 10.1360/tb-2021-1369
[3]
R. Zhang, L. Pan, B. Guo, et al., J. Am. Chem. Soc. 145 (2023) 2271–2281. doi: 10.1021/jacs.2c10515
M. Cai, Q. Zhu, X. Wang, Z. Shao, et al., Adv. Mater. 35 (2022) 2209338.
[32]
J.K. Nørskov, J. Rossmeisl, A. Logadottir, et al., J. Phys. Chem. B 108 (2004) 17886–17892. doi: 10.1021/jp047349j
Figure 1
Phase and composition characterization. (A) XRD patterns of Co3O4 and N—C@CoN. (B) N 1s XPS spectra of Co3O4, CoN and N—C@CoN. (C) Co 2p XPS spectra of Co3O4, CoN and N—C@CoN. (D) Raman spectra of Co3O4, CoN and N—C@CoN.
Figure 2
Morphology and microstructure characterization. (A–C) SEM, TEM and HRTEM images of Co3O4. (D–F) SEM, TEM and HRTEM images of N—C@CoN. (G) EDS elemental mapping of Co, N, C, O elements in N—C@CoN.
Figure 3
OER performance evaluation of Ni, Co3O4, CoN and N—C@CoN. (A) The iR-corrected polarization curves, (B) Tafel plots, (C) Nyquist plots recorded at 1.5 V versus RHE curves, (D) stability tests (voltage versus time), (E) the XRD patterns and (F) HRTEM image of N—C@CoN after stability testing.
Figure 4
UOR performance evaluation of Ni, Co3O4, CoN and N—C@CoN. (A) The iR-corrected polarization curves, (B) Tafel plots, (C) EIS Nyquist plots recorded at 1.4 V versus RHE, and (D) stability tests.
Figure 5
Theoretical calculation of N—C@CoN, CoN and N—C. (A) Density of states in material N—C@CoN. (B) Projected density of states of the Co 3d orbitals from CoN and N—C@CoN. (C) The calculated free energy diagrams for the OER of CoN and N—C@CoN. (D) Water and urea adsorption energy of N—C, CoN and N—C@CoN.

 DownLoad:

 下载:
下载:


