Scheme 1.
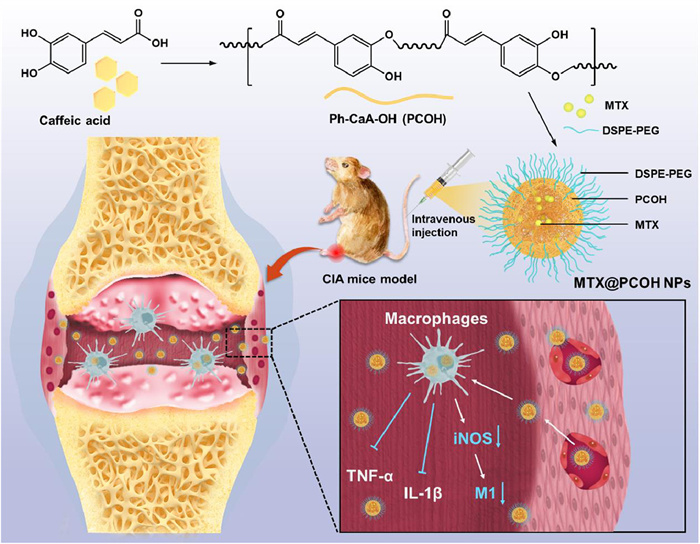
PCOH NPs and MTX@PCOH NPs in rheumatoid arthritis treatment.
Coffee-derived self-anti-inflammatory polymer as drug nanocarrier for enhanced rheumatoid arthritis treatment
Chunlei Dai , Liying Wang , Xinru You , Yi Zhao , Zhong Cao , Jun Wu

Rheumatoid arthritis (RA) is a common chronic autoimmune inflammatory disease afflicting 0.5%–1% of the global population [1]. Individuals with RA often endure a spectrum of symptoms including bone erosion, cartilage damage and systemic inflammation with severe pain [1,2]. In severe cases, it may lead to loss of joint functionality and disability, which significantly influences normal work and life. Macrophages play a crucial role in the pathogenesis of RA, especially activated pro-inflammatory macrophages (M1) are participated in the development and progression of RA through the secretion of pro-inflammatory cytokines and chemokines, such as tumor necrosis factor-α (TNF-α) and interleukin-1β (IL-1β) [3,4]. Currently, the clinical management of rheumatoid arthritis is centered on mitigating joint damage and alleviating pain [5,6]. Methotrexate (MTX), a folic acid analogue, is widely employed as a first-line anti-rheumatic medication in clinical practice by curbing the accumulation of macrophage-derived pro-inflammatory factors [7]. Nonetheless, the long-term systemic use of MTX can lead to the development of treatment resistance, entailing a range of adverse effects and systemic toxicity that could potentially compromise the immune system [8,9]. Thus, targeted delivery of MTX to inflamed joints is necessary to enhance the therapeutic index and foster sustained patient tolerance.
The enhanced infiltration and retention (EPR) effect is proposed based on the ability of nanoparticles in solid tumors to exploit the leaky vascular system of tumor tissue and poor lymphatic drainage exhibiting passive targeting and sustained aggregation [10,11]. Recent studies indicate that a similar phenomenon of vascular leakage, attributable to the compromised blood-joint barrier and widened endothelial gaps, occurs in the inflamed joints of RA patients [12,13]. All of this suggests that nanotechnology-based drug delivery systems can provide powerful support for RA treatment. Therapeutic nano-delivery systems with self-bioactivity could reduce the dose required for drug therapy and possess the potential to synergize with drugs to enhance the therapeutic effect, which is one of the dynamic and burgeoning area of research within the field of nano-delivery systems [14,15]. Phenolic compounds have been extensively utilized in the preparation and construction of various nano-systems for their biological activities such as anti-inflammatory, antioxidant, immunomodulatory and antitumor activities [14,16,17]. Caffeic acid, a naturally occurring phenolic compound of plant derivation, exhibits these biological activities as well [18]. In addition, in RA treatment-related studies, caffeic acid could reduce the inflammation via inhibiting the nuclear factor-k-gene binding (NF-κB) pathway, and had shown potential in reduce edema, inflammatory cells infiltration, and destruction of cartilage and bone [19,20]. Therefore, we designed and synthesized the caffeic acid-based polyphenol polymer Ph-CaA-OH (PCOH) with promising applications for targeted delivery of anti-rheumatic drugs.
We examined the anti-inflammatory activity of PCOH in the form of nanoparticles (PCOH NPs) and the potential of PCOH NPs loaded with MTX (MTX@PCOH NPs) for RA treatment at low drug doses (2.5 mg/kg of MTX) (Scheme 1). The PCOH NPs and MTX@PCOH NPs exhibited negatively charged surface and distinct core-shell structure. In vitro, PCOH NPs inhibited pro-inflammatory factor expression and pro-inflammatory differentiation in lipopolysaccharide (LPS)-stimulated macrophages. In vivo, the PCOH NPs system rapidly aggregated within a short span of time and sustained accumulation over an extended period in inflamed joints of collagen induced-arthritis (CIA) mice. Besides, CIA mice treated with low-dose MTX@PCOH NPs showed no significant swelling or redness, and greatly reduced the extent of bone erosion and cartilage damage, while free MTX showed little effect. In summary, MTX@PCOH NPs enhanced RA therapeutic effects at low therapeutic drug doses, providing an important clinical reference for effectively delaying the development of RA while reducing the side effects of antirheumatic drugs.
First, we synthesized PCOH using a one-step polycondensation method (Fig. 1A). Briefly, caffeic acid and sulfoxide chloride were reacted in a 1:1.1 ratio in cold pyridine and allowed to react for 1 h. Then the reaction was terminated with the addition of deionized water and washed several times, followed by lyophilization to obtain a brownish-yellow powder.
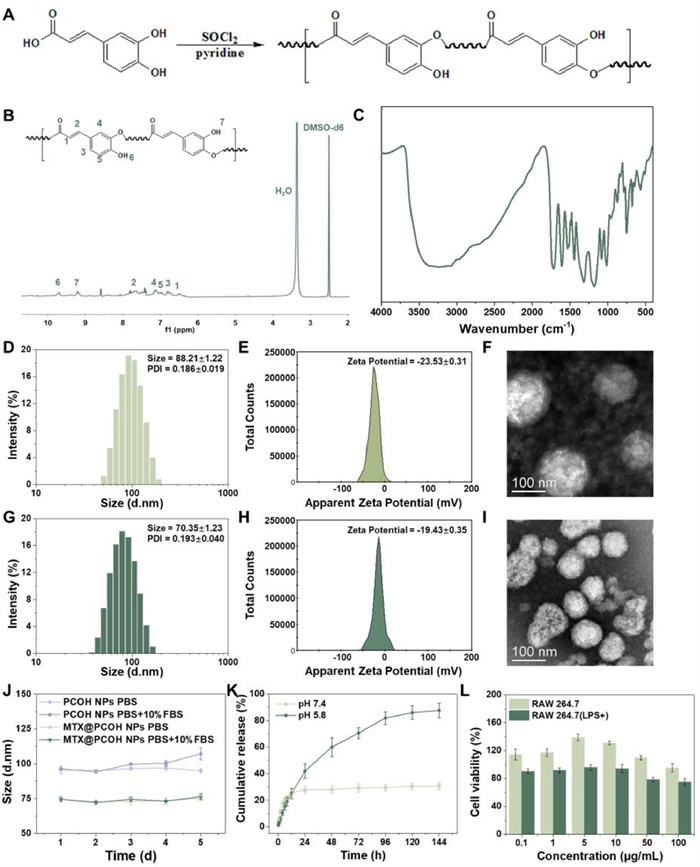
The results of nuclear magnetic hydrogen spectroscopy (1H NMR) and Fourier transform infrared spectroscopy (FT-IR) conformed the correct structure of the prepared PCOH (Figs. 1B and C). In the 1H NMR results, the hydrogen proton peak of caffeic acid carboxylic acid at 12.10 ppm disappeared, the hydroxyl hydrogen proton peak (9.21,9.65 ppm) and the hydrogen proton peak (6.75–7.17 ppm) on the benzene ring of the polymer unit structure broadened. The FT-IR spectra of PCOH showed the shift of the ester bond C═O absorption peak to high frequencies (1718 cm−1), the stretching vibration absorption peak of -C-O—C- appeared at 1319 and 1182 cm−1.
Next, we used a reproducible nanoprecipitation method to construct MTX@PCOH NPs, and evaluated and optimized the physicochemical properties such as size and surface charge of the nanoparticles for better applicability in the treatment of rheumatoid arthritis. The 1,2-distearoy-sn‑glycero-3-phosphoethanola-mine-N-[methoxy(polyethylene glycol)−2000] (DSPE-PEG 2K) is often used as a stabilizer in drug delivery systems to improve stability and prolong blood circulation time. Therefore, we selected DSPE-PEG 2K as a stabilizer for further system construction and optimization.
Dynamic light scattering (DLS) analysis revealed that the diameter of PCOH NPs was ~88 nm, with a surface potential of −23.5 mV (Figs. 1D and E). Upon MTX loading, there was a change in particle size and potential (~70 nm, −19.43 mV) (Figs. 1G and H). The negative potential is advantageous for the prolonged and stable circulation of MTX@PCOH NPs within the circulatory system, and the smaller size facilitates vascular leakage and nanoparticle aggregation at the site of inflammation. In addition, the transmission electron microscope (TEM) images of MTX@PCOH NPs demonstrated that the nanoparticles retained their subspherical shape and distinct core-shell structure even after drug loading (Figs. 1F and I). And the high performance liquid chromatography (HPLC) analysis indicated a drug loading capacity of ~6.6% at a PCOH/MTX mass ratio of 3:1, which was subsequently used for further investigation of therapeutic efficacy (Table S1 in Supporting information).
Further, we simulated normal physiological environment (pH 7.4) and inflammatory weak acidic environment (pH 5.8) in vitro for testing the release behavior of nanoparticles. Under the normal physiological environment, the DLS results for five consecutive days showed that the particle size of PCOH NPs and MTX@PCOH NPs were stable and the cumulative release of MTX did not exceed 30% during the test period (Figs. 1J and K). In the inflammatory weak acid environment, MTX could achieve a long time slow and controlled release effect and the final cumulative release was close to 90% (Fig. 1K). These results indicated that the PCOH system was stable and possessed potential for slow and controlled release in an inflammatory environment.
In addition, PCOH NPs showed a slight inhibitory effect on LPS-stimulated RAW264.7(+) cells compared with normal RAW264.7 cells (Fig. 1L). Meanwhile, MTX@PCOH NPs showed a higher cell killing effect on RAW264.7(+) cells compared to free MTX (Fig. S1 in Supporting information). The above results suggested that PCOH NPs might possess potential cellular regulatory effects on M1 macrophages.
The cellular uptake capacity of nanoparticles and the intracellular distribution characteristics of nanoparticles influence the intracellular action performance of drugs. We used coumarin-6 (C6) as a fluorescent probe instead of a drug to study the uptake behavior of PCOH NPs in RAW264.7(+) cells. Flow cytometry results indicated that C6@PCOH NPs could be efficiently taken up by RAW264.7(+) in a time-dependent manner (Figs. 2A and B). In the fluorescence images (Fig. 2C), the C6@PCOH NPs group showed stronger green fluorescence than the free C6 group at the same time points, indicating the potential of PCOH NPs to enhance the total drug uptake by the cells.
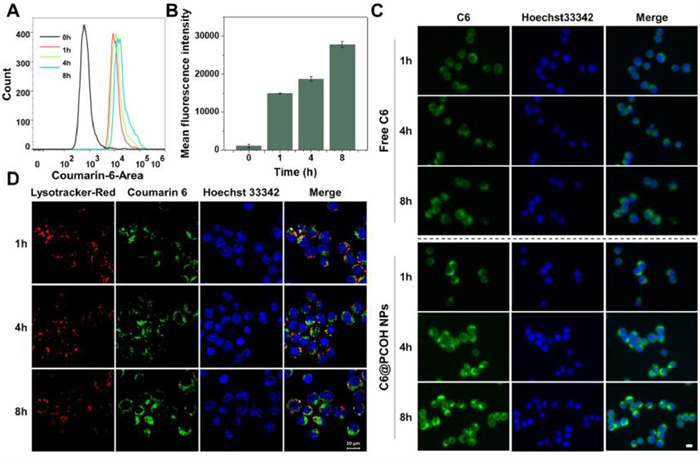
To further investigate the temporal distribution characteristics of C6@PCOH NPs in RAW264.7(+) cells, we labeled lysosomes using Lyso-Tracker Red and acquired fluorescent images with laser confocal at predetermined time points. As shown in Fig. 2D, the change in the position of C6@PCOH NPs after endocytosis by cells can be judged from the overlapping state of red fluorescence and green fluorescence. At about 1 h, C6@PCOH NPs are mainly localized in the lysosomes. With time, the green fluorescence was mainly distributed in the cytoplasm, indicating that PCOH NPs could effectively enter the cytoplasmic region to exert regulatory functions.
Macrophages are major players in the pathogenesis of RA, and the increased number of macrophages in the synovium is one of the early signs of RA [21]. Inflammatory cytokines serve as crucial mediators and drivers in the development of RA, with M1 macrophages being a prominent source of these cytokines [3,22]. Hence, inhibition of M1 differentiation of macrophages, enhancement of M1 macrophage killing and suppression of inflammatory cytokine secretion are effective ways to alleviate RA [23,24].
LPS is a commonly used endotoxin to induce macrophage differentiation towards type I and enhance the expression of inflammatory cytokines. In order to replicate the inflammatory environment, we stimulated macrophages with LPS in vitro. The current studies showed that intracellular reactive oxygen species (ROS) levels were significantly increased following the transition of macrophages to type I [25]. We used 2′, 7′-dichlorodihydrofluorescein diacetate (DCFH-DA) as a probe to detect ROS changes in macrophages under co-incubation with LPS and different concentrations of PCOH NPs. The results revealed a substantial increase in macrophage ROS levels following LPS stimulation, and the addition of PCOH NPs could obviously reduce the effects caused by LPS (Figs. 3A and B).
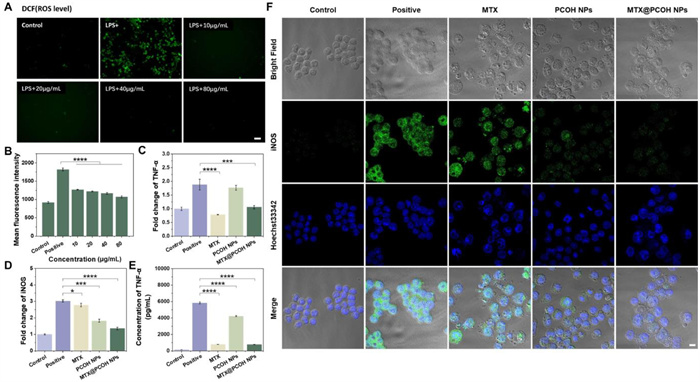
We further validated the levels of inflammatory cytokine expression in LPS-stimulated macrophages after treatment with free MTX, MTX@PCOH NPs and PCOH NPs. Activated monocytes and macrophages in RA can release various pro-inflammatory factors and chemokines, leading to persistent inflammatory damage and recruitment of inflammatory cells, thereby exacerbating the disease [26]. Inhibition of the overproduction and downstream regulation of these pro-inflammatory factors is one of the preferred therapeutic modalities for RA [26,27]. The quantitative real time polymerase chain reaction (qRT-PCR) results showed that both free MTX, PCOH NPs and MTX@PCOH NPs significantly reduced LPS-induced TNF-α and IL-1β transcription levels (Fig. 3C, Fig. S2 in Supporting information). Similarly, in the enzyme linked immunosorbent assay (ELISA) results, the free MTX and MTX@PCOH NPs groups exhibited an obvious reduction in LPS-induced TNF-α secretion (Fig. 3E). Inducible nitric oxide synthase (iNOS), one of the major hallmarks of M1 macrophages, can be induced by proinflammatory cytokines and exacerbate the inflammatory response by producing high concentrations of stressful nitric oxide [28]. PCOH NPs could effectively reduce iNOS transcription levels, as shown in the Fig. 3D. Immunofluorescence results demonstrated that PCOH NPs could effectively reduce iNOS expression and inhibit macrophage differentiation toward pro-inflammatory type I (Fig. 3F).
Taken together with the previous findings, MTX@PCOH NPs can exert anti-inflammatory effects simultaneously from both inhibiting macrophage type I differentiation and reducing the expression of TNF-α and IL-1β, laying the foundation for reducing the level of focal inflammation and tissue damage in RA treatment.
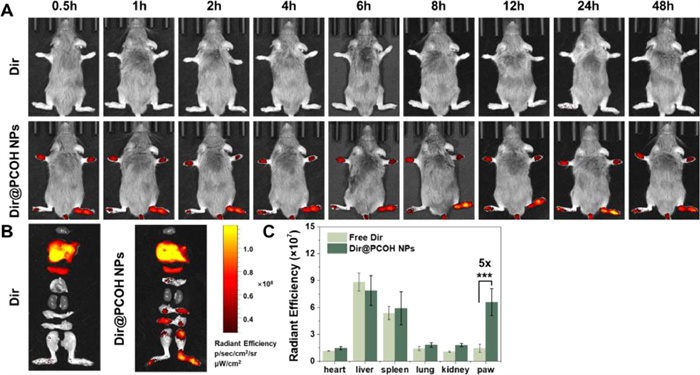
Considering the potential for improved efficacy, we investigated the in vivo distribution of MTX@PCOH NPs in inflamed joints of CIA mice following intravenous injection. To monitor this distribution, we utilized living-image analysis at various time points after tail vein administration of free Dir or Dir@PCOH NPs. Throughout the experiment, free Dir did not exhibit a significant fluorescence signal (Fig. 4A). In contrast, Dir@PCOH NPs appeared fluorescence signal at the ankle joint within 0.5 h of injection and showed a gradual enhancement. At 48 h, although the signal decayed slightly, a high level of fluorescence was still observed. The quantification of fluorescence at 48 h revealed that the average fluorescence intensity of Dir@PCOH NPs in the paws was five times higher than that of free Dir (Figs. 4B and C). The above results suggested that PCOH NPs could selectively aggregate in inflamed joints, which not only increased the local concentration of drug aggregation in inflamed joints, but also possessed significant advantages in reducing systemic side effects.
In vivo, we investigated the therapeutic effects of PCOH NPs and MTX@PCOH NPs in CIA mice according to the experimental schedule shown in Fig. 5A. All animal experimental procedures were performed in accordance with protocols approved by the Animal Care Committee of Sun Yat-sen University (Application No. 2021001136). We induced RA via two immunizations on day 0 and day 21, respectively. After 27 days of primary immunization, we randomly divided the mice into five groups and injected with 0.9% NaCl, free MTX, PCOH NPs, free MTX + PCOH NPs and MTX@PCOH NPs in the tail vein at predetermined time points (dose equivalence of 2.5 mg/kg of MTX for all groups). RA severity was scored according to the clinical scoring system and ankle thickness was measured with vernier calipers every three days starting from day 27. Besides, we used the remission rate (RR), the ratio of mice with a total clinical score of no more than 4, to characterize the efficacy of each treatment group.
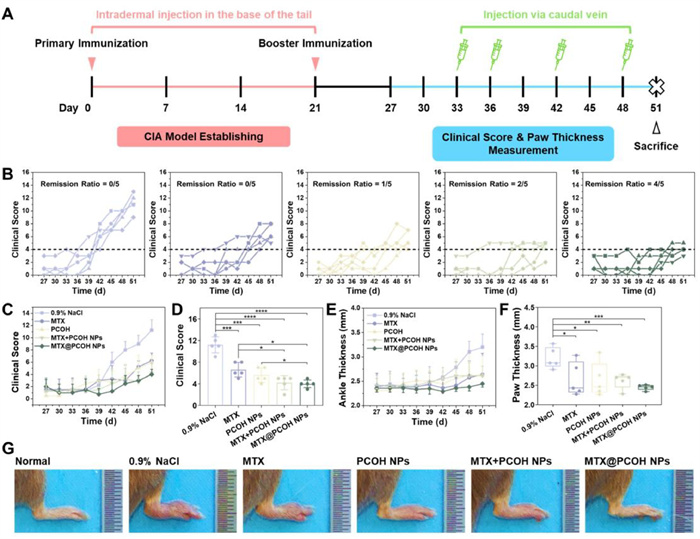
The RA progressed more rapidly in 0.9% NaCl group, as all mice in this group exhibited clinical scores higher than 6 on day 45, whereas the clinical scores increased at a slower rate in all other groups of mice (Figs. 5B and C). On day 51, mice injected with MTX + PCOH NPs and MTX@PCOH NPs displayed significantly lower clinical scores compared to those injected with equal doses of free MTX (Fig. 5D). Notably, the RR value of mice in the MTX@PCOH NPs group was about 4/5, higher than that in the MTX + PCOH NPs group (RR: ~2/5) and the PCOH NPs group (RR: ~1/5), while free MTX only delayed disease progression (RR value of about 0/5). To assess the progression of RA, ankle joint thickness was measured during the treatment period. Ankle joint swelling increased rapidly from day 42 in 0.9% NaCl group, while ankle thickness did not change significantly in the MTX@PCOH NPs group until the end of the experiment, and slight swelling was observed in all other groups (Fig. 5E). At the experimental endpoint, the ankle joint thickness did not exceed 3.0 mm in both free MTX + PCOH NPs and MTX@PCOH NPs mice, whereas it was only one-fifth in mice injected with 0.9% NaCl (Fig. 5F). Consistent with the previous results, the paws of the 0.9% NaCl-treated mice in Fig. 5G appeared extremely red and swollen, while the paws of the MTX@PCOH NPs-treated mice appeared indistinguishable from normal mice, and the other groups showed mild reddening and slight swelling. Taken together, these evaluations suggested that MTX@PCOH NPs achieved better palliative efficacy at low doses of 2.5 mg/kg MTX treatment.
Following the sacrifice of the mice, we used hematoxylin-eosin (H & E) and safranin-O to stain sections of mice joint tissues. As shown in the H & E results, the mice injected with 0.9% NaCl showed severe bone destruction, while the free MTX + PCOH NPs and MTX@PCOH NPs groups were not significantly different from normal mice (Fig. 6A, above). The safranin-O staining of cartilage showed significant loss of proteoglycans in 0.9% NaCl group, free MTX group and PCOH NPs group mice, indicating severe cartilage degradation and loss (Fig. 6A, below). In contrast, the cartilage of mice injected with MTX@PCOH NPs closely resembled that of normal mice, suggesting that MTX@PCOH NPs effectively prevented cartilage damage during the development of RA.
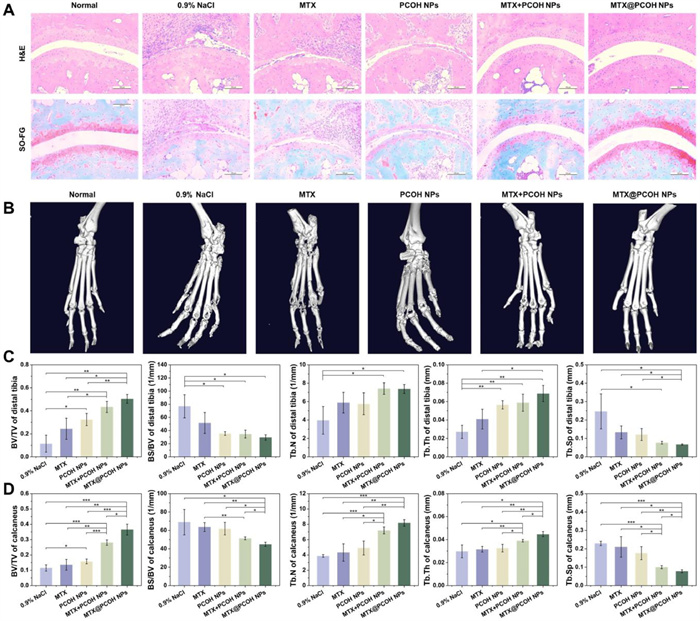
Moreover, we conducted further assessment of the therapeutic effect using micro-computed tomography (Micro-CT) imaging to evaluate bone erosion in the clinical diagnosis of RA. As shown in the reconstructed CT images, both ankle and finger joints of the mice in the 0.9% NaCl group suffered severe bone erosion (Fig. 6B). In comparison, MTX@PCOH NPs exhibited a more pronounced inhibition of bone erosion compared to the other groups. Based on the acquired CT images, we further analyzed the bone volume fraction (BV/TV), bone surface/bone volume (BS/BV), trabecular number (Tb.N), trabecular thickness (Tb.Th) and trabecular separation (Tb.Sp) of distal tibia and calcaneus (Figs. 6C and D). The BV/TV and BS/BV values showed that MTX and PCOH NPs alone were not effective in reducing bone loss during RA development, and bone volume was higher in mice treated with MTX@PCOH NPs than treated with MTX + PCOH NPs. Additionally, the MTX@PCOH NPs group demonstrated a greater number of bone trabeculae, thicker trabecular thickness, and lower trabecular separation compared to the other groups. These findings indicated a significantly slower relative rate of bone catabolism, tighter bone mass, and greater weighing capacity during the time of RA development.
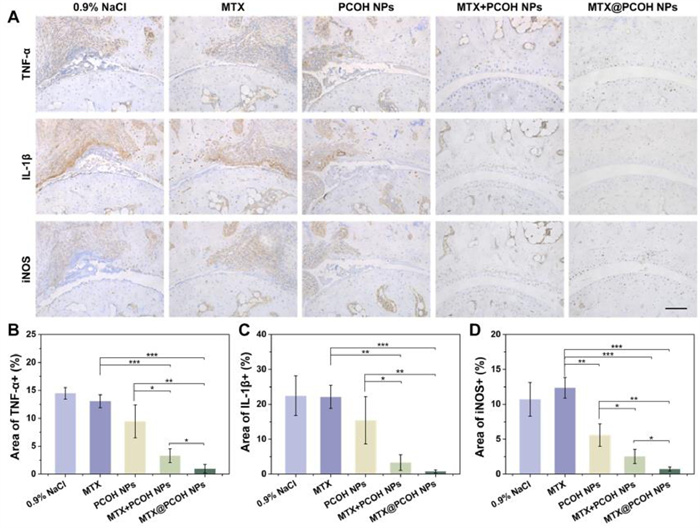
Further, we assessed the level of inflammation in mouse joint tissues by immunohistochemical staining of THF-α, IL-1β and iNOS on bone tissue sections (Fig. 7). Compared to those injected with 0.9% NaCl, the mice injected with free MTX did not demonstrate a notable anti-inflammatory impact, while mice treated with MTX@PCOH NPs showed significantly lower levels of pro-inflammatory cytokines. Notably, iNOS was significantly reduced in the PCOH NPs group compared to the MTX group, aligning with the findings of previous in vitro experiments. In summary, the treatment of CIA mice with MTX@PCOH NPs resulted in a remarkable suppression of disease severity and PCOH NPs were equally effective in reducing iNOS expression at inflammatory sites in vivo, which correlated with the efficient accumulation of nanoparticles at inflammatory sites.
In addition, we also evaluated the biosafety of PCOH NPs and MTX@PCOH NPs. The results of hemolysis assay (Fig. S3 in Supporting information) showed that when the concentration of PCOH NPs reached 4.0 mg/mL, the hemolysis rate was less than 5%, indicating that it would not cause obvious hemolytic reaction and could circulate in the blood for extended periods. During the treatment period, the body weight of mice in all groups was basically unchanged, and the H & E sections of major organs did not show obvious tissue damage, and there was no obvious difference in blood biochemical indexes between groups (Figs. S4–S6 in Supporting information). These findings indicated that the treatment of PCOH NPs and MTX@PCOH NPs were relatively safe without marked side effects. Consequently, PCOH NPs exhibit an excellent safety profile and hold great potential for clinical applications.
In conclusion, we had successfully validated the anti-inflammatory activities of caffeic acid-based polyphenol polymer PCOH and investigated the effects of low-dose MTX@PCOH NPs in the treatment of RA. MTX@PCOH NPs were prepared using a simple nanoprecipitation method, allowing for efficient loading of MTX and exhibiting good stability and slow-release properties. In vitro, PCOH NPs could inhibit iNOS expression and suppress pro-inflammatory differentiation in LPS-stimulated macrophages, leading to a reduction in the secretion of pro-inflammatory cytokine TNF-α. In CIA mice, PCOH NPs could be aggregated within a short time and retained for a long time in inflamed joints. In addition, at a low therapeutic concentration of MTX (2.5 mg/kg), free MTX did not demonstrate significant therapeutic effects. In contrast, mice treated with MTX@PCOH NPs did not show significant bone erosion and were effectively protected against cartilage loss. In conclusion, PCOH NPs could significantly reduce the required dose of MTX for RA treatment and effectively delay the progression of RA without causing noticeable side effects.
The authors declare that they have no known competing financial interests or personal relationships that could have appeared to influence the work reported in this paper.
Chunlei Dai: Writing – original draft, Project administration, Methodology, Investigation, Formal analysis, Data curation. Liying Wang: Methodology, Data curation. Xinru You: Funding acquisition, Data curation. Yi Zhao: Writing – review & editing, Supervision, Resources, Funding acquisition, Conceptualization. Zhong Cao: Writing – review & editing, Supervision, Resources, Funding acquisition, Conceptualization. Jun Wu: Writing – review & editing, Supervision, Resources, Funding acquisition, Conceptualization.
This work was supported by the National Natural Science Foundation of China (No. 52173150), the Guangzhou Science and Technology Program City University Joint Funding Project (No. 2023A03J0001) to Jun Wu. This work was supported by the National Natural Science Foundation of China (No. 52073313), Shenzhen Science and Technology Program (No. KCXFZ 202002011010232), Longhua District Science and Innovation Commission Project Grants of Shenzhen (No. 10162A20221027B1FA526) to Zhong Cao. This work was supported by Shenzhen Medical Research Fund (No. A2303010), National Natural Science Foundation of China (No. 82204287), and Fundamental Research Funds for the Central Universities, Sun Yat-sen University (No. 87000-31670001) to Yi Zhao. This work was supported by Guangdong Basic and Applied Basic Research Foundation (No. 2023A1515220126) to Xinru You.
Supplementary material associated with this article can be found, in the online version, at doi:
F.W. David L Scott, Tom W J Huizinga, Lancet 376 (2010) 1094–1108.
J.S. Smolen, D. Aletaha, A. Barton, et al., Nat. Rev. Dis. Primers 4 (2018) 18001.
I.B. McInnes, C.D. Buckley, J.D. Isaacs, Nat. Rev. Rheumatol. 12 (2016) 63–68. doi: 10.1038/nrrheum.2015.171
J. Zhao, X. Chen, K.H. Ho, et al., Chin. Chem. Lett. 32 (2021) 66–86. doi: 10.1117/12.2586674
G.S. Firestein, I.B. McInnes, Immunity 46 (2017) 183–196.
J.S. Smolen, D. Aletaha, Nat. Rev. Rheumatol. 11 (2015) 276–289. doi: 10.1038/nrrheum.2015.8
C.S. Lau, F. Chia, L. Dans, et al., Int. J. Rheum. Dis. 22 (2019) 357–375. doi: 10.1111/1756-185x.13513
L. Liu, W. Guo, X.J. Liang, Biotechnol. J. 14 (2019) 1800024.
J.S. Smolen, R. Landewe, J. Bijlsma, et al., Ann. Rheum. Dis. 76 (2017) 960–977. doi: 10.1136/annrheumdis-2016-210715
J. Shi, P.W. Kantoff, R. Wooster, O.C. Farokhzad, Nat. Rev. Cancer 17 (2017) 20–37. doi: 10.1038/nrc.2016.108
W. Sun, Q. Hu, W. Ji, et al., Physiol. Rev. 97 (2017) 189–225. doi: 10.1152/physrev.00015.2016
I.B. McInnes, G. Schett, Lancet 389 (2017) 2328–2337.
C.D. Ochoa, T. Stevens, Am. J. Physiol. Lung Cell Mol. Physiol. 302 (2012) L275–L286. doi: 10.1152/ajplung.00215.2011
Y. Guo, Q. Sun, F.G. Wu, et al., Adv. Mater. 33 (2021) 2007356.
X. You, L. Wang, L. Wang, J. Wu, Adv. Funct. Mater. 31 (2021) 2100805.
N. Yahfoufi, N. Alsadi, M. Jambi, C. Matar, Nutrients 10 (2018) 1618. doi: 10.3390/nu10111618
Y. Zheng, X. You, S. Guan, et al., Adv. Funct. Mater. 29 (2019) 1808646.
N.N. Muhammad Abdul Kadar, F. Ahmad, S.L. Teoh, M.F. Yahaya, Molecules 26 (2021) 5490. doi: 10.3390/molecules26185490
W. Wang, W. Sun, L. Jin, Int. Immunopharmacol. 48 (2017) 61–66. doi: 10.5539/elt.v10n7p61
F. Paciello, A. Di Pino, R. Rolesi, et al., Food Chem. Toxicol. 143 (2020) 111555.
I.A. Udalova, A. Mantovani, M. Feldmann, Nat. Rev. Rheumatol. 12 (2016) 472–485. doi: 10.1038/nrrheum.2016.91
L.C. Davies, S.J. Jenkins, J.E. Allen, P.R. Taylor, Nat. Immunol. 14 (2013) 986–995. doi: 10.1038/ni.2705
Y. Yang, L. Guo, Z. Wang, et al., Biomaterials 264 (2021) 120390.
Y. Song, Y. Huang, F. Zhou, et al., Chin. Chem. Lett. 33 (2022) 597–612.
E. Rendra, V. Riabov, D.M. Mossel, et al., Immunobiology 224 (2019) 242–253.
C.C. Huang, C.H. Chiou, S.C. Liu, et al., J. Pineal Res. 66 (2019) e12560.
D.E. Furst, P. Emery, Rheumatology 53 (2014) 1560–1569. doi: 10.1093/rheumatology/ket414
M. Kieler, M. Hofmann, G. Schabbauer, FEBS J. 288 (2021) 3694–3714. doi: 10.1111/febs.15715

Figure 1 Characterization of Ph-CaA-OH (PCOH), PCOH NPs and MTX@PCOH NPs. (A) Synthesis route of the PCOH. (B) 1H NMR spectrum of the PCOH. (C) FT-IR spectrum of PCOH. (D) Size distribution, (E) zeta potential and (F) TEM image of PCOH NPs. (G) Size distribution, (H) zeta potential and (I) TEM image of MTX@PCOH NPs. (J) Stability of PCOH NPs and MTX@PCOH NPs (n = 3). (K) Cumulative release of MTX from MTX@PCOH NPs (n = 3). (L) The biological safety of PCOH NPs on RAW264.7 cells and LPS-stimulated RAW264.7(+) cells (n = 5). Data are presented as mean ± standard deviation (SD).

Figure 2 Cell uptake characterizations of PCOH NPs in vitro. (A) Flow cytometry, (B) quantitative analysis and (C) fluorescence images of C6@PCOH NPs uptake by RAW264.7 cells. Scale bar: 10 µm. (D) Colocalization of lysosome and nanoparticles at 1,4 and 8 h. Scale bar: 10 µm. Data are presented as mean ± SD (n = 3).

Figure 3 In vitro anti-inflammatory efficacy of PCOH NPs. (A) Fluorescence images (Scale bar: 50 µm) and (B) quantification of ROS levels in RAW264.7 cells treated with LPS and PCOH NPs by flow cytometry. qRT-PCR detection of (C) TNF-α and (D) iNOS mRNA expression in control, LPS (positive) and LPS with different formulations treated RAW264.7 cells. (E) Quantification levels of TNF-α by ELISA. (F) Immunofluorescence analysis of iNOS. Scale bar: 10 µm. Data are presented as mean ± SD (n = 3). P < 0.05, ***P < 0.001, ****P < 0.0001.

Figure 4 Biodistribution of Dir@PCOH NPs in vivo in CIA mice. (A) Fluorescence images at different time points in vivo. (B) Fluorescence images of major organs and paws. (C) Quantitative evaluation of major organs and paw. Data are presented as mean ± SD (n = 3). ***P < 0.001.

Figure 5 Therapeutic efficacy of MTX@PCOH NPs. (A) Schedule of CIA induction and treatment. (B) Clinical score–time in different group. The remission rate is defined as the ratio of mice with a total clinical score of no more than 4. (C) Clinical scores of mice were assessed every 3 days until the time of sacrifice and (D) clinical scores on day 51. (E) Paw thickness of mice was assessed every 3 days until the time of sacrifice and (F) paw thickness on day 51. (G) Representative hind paw images of different groups on day 51. Data are presented as mean ± SD (n = 5). P < 0.05, **P < 0.01, ***P < 0.001, ****P < 0.0001.

Figure 6 Bone erosion assessment of MTX@PCOH NPs. (A) Histological examination of joint tissues from mice in various treatment groups using H & E and safranin-O staining. Scale bar: 100 µm. (B) Micro-CT images. (C) BV/TV, BS/BV, Tb.N, Tb.Th, Tb.Sp of the distal tibia. (D) BV/TV, BV/BS, Tb.N, Tb.Th, Tb.Sp of the calcaneus. Data are presented as mean ± SD (n = 3). P < 0.05, **P < 0.01, ***P < 0.001.

Figure 7 Inflammation inhibition effects of MTX@PCOH NPs in mice with rheumatoid arthritis. (A) Immunohistochemical section of TNF-α, IL-1β and iNOS. Scale bar: 100 µm. Quantification of (B) TNF-α+, (C) IL-1β and (D) iNOS region. Data are presented as mean ± SD (n = 3). P < 0.05, **P < 0.01, ***P < 0.001.

 扫一扫看文章

扫一扫关注我们
 DownLoad:

 下载:
下载: