Department of Orthopedic Surgery and Orthopedic Research Institute, West China Hospital, Sichuan University, Chengdu 610041, China
b.
State Key Laboratory of Oral Diseases, National Center for Stomatology, National Clinical Research Center for Oral Diseases, West China Hospital of Stomatology, Sichuan University, Chengdu 610041, China
c.
Sichuan Provincial Engineering Research Center of Oral Biomaterials, Chengdu 610041, China
d.
National Center for Translational Medicine, Shanghai Jiao Tong University, Shanghai 200240, China
Received Date:
17 February 2024 Accepted Date:
07 April 2024 Revised Date:
01 April 2024 Available Online:
15 March 2025
Abstract:
Neuropathic pain (NP) is one of the most common pathological pain types and is associated with limited treatment options; moreover, it affects patients’ quality of life and causes a heavy social burden. Despite the emphasis on inhibiting neuronal apoptosis to relieve NP, the crucial role of a neuroinflammation is often overlooked. Therefore, refocusing on the regulation of microglia polarization to create a more conducive environment for neuron holds great potential in NP treatment. In recent years, small interfering RNAs (siRNAs) had become an attractive therapeutic option. However, an efficient loading and delivery system for siRNA is still in lack. In our study, a nanostructured tetrahedral framework nucleic acid loaded with the small interfering RNA C–C chemokine receptor 2 (T-siCCR2) was successfully designed and synthesized for use in NP rat model in vivo and in a lipopolysaccharide (LPS)-induced inflammatory environment in vitro. This nanoscale complex is endowed with structural stability and satisfactory delivery efficiency while assuring the silencing effect of siRNA-CCR2. In vivo, T-siCCR2 treatment exhibited favorable effects on pain relief and functional improvement in the NP animal model by directly targeting microglia. In vitro, T-siCCR2 counteracts LPS-induced inflammation by inhibiting the differentiation of microglia toward the M1 phenotype, thus playing a neuroprotective role. RNA sequencing was subsequently performed to elucidate the underlying mechanism involved. These results indicate that T-siCCR2 may serve as a potential treatment option for NP in the future.
Neuropathic pain (NP) is one of the most common types of pathological pain and is normally induced by disease or injury to the nervous system. However, the currently available analgesics for chronic pain treatment are unsatisfactory due to adverse side effects and insufficient efficacy [1]. Clinically, pain occurs not only locally but also on the spinal cord dorsal horn, which is far from the region of primary pain. The underlying pathophysiological mechanism of NP is still poorly understood, but emerging evidence indicates that apoptosis in spinal dorsal horn neurons is an important factor in the development of NP [2]. Efforts have been made to develop therapeutics for minimizing neuronal damage [3]. However, all these methods only target neuron, and therefore the efficacy is relatively poor. Recently, the relationship between neuroinflammation and neuronal apoptosis in the pathogenesis of NP has been demonstrated [4]. Neuroinflammation involves the activation of microglia and astrocytes as well as the migration of immune cells to the spinal cord. Activated and recruited immune cells release proinflammatory cytokines to regulate neuronal activity in the central nervous system, thus causing central sensitization phenomena and persistent NP. After that, activated microglia can transform into proinflammatory M1 or anti-inflammatory M2 phenotypes, two counterparts that possess opposite biological effects. The former causes neuronal apoptosis and neurodegeneration via the uncontrolled release of proinflammatory factors, such as tumor necrosis factor-α (TNF-α) and interleukin 6 (IL-6). In contrast, the latter alleviates inflammation and protects neurological function by releasing numerous anti-inflammatory factors, including IL-10 and IL-4 [5]. Collectively, microglia may be crucial mediators between neuroinflammation and neuronal apoptosis. Therefore, pharmaceuticals that target microglial polarization may alleviate neuronal apoptosis by altering the inflammatory environment to improve its efficacy as one of the potential NP treatment options.
Current regulatory methods for microglial polarization based on nonselective drugs often fail to achieve desirable clinical outcomes, while gene therapy seems to be a promising alternative in the past decade. C—C chemokine receptor 2 (CCR2) silencing with small interfering RNA (siRNA) seems an efficacious strategy, since CCR2 is specifically expressed on microglia and participates in the mediation of various inflammatory diseases by regulating immune response. The major barriers preventing siRNA-based therapeutics include poor cellular uptake and instability of free siRNA in serum [5]. Hence, the selection of an appropriate loading and delivery system is key to unleashing the clinical potential of siRNAs [6,7]. In recent years, tetrahedral framework nucleic acids (tFNA) have shown great potential for delivering therapeutic genes or drugs to the targeted sites with required pharmacology bioactivity. Moreover, our previous study revealed that tFNA itself could regulate polarization of macrophages by inhibiting the phosphorylation of mitogen-activated protein kinases (MAPK) and protect neuron from apoptosis by blocking the nuclear factor kappa-B (NF-κB) signaling pathway [8]. Therefore, tFNA may provide a potential strategy for the development of siRNA-based drugs for treating NP. Here, we successfully established a multifunctional tetrahedral framework nucleic acid system named “tFNA-siCCR2” (T-siCCR2) to treat NP and revealed some exciting findings. First, T-siCCR2 exhibited favorable effects on pain relief and functional improvement in the NP animal model by alleviating inflammation and neuronal apoptosis. Second, T-siCCR2 played a neuronal protective role by direct regulation of microglia in vitro neuroinflammatory model. Last but not the least, T-siCCR2 managed to regulate the polarization of lipopolysaccharide (LPS)-induced microglia towards the M2 phenotype via chemokine signaling pathways. Taken together, these results demonstrated that T-siCCR2 could serve as a potential treatment option for NP in the future.
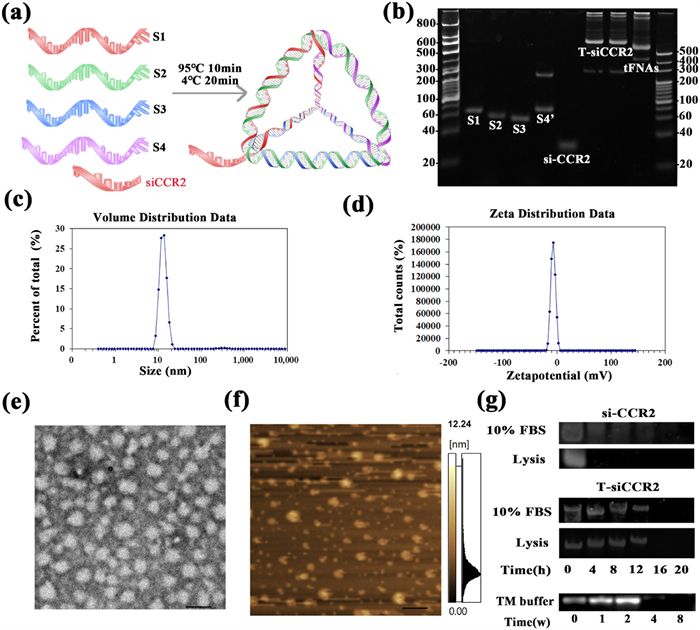
T-siCCR2 was first fabricated and characterized. Four single DNA strands self-assembled into a tetrahedron based on the principle of complementary base pairing, and si-CCR2 was connected to the 3′ end of single strand S2 to form a tetrahedron with a tail-like structure (Fig. 1a). Polyacrylamide gel electrophoresis (PAGE) was used to determine the molecular weight of T-siCCR2 and its relative position compared to those of the four single DNA strands, si-CCR2 strand and tFNA (Fig. 1b). The size and zeta potential were detected by dynamic light scattering (DLS), and the hydrodynamic size of tFNA-siCCR2 was 12.91 ± 5.54 nm (Fig. 1c). The zeta potential of the tFNA-siCCR2 was −0.02 ± 1.51 mV (Fig. 1d). Transmission electron microscopy (TEM) and atomic force microscopy (AFM) were used to characterize T-siCCR2 (Figs. 1e and f). To further confirm the material stability, T-siCCR2 was incubated with 10% fetal bovine serum (FBS) and lysed at 37 ℃ and detected via polyacrylamide gel electrophoresis (PAGE). Approximately 80% of the T-siCCR2 still exhibited after 12 h in 10% FBS or lysis buffer, whereas naked si-CCR2 was not detected after 4 h. Additionally, T-siCCR2 remained stable for up to 2 weeks in TM buffer at 4 ℃ (Fig. 1g).
Figure 1
Figure 1.
Fabrication, characterization and cellular uptake of T-siCCR2. (a) Schematic diagram of the fabrication of T-siCCR2. (b) T-siCCR2 was detected via PAGE. (c) The size of T-siCCR2 was 12.91 ± 5.54 nm. (d) The zeta potential of T-siCCR2 was −3.02 ± 4.51 mV. (e) TEM images of T-siCCR2 cells. Scale bar: 200 nm. (f) AFM images of T-siCCR2. Scale bar: 1 µm. (g) Stability of T-siCCR2 in 10% FBS, lysis buffer.
To verify the cellular uptake capacity of the construct, siCCR2 and T-siCCR2 were both labeled with 1.0 wt% cyanine 5 (Cy5). Next, BV2 cells were incubated with Cy5-loaded siCCR2 or Cy5-T-siCCR2 for 4 or 12 h and subsequently evaluated via confocal microscopy. Immunofluorescence (IF) images showed that both naked siCCR2 and T-siCCR2 started to enter cells within 4 h. After 12 h, the majority of the T-siCCR2 cells were still visible (Fig. S1a in Supporting information). However, naked siCCR2 was barely detected within the cells (Fig. S1b in Supporting information). Based on the above evidence, we assumed that si-CCR2 could only exert a transient effect due to its structural instability, while T-siCCR2 might exert a more long-lasting effect. However, si-CCR2 alone does not possess a mechanism to provide either of these properties. To further confirm the silencing efficiency of T-siCCR2 on CCR2 expression, polymerase chain reaction (PCR) and Western blot (WB) were carried out to evaluate CCR2 expression. Compared to those in the control group, naked siCCR2, tFNA, and T-siCCR2 treatment significantly inhibited the expression of CCR2 at both the transcriptional and protein levels (Figs. S2a and b in Supporting information). Specifically, the expression of the CCR2 protein was significantly lower (by 80%) after T-siCCR2 treatment than after the other two treatments. Taken together, these findings suggest that tFNA might be an excellent vehicle for loading si-CCR2. Gene therapy with siRNA is an attractive therapeutic option that has been successfully used in many preclinical models, including NP models, but the major barrier preventing successful siRNA-based therapeutics is poor cellular uptake and instability of free siRNA in serum [9]. Hence, the selection of an appropriate siRNA and the efficient loading and delivery of siRNA are key to realizing the clinical potential of siRNA [10]. In this study, we successfully synthesized a multifunctional tetrahedral framework nucleic acid system for treating NPs, T-siCCR2, which could afford satisfactory delivery efficacy and structural stability while ensuring silencing efficiency of siCCR2.
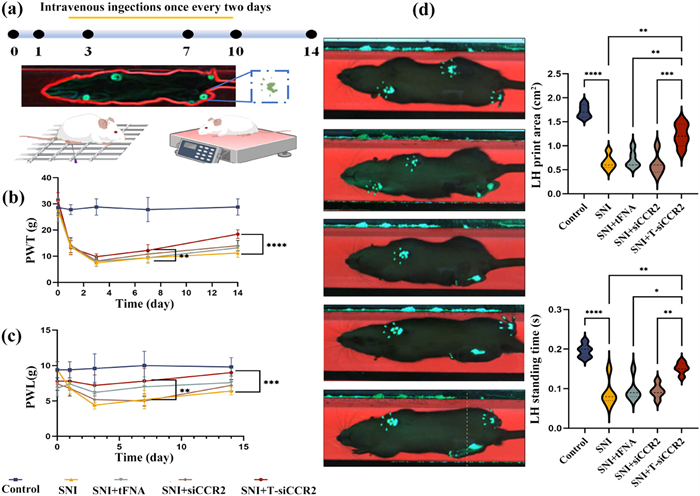
Subsequently, to verify the effect of T-siCCR2 on the NP, we conducted in-vivo experiments on rats. All animals were handled according to the Guidelines and approved by the Orthopedic Research Institute, Sichuan University. After spared nerve injury (SNI) surgery, the paw withdrawal threshold (PWT) and paw withdrawal latency (PWL) were detected on day 1 before and on days 1, 3, 7, 10, and 14 after SNI surgery, respectively. The flow of the in vivo experiment is shown in Fig. 2a. Persistent pain-like behaviors were observed beginning on the first day after surgery and occurred only in the ipsilateral (surgical side) paw of the SNI model, which suggested the successful establishment of the SNI rat model. As shown in Figs. 2b and c, there was no significant difference in the mechanical or thermal pain threshold before SNI surgery between the two groups (P > 0.05). However, the PWT and PWL were both distinctly lower in the SNI group than in the control group beginning on day 1 (P < 0.001). In addition, compared with those in the SNI group, the PWT and PWL in the T-siCCR2 group began to increase on day 3 and then significantly increased on day 14 (P < 0.001). Furthermore, slight improvements were observed in the si-CCR2 group and tFNA group, but the differences were inferior to those in the T-siCCR2 group. Next, we examined the static gait parameters via the CatWalk gait analysis on day 14. Quantitatively, the paw print area of the left hind (LH) rats in the control group was clearer and more complete, while only a small part of the LH paw print was obtained in the SNI group, and the LH paw print area was significantly reduced. After T-siCCR2 treatment for 14 days, the LH paw print area of the rats in the T-siCCR2 group was obviously greater than that of the rats in the tFNA and si-CCR2 groups. Additionally, the 2D imaging data also demonstrated that, compared with that in the SNI group, the LH standing time was longer but the LH swing time was significantly shorter in the T-siCCR2 group (Fig. 2d). These results demonstrated that T-siCCR2 could alleviate mechanical allodynia and thermal hyperalgesia in SNI rats, thus improving sensory and motor coordination.
Figure 2
Figure 2.
T-siCCR2 treatment improved sensory and motor coordination in an SNI-induced neuropathic pain rat model. (a) Schematic diagram of the experimental protocols, including the assessment of mechanical allodynia and the measurement of thermal hyperalgesia. (b, c) The PWT and PWL were detected on day 1 before SNI surgery and on days 1, 3, 7, and 14 after SNI surgery to evaluate the time course of the treatment on SNI rats (n = 3). (d) Video captures of the CatWalk gait test. The rats passed through the tunnel from right to left. The footprints in the glass plate are detected by the camera and transmitted to the computer for analysis. The intensity of the CatWalk gait parameters, including the LH print area and LH standing time, was determined on day 14 after SNI surgery. Statistical and density curves showing the distribution of the immune score on the right. Bars represent the mean ± SD with individual points overlaid (n = 3). Statistical analysis was performed with one-way ANOVA. *P < 0.05, **P < 0.01, ***P < 0.001, ****P < 0.0001.
Next, the secretion of inflammatory factors associated with pain in peripheral blood collected from rats in each group was detected via enzyme-linked immunosorbent assay (ELISA). After T-siCCR2 treatment, a strong reduction in the serum level of proinflammatory cytokines was evident, whereas the level of anti-inflammatory cytokines increased significantly (Fig. S3a in Supporting information). In addition, the effect of T-siCCR2 on pain-related biomarkers in the spinal cord was verified. The spinal cord intumescentia lumbalis segment was extracted and examined. As presented in Fig. S3b (Supporting information), the results showed that T-siCCR2 treatment inhibited the expression of CCR2 and Toll-like receptor 4 (TLR4). Furthermore, PCR results demonstrated the downregulation of pain-related genes, including CCR2, TLR4, CCL2, and CXCL3, which was consistent with what we found via immunohistochemical analysis (Fig. S3c in Supporting information). SNI is the most recognized method for simulating NP and exploring the molecular mechanism involved in peripheral NP [11]. Long-lasting NP-like behaviors are induced by cutting the tibial and common peroneal nerve branches of the sciatic nerve [12]. In our study, intact mechanical and thermal pain hypersensitivities were observed in the affected limbs of SNI rats. T-siCCR2 treatment improved sensory and motor coordination and altered the expression of inflammation-related cytokines and pain-related genes in an SNI-induced NP rat model.
Our further research was aimed to clarify which cell was associated with the protective effect of T-siCCR2 in NP. IF staining was performed to detect the colocalization of CCR2 and Iba-1 (a marker of microglia) and the colocalization of CCR2 and glial fibrillary acidic protein (GFAP, a marker of astrocytes), respectively. The results showed that CCR2 predominantly acted on Iba-1+ microglia but not on GFAP+ astrocytes. In addition, T-siCCR2 had no significant effect on the proportion of CCR2+ GFAP+ cells, while the intervention had a significant effect on the proportion of CCR2+ Iba-1+ cells according to the ImageJ colocalization analysis (Figs. S4a and b in Supporting information). Moreover, PCR analysis of the spinal cord showed that experimental intervention had a significant effect on Iba-1 but not GFAP (Fig. S4e in Supporting information). These results indicated that microglia expressed higher levels of CCR2 in 14-day SNI rat models than in other cell types, including neurons and astrocytes, and that T-siCCR2 played a protective role primarily by inhibiting CCR2 expression in microglia.
Although CCR2 was not highly expressed in neurons, interestingly, our PCR results showed that the expression of characteristic neuronal markers NeuN and apoptosis-related genes, including Bcl-2 and Bax, was also altered in the surgery and intervention groups. Specifically, compared with those in the SNI group, the levels of Bcl-2 and NeuN in the T-siCCR2 group were significantly greater, while the Bax level was significantly lower (Fig. S4e). Afterwards, the spinal cord tissue was further analyzed via IF staining to determine which type of cell was involved during the whole process. We first conducted immunofluorescent colocalization of characteristic biomarkers (Iba-1, GFAP, and NeuN) and apoptosis-related proteins (Bcl-2 and Bax), and the results showed that Bcl-2 and Bax colocalized with NeuN, while little colocalization of apoptosis-related markers was found with Iba-1 and GFAP. Moreover, the therapeutic effect of T-siCCR2 was quantified by comparing immunostaining for neuron-specific nuclear protein (NeuN) and apoptosis-related factors (bcl2 and Bax) to confirm neuronal apoptotic cell death. The apoptosis index and nonapoptotic index were calculated by dividing the number of Bax- and Bcl-2-labeled neurons (yellow) by the total number of neurons (red). After further treatment with T-siCCR2, the neuronal apoptosis index was found to decreased, and the nonapoptotic index increased. As determined by quantification, the neuronal apoptosis indices of the T-siCCR2 group were 0.42 times greater than those of the SNI group, 0.53 times greater than those of the tFNA group, and 0.48 times greater than those of the si-CCR2 group (Figs. S4c and d in Supporting information). Overall, in this section, we first verified that neuronal apoptosis is related to the pathogenesis of NP, and T-siCCR2 treatment could suppress neuron apoptosis. Several studies have focused on apoptotic activity changes in damaged nerves and discussed the relationship between apoptosis and NP after nerve damage [13]. Chen et al. have also found that different interventions, including medicines and hyperbaric oxygen therapy, can suppress apoptotic activities in the spinal cord, thus attenuating NP [12], which is consistent with our findings: After T-siCCR2 intervention, the neuronal apoptosis index was significantly reduced. Secondly, we demonstrated that the T-siCCR2 directly targets microglia cells rather than neurons through fluorescence colocalization. Studies have shown that microglial activation and the formation of M1-type microglia contribute to pathologic inflammation in a CCR2-dependent manner [14,15]. Meanwhile, proinflammatory cytokines play an essential role in promoting apoptotic activities and NP formation [16]. Similarly, we also found that microglia activation was reduced after T-siCCR2 intervention. Therefore, to explain the data thus far we proposed the following series of linked hypotheses: The direct target of T-siCCR2 appeared to be microglia rather than neurons. Moreover, T-siCCR2 could alleviate the apoptosis of neurons by inhibiting the activation of microglia, thus playing a neuroprotective role in NP disease progress.
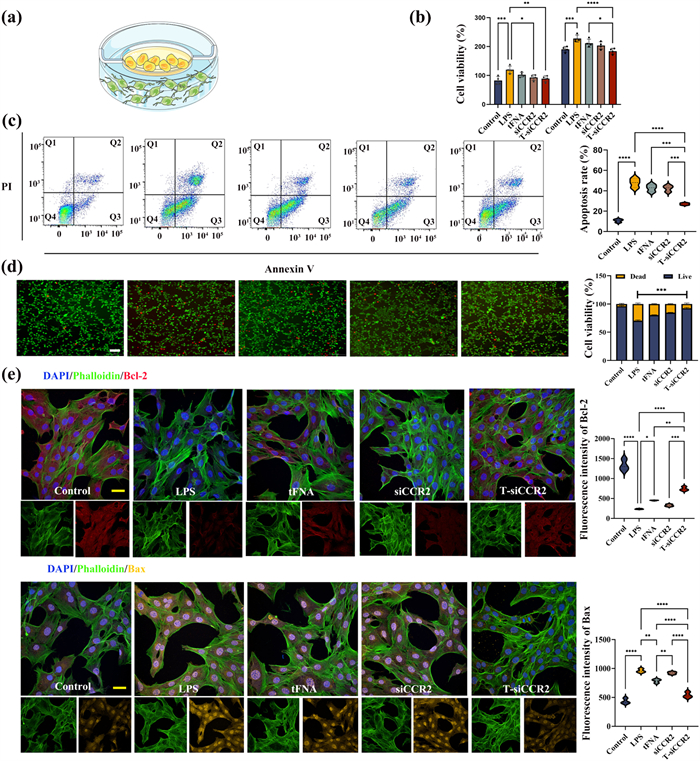
To further investigate the role of T-siCCR2, we co-cultured BV2 cells (microglia) with HT-22 cells (neurons) and added LPS to the culture mixture to mimic neuroinflammation in vitro (Fig. 3a). The cells were divided into five groups: the control group, LPS group, LPS + tFNA group, LPS + siCCR2 group and LPS + T-siCCR2 group. The results of cell-counting-kit-8 (CCK-8) assay showed that the viability of neurons co-cultured with LPS treated microglia was only half compared to that of the neurons co-cultured with non-LPS treated microglia. After both 24 and 48 h, while intervention with T-siCCR2 significantly attenuated this apoptotic effect, especially at 48 h (Fig. 3b). Consistent with these findings, flow cytometry also demonstrated that after T-siCCR2 treatment, the number of surviving neurons was significantly greater than that in the LPS group (73% ± 3.5% versus 58% ± 2.7%) (Fig. 3c). IF staining of live and dead cells further verified these results and revealed that, compared with that in the control group, LPS treated microglia enhanced the apoptosis of neurons. However, after T-siCCR2 treatment, neuronal apoptosis was significantly ameliorated, and the number of apoptotic cells was significantly lower than that in the siCCR2 and tFNA groups (Fig. 3d). According to previous studies, LPS treatment at 0.1 µg/mL decreases cell viability and induces apoptosis in neurons [17]. In the present study, LPS alone at 10 ng/mL had no harmful effect on neurons, while the 10 ng/mL LPS treated microglia caused considerable damage to the neurons. Besides, LPS was proved to promote systemic inflammation by stimulating microglial activation [18]. Therefore, it is reasonable to predict that microglia stimulated by LPS initiate and amplify neuroinflammatory response to promote apoptosis of neurons [19]. Bcl-2, Bax and caspase-3 play key roles in regulating cell apoptosis, where Bcl-2 plays the anti-apoptotic role while Bax and caspase-3 have apoptotic functions [20-22]. IF staining revealed that neurons treated with LPS exhibited increased expression of Bax and caspase-3, and decreased expression of Bcl-2 (Fig. S5 in Supporting information). Quantitatively, compared with that in the LPS group, the fluorescence intensity of Bcl-2 in the T-siCCR2 group was increased by 84.0%, and the fluorescence intensity of Bax was reduced by 78.6% (Fig. 3e). Furthermore, the IF results were validated by PCR analysis, which demonstrated the same trend. In this section, the results confirm that in vitro NP models could induce neuronal apoptosis as well as in vivo. Accumulating evidence emphasizes that exaggerated inflammatory response can drive neuronal apoptosis and sensitize nociceptors in the pathogenesis of chronic pain [23]. However, the involvement of specific molecular signaling pathways in neuroinflammation and neuronal apoptosis has not been determined [24]. One of the mechanisms underlying apoptosis includes perturbations in mitochondrial function. Moreover, evidences indicated the inflammatory process initiated oxidative stress, resulting in the synthesis and secretion of proinflammatory cytokines, and activated mitochondrial apoptotic machinery [25]. This is consistent with our elucidation of the mechanism of neuronal apoptosis induced by LPS treated microglia. Hence, apoptosis of neurons shows a close relationship with inflammation, T-siCCR2 could play a protective effect on neurons in the coculture system consisting of microglia and neurons in the presence of LPS by blocking the extrinsic apoptotic pathway and the subsequent endogenous apoptotic pathway on the mitochondrial membrane via inhibiting the activation of microglia [26]. But it remains unclear how LPS treatment affects microglia and thus neuronal cell apoptosis. Therefore, next focus of our study was to define the effects of LPS on microglia.
Figure 3
Figure 3.
T-siCCR2 exerts a neuroprotective effect by suppressing the apoptosis of neurons (a) Schematic diagram of a coculture model of BV2 and HT-22 cells. (b) Cytotoxicity of different concentrations of T-siCCR2 on HT-22 cells at 24 and 48 h. (c) Flow cytometry showing the apoptosis of HT-22 cells in the co-culture model. (d) Annexin V/propidium iodide (PI) staining images of HT-22 cells in the coculture model. Original magnification: ×4. Scale bar: 75 µm. (e) Results of immunofluorescence staining for apoptosis-related proteins in each group. Green: phalloidin; Red: Bcl-2; Yellow: Bax; Blue: 4′,6-diamidino-2-phenylindole (DAPI). Original magnification: ×40. Scale bar: 10 µm. Bars represent the mean ± SD with individual points overlaid (n = 3). Statistical analysis was performed with one-way ANOVA. *P < 0.05, **P < 0.01, ***P < 0.001, ****P < 0.0001.
Next, to verify the effects of LPS on microglia, we continue the in vitro experiments. CCK-8 assay showed that LPS significantly increased BV2 cell proliferation at 24 and 48 h (Fig. S6 in Supporting information). In addition, at both time points, T-siCCR2 inhibited the proliferative activity of BV2 cells induced by LPS, while this inhibitory effect was not observed in the tFNA group. Interestingly, naked siCCR2 administration suppressed the effect of LPS, while this inhibitory effect was no longer evident at 48 h, which can be explained by the fact that RNA is relatively unstable and vulnerable to degradation.
LPS has been widely reported to induce inflammation in microglia [17]. To analyze the effect of the intervention on LPS-treated microglia, supernatants from LPS-stimulated microglial cultures were subjected to multianalyte ELISA for inflammation-related cytokines, including proinflammatory markers (TNF-α and IL-6) and anti-inflammatory markers (IL-4 and IL-10). The results showed that the levels of both proinflammatory markers were lower in the T-siCCR2 group than in the other two groups, while the levels of both anti-inflammatory markers were greater in the T-siCCR2 group than in the other two groups (Fig. S7a in Supporting information). Next, IF staining was used to detect the inflammation-related proteins TNF-α and IL-6. The results showed that the fluorescence intensity of both proteins was significantly increased in the LPS group, while simultaneous treatment with T-siCCR2 significantly inhibited the fluorescence intensity (Fig. S7b in Supporting information). We subsequently carried out PCR assays and obtained consistent results (Fig. S7c in Supporting information). This is consistent with our previous inference that TNF-α and related inflammatory mediators can act as extracellular death ligands to activate the extrinsic apoptotic pathway [27,28].
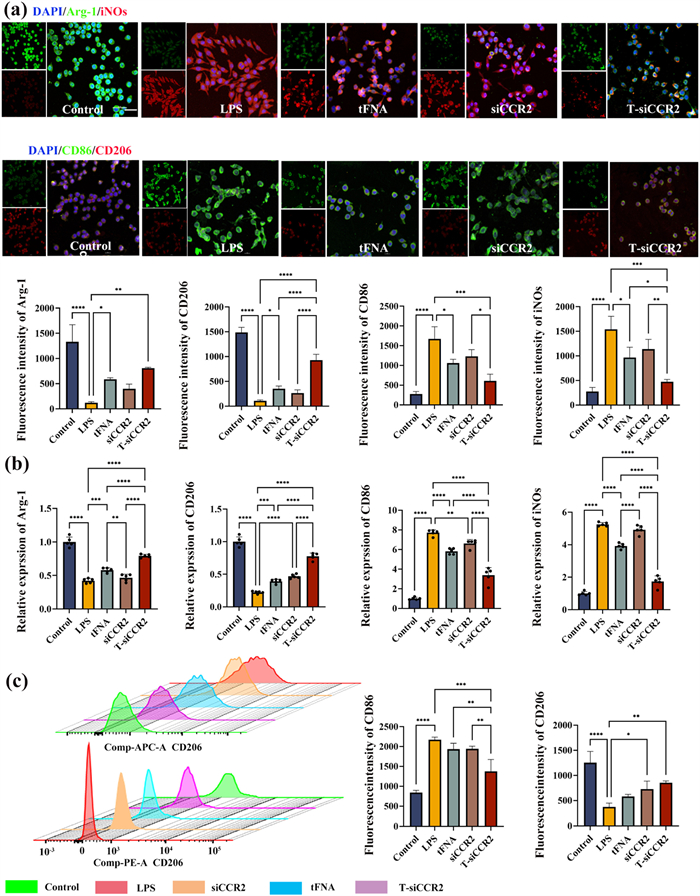
Activated microglia are important source of proinflammatory cytokines that induce neuroinflammation. To investigate the effects of T-siCCR2 on the activation of microglia stimulated with LPS, morphological changes in microglia were first evaluated. The results suggested that the number of amoeboid-shaped microglia after LPS stimulation was reduced by T-siCCR2, while intervention with naked siCCR2 or tFNA did not significantly reduce the number of amoeboid-shaped microglia. Quantitative evaluation of microglial morphology revealed that microglia in the control group exhibited a resting state with an average cell diameter of 3.8 ± 1.3 µm, while microglia in the LPS group exhibited a classic activated state with an average cell diameter of 13.23 ± 1.3 µm. The mean cell diameter in the tFNA intervention group was 8.73 ± 1.7 µm. The mean cell diameter in the siCCR2 intervention group was 9.35 ± 2.11 µm. The mean cell diameter in the T-siCCR2 intervention group was 6.23 ± 1.8 µm (Fig. S8 in Supporting information). Activated microglia can be conventionally classified as classically activated (proinflammatory) M1 or alternatively activated (anti-inflammatory) M2 [29]. Therefore, we further examined how the polarization of microglia changes under the influence of T-siCCR2. Upon pathological stimulation, microglia polarize toward the M1 type and release various inflammatory cytokines, which are crucial factors for the initiation and maintenance of the NP. According to this mechanism, it is hypothesized that suppressing the polarization of microglia toward the M1 type may be effective for NP treatment. iNOs, CD86, Arg-1, and CD206 were used as markers for M1 and M2 microglia, respectively. To investigate the effects of T-siCCR2 on LPS-mediated microglial polarization, the expression of M1 and M2 markers was measured via IF staining, which revealed that the expression levels of M2 markers (Arg-1 and CD206) were significantly decreased in the LPS group and increased in the T-siCCR2 group but still lower than that in the control group. The si-CCR2 group exhibited significantly lower expression levels than the tFNA group, which was still significantly lower than that of the T-siCCR2 group. On the other hand, M1 markers (iNOS and CD86) were increased in the LPS group and significantly decreased in the siCCR2 group and the tFNA group, with the T-siCCR2 group demonstrating the lowest expression levels of both iNOS and CD86 (Fig. 4a). In addition, PCR analysis also yielded consistent results (Fig. 4b). Furthermore, flow cytometry revealed that 53.7% of the LPS-induced microglia were polarized toward the M1 phenotype, which was marked with CD86. The percentage of M2-type cells marked with CD206 was only 0.1%. After treatment with siCCR2, the percentage of M1-type cells decreased to 29.4%, while the percentage of M2-type cells increased to 7.66%. After treatment with tFNA, the percentage of M1-type cells decreased to 26.8%, and the percentage of M2-type cells increased to 12.5%. After treatment with T-siCCR2, the percentage of microglia that polarized toward the M1 phenotype was the lowest (8.66%), and the percentage of M2 phenotype was the highest (70.0%) (Fig. 4c). These results indicated that T-siCCR2 effectively inhibited the polarization of microglia toward the M1 phenotype induced by LPS and promoted their polarization toward the M2 phenotype. Although siCCR2 and tFNA both had similar effects, these effects were significantly weaker than that of T-siCCR2. The above experimental findings support the speculation that T-siCCR2 predominantly inhibits microglial activation to suppress inflammation and protect neurons against apoptosis, thus hindering the transmission of nociceptive stimulation in the posterior horn of the spinal cord.
Figure 4
Figure 4.
(a) Results of immunofluorescence staining for polarization-related proteins in each group. Green: from top to bottom, Arg-1 and CD86; Red: from top to bottom, iNOS and CD206; Blue: DAPI. Original magnification: ×40. Scale bar: 10 µm. The statistical and density curves below the diagrams indicate the trend in the distribution of immune scores. (b) PCR analysis of Arg-1, CD206, iNOS and CD86. (c) Representative flow cytometric plot. The statistical and density curves indicate the trend in the distribution of the immune score on the right. Bars represent the mean ± SD with individual points overlaid (n = 3). Statistical analysis was performed with one-way ANOVA. *P < 0.05, **P < 0.01, ***P < 0.001, ****P < 0.0001.
Finally, to elucidate the molecular mechanism through which T-siCCR2 regulates microglial polarization, we performed transcriptome analyses via RNA sequencing (RNA-seq) and Kyoto encyclopedia of genes and genomes (KEGG) pathway analysis. Upon the addition of T-siCCR2, 278 genes were downregulated, and 196 genes were upregulated (Fig. S9 in Supporting information). A heatmap of the top 20 upregulated and top 20 downregulated mRNAs is shown in Fig. S10a (Supporting information). Enrichment analysis of the KEGG analysis revealed 132 pathways, of which the top 30 terms are shown in Fig. S10b (Supporting information). The analysis indicated that inflammation-related signaling pathways, including the IL-17 signaling pathway, chemokine signaling pathway, NOD-like receptor signaling pathway, mitogen-activated protein kinase (MARK), and NF-κB signaling pathway, were significantly enriched. The 30 gene ontology (GO) terms related to the most genes according to the GO enrichment analysis are shown in Fig. S10c (Supporting information). The intersection portion of the Wayne plot shows 57 differentially expressed genes, including various genes in the chemokine signaling pathway enriched in KEGG (Fig. S10d in Supporting information). After incubation with T-siCCR2, the expression of chemokine signaling pathway-related proteins, such as sarcoma gene (Src), CCR2, extracellular regulated protein kinases (ERK) and NF-κB, was significantly inhibited. Notably, the unexpected cross-coupling of two transcription factors, NF-κB p65 and AP-1, may also be involved in CCR2. Previous studies have suggested that the intracellular immune response is activated by the binding of chemokines to their corresponding receptors to regulate guanine nucleotide-binding protein subunit alpha-1 (GNAl1) and subsequently activate the phosphorylation of SRC, further stimulating AP-1 and NF-κB p65 transcriptional activities via the MAPK and NF-κB pathways, respectively, leading to the transcription of a series of chemokines, such as C—C motif chemokine ligand 2 (CCL2) and chemokine (C-X-C motif) ligand 3 (CXCL3), and other cytokines, such as IL-6. Moreover, TNF-α can cause extreme adverse effects on the body [30]. In addition, NF-κB p65 and AP-1 are important transcription factors for the expression of some inflammation-related genes involved in the inflammatory response [31]. A diagram of the gene expression patterns revealed that T-siCCR2 inhibited proinflammatory cytokine release by targeting the chemokine signaling pathway (Fig. S10e in Supporting information). Next, we determined the mRNA levels of downstream targets in the chemokine signaling pathway. Consistently, the increases in CCR2, GNAI1, SRC, ERK, AP-1 and NF-κB mRNA levels induced by LPS were also significantly suppressed by T-siCCR2 (Fig. S10f in Supporting information).Overall, our findings suggest that the T-siRNA complex inhibited the activation of chemokine signaling pathways through targeted downregulation of CCR2 gene expression and further inhibited the activation of the NF-κB/MAPK pathway and the expression of downstream proteins, thus suppressing neuroinflammation during NP development and progression. To summarize, T-siCCR2 could serve as a promising agent for the treatment of NP, whereas siCCR2 and tFNA alone failed to achieve the same therapeutic effect. We believe that the T-siCCR2 complex inhibits the activation of chemokine signaling pathways through targeted downregulation of CCR2 gene expression and further restrains the activation of the NF-κB/MAPK pathway and the expression of downstream proteins, therefore promoting M2 polarization and change the cellular microenvironment by suppressing secreting inflammatory chemokines, and optimization of the inflammatory environment could reduce neuronal apoptosis, thereby effectively alleviating NP development.
In summary, we successfully constructed the nanostructure T-siCCR2, in which tFNA acted as an efficient carrier for siCCR2. Moreover, T-siCCR2 was generated through simple synthetic procedures with structural stability and desirable biocompatibility while ensuring the silencing of CCR2. T-siCCR2 effectively promoted M2 polarization of microglia to suppress inflammation by inhibiting the activation of chemokine signaling pathways through targeted downregulation of CCR2 gene expression, thus protecting neurons against apoptosis and effectively relieving NP development. Overall, T-siCCR2 might be a potential agent for NP treatment in the future.
[1]
L. Colloca, T. Ludman, D. Bouhassira, et al., Nat. Rev. Dis. Primers 3 (2017) 17002. doi: 10.1038/nrdp.2017.2
[2]
Q.G. Wang, J. Cheng, F. Liu, et al., Adv. Sci. 11 (2024) 2306622. doi: 10.1002/advs.202306622
Figure 1
Fabrication, characterization and cellular uptake of T-siCCR2. (a) Schematic diagram of the fabrication of T-siCCR2. (b) T-siCCR2 was detected via PAGE. (c) The size of T-siCCR2 was 12.91 ± 5.54 nm. (d) The zeta potential of T-siCCR2 was −3.02 ± 4.51 mV. (e) TEM images of T-siCCR2 cells. Scale bar: 200 nm. (f) AFM images of T-siCCR2. Scale bar: 1 µm. (g) Stability of T-siCCR2 in 10% FBS, lysis buffer.
Figure 2
T-siCCR2 treatment improved sensory and motor coordination in an SNI-induced neuropathic pain rat model. (a) Schematic diagram of the experimental protocols, including the assessment of mechanical allodynia and the measurement of thermal hyperalgesia. (b, c) The PWT and PWL were detected on day 1 before SNI surgery and on days 1, 3, 7, and 14 after SNI surgery to evaluate the time course of the treatment on SNI rats (n = 3). (d) Video captures of the CatWalk gait test. The rats passed through the tunnel from right to left. The footprints in the glass plate are detected by the camera and transmitted to the computer for analysis. The intensity of the CatWalk gait parameters, including the LH print area and LH standing time, was determined on day 14 after SNI surgery. Statistical and density curves showing the distribution of the immune score on the right. Bars represent the mean ± SD with individual points overlaid (n = 3). Statistical analysis was performed with one-way ANOVA. *P < 0.05, **P < 0.01, ***P < 0.001, ****P < 0.0001.
Figure 3
T-siCCR2 exerts a neuroprotective effect by suppressing the apoptosis of neurons (a) Schematic diagram of a coculture model of BV2 and HT-22 cells. (b) Cytotoxicity of different concentrations of T-siCCR2 on HT-22 cells at 24 and 48 h. (c) Flow cytometry showing the apoptosis of HT-22 cells in the co-culture model. (d) Annexin V/propidium iodide (PI) staining images of HT-22 cells in the coculture model. Original magnification: ×4. Scale bar: 75 µm. (e) Results of immunofluorescence staining for apoptosis-related proteins in each group. Green: phalloidin; Red: Bcl-2; Yellow: Bax; Blue: 4′,6-diamidino-2-phenylindole (DAPI). Original magnification: ×40. Scale bar: 10 µm. Bars represent the mean ± SD with individual points overlaid (n = 3). Statistical analysis was performed with one-way ANOVA. *P < 0.05, **P < 0.01, ***P < 0.001, ****P < 0.0001.
Figure 4
(a) Results of immunofluorescence staining for polarization-related proteins in each group. Green: from top to bottom, Arg-1 and CD86; Red: from top to bottom, iNOS and CD206; Blue: DAPI. Original magnification: ×40. Scale bar: 10 µm. The statistical and density curves below the diagrams indicate the trend in the distribution of immune scores. (b) PCR analysis of Arg-1, CD206, iNOS and CD86. (c) Representative flow cytometric plot. The statistical and density curves indicate the trend in the distribution of the immune score on the right. Bars represent the mean ± SD with individual points overlaid (n = 3). Statistical analysis was performed with one-way ANOVA. *P < 0.05, **P < 0.01, ***P < 0.001, ****P < 0.0001.

 DownLoad:

 下载:
下载:


