Scheme 1.
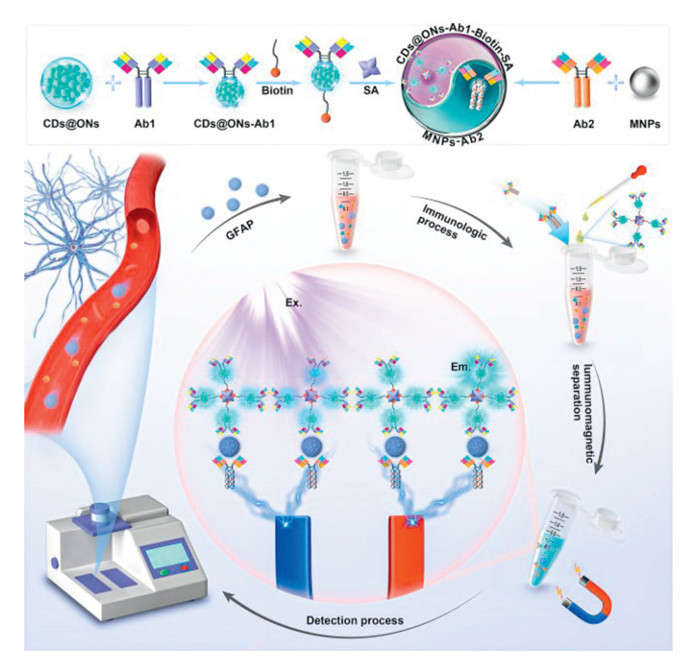
Schematic of the fluorescence immunoassay system for GFAP detection.
Signal cascade amplification of streptavidin-biotin-modified immunofluorescence nanocapsules for ultrasensitive detection of glial fibrillary acidic protein
Bo Liu , Shuaiqiang Shao , Junjie Cai , Zijian Zhang , Feng Tian , Kun Yang , Fan Li

Traumatic brain injury (TBI) can lead to permanent physical impairment, disability, or even death [1]. Computed tomography (CT) scans and the Glasgow Coma Scale (GCS) are two conventional means of clinically assessing the severity of TBI [2]. However, CT scans may result in human radiation exposure, which is costly and procedurally lengthy and poorly assesses mild traumatic brain injury [3]. The GCS determines the severity of TBI by evaluating the patient's symptoms (e.g., eye-opening, motor responses, and verbal responses) [4], which renders it a certain amount of subjectivity and limitation [5]. The blood biomarkers can potentially predict TBI. Among them, glial fibrillary acidic protein (GFAP) plays a pivotal role in assessing different levels of TBI and patient prognosis. GFAP is a brain-specific monomeric intermediate filament protein expressed almost exclusively in astrocytes and is associated with axonal injury, elevated intracranial pressure, and mortality [6]. Elevated levels of GFAP can be detected in serum within 1 h after TBI [7] and attain levels peak within 12 h [8]. There is a low threshold for serum GFAP (60 pg/mL) in mild TBI [9], and reaching 1.5 ng/mL may indicate a factor contributing to death [4]. Therefore, rapid and effective quantitative detection of GFAP in the blood can promptly determine the severity of TBI and reduce the cost of medical analysis [10].
Conventional methods for early diagnosis and monitoring of TBI include high-performance chromatography, mass spectrometry, enzyme-linked immunosorbent assay, immunohistochemistry, and Western blot assay, which require professional staff and expensive testing equipment in the laboratory [6]. Moreover, these assays have time-consuming operation processes and long analysis times, with inadequate sensitivity and detection range. However, the fluorescence immunoassay, with the advantages of high sensitivity, superior selectivity, and easy operation, is effectively used for the trace detection of proteins [11]. Conventional fluorescence immunoassays rely on expensive molecular dyes and are susceptible to photobleaching [12]. Therefore, the development of fluorescent markers with excellent optical properties and affordability is a pressing issue. Carbon dots (CDs), which are zero-dimensional carbon nanomaterials with a particle size smaller than 10 nm, possess several advantageous characteristics, such as high stability, straightforward preparation methods, resistance to photobleaching, and excellent biocompatibility [13]. Due to its superb fluorescence properties, high quantum yield, tunable fluorescence emission, and abundant functional groups on its surface [14], it can be utilized as a fluorescent marker in biosensing applications for small molecules [15], RNA/DNA [16], proteins [17], bacteria [18], fungi [19], and other biological entities. While there are significant advancements in CD-based fluorescence detection technology in biosensing, achieving ultrasensitive trace detection remains a challenge. Consequently, enhancing the fluorescence signals via effective amplification is crucial to improve detection sensitivity and reduce detection limits.
Nanocapsules have extensive drug/gene delivery, bioimaging, catalysis, and biosensing applications [20]. Silica nanocapsules, in particular, possess strong mechanical properties, excellent biocompatibility, and versatile surface characteristics [21]. The large and hollow structure of silica nanocapsules allows for the encapsulation of optical materials within their airtight cavities [22]. This capability provides for effective fluorescence enrichment and signal amplification [21]. Previous studies have demonstrated the rapid and ultra-sensitive detection of procalcitonin [23] and staphylococcus aureus [24] using CD-encapsulated silica nanocapsules. It also exhibits excellent fluorescence amplification compared to CD-based fluorescent immunoprobes. In addition, the streptavidin (SA)-biotin biosystem is a classical signal amplification system [25]. The intense and rapid binding between SA and biotin enables them to function as a molecular connector, facilitating the sensor's recognition of the target analyte [26]. The biosystem has been utilized to enhance the sensitivity of detecting procalcitonin (PCT) [27], C-reaction protein (CRP) [28], human IgG [25]. Therefore, it is expected that the nanocapsule and SA-biotin-based biosystem is anticipated to produce a cascade amplification effect on the sensor, leading to lower detection limits and heightened sensitivity.
Immunomagnetic nanoparticles have been widely used in the construction of biosensors due to their ability to selectively recognize targets in complex samples, eliminating the need for complicated pre-processing procedures. In this study, we developed a photomagnetic interacting fluorescence immunoassay system for ultrasensitive and specific analysis of GFAP. As illustrated in Scheme 1, SA-biotin-modified immunocapsules (CDs@ONs-Ab1-biotin-SA) and immunomagnetic nanoparticles (MNPs-Ab2) were utilized as fluorescent and magnetic probes, respectively. These probes could specifically recognize and capture GFAP in complex samples, forming a sandwich immuno-couple with GFAP. Following immunomagnetic separation treatment, the fluorescence immunoassay system exhibited distinct optical responses to different concentrations of GFAP, leveraging the high fluorescence sensing ability of CDs@ONs. Notably, the fluorescence immunoassay system demonstrated low background interference, vigorous signal intensity, exceptional specificity, and high sensitivity, which enabled accurate quantitative analysis of GFAP content in blood samples. Therefore, this method shows promise for rapid clinical assessment and diagnosis of TBI.
The morphology of the prepared CDs was observed using transmission electron microscope (TEM). The results showed that CDs were uniformly dispersed in water without agglomeration and exhibited a spherical-like structure. Additionally, the TEM images revealed a graphite-like crystal structure of CDs, with a lattice spacing of 0.17 nm (Fig. S2A in Supporting information). The particle size distribution of CDs ranged from 2 nm to 4 nm, with an average particle size of 2.7 nm (Fig. S3 in Supporting information). The ultraviolet–visible (UV–vis) spectra of CDs exhibited two absorption peaks at 240 and 350 nm (Fig. S4 in Supporting information). The absorption peak at 240 nm may be attributed to the π-π* transition of C═C/C—C, while the peak at 350 nm may be associated with the n-π* transition of C═O [29]. The X-ray diffraction (XRD) analysis revealed broad diffraction peaks in the range of 15°–30° (Fig. S5 in Supporting information), which corresponded to the (002) crystal spacing of graphitic carbon [30].
The surface functional groups of CDs were determined by Fourier transform infrared (FT-IR). The absorption peaks at 3680–3278 cm−1 were attributed to the O—H and N—H stretching vibrations, respectively. The peak of 1646 cm−1 was related to the C═O stretching vibration, possibly originating from the -COOH group. The peak at 1559 cm−1 was attributed to the -NH2 group. The two peaks at 1403 and 1196 cm−1 might correspond to the C—N and C—O—C stretching vibrations, respectively (Fig. S2B in Supporting information). The hydrophilic functional groups in CDs contribute to their excellent solubility.
The X-ray photoelectron spectroscopy (XPS) analysis revealed that the composition of CDs consisted of C (67.25%), O (13.11%), and N (19.64%). The full XPS spectra of CDs, as depicted in Fig. S6 (Supporting information), exhibited three peaks at 285, 399.0, and 531 eV for C 1s, N 1s, and O 1s, respectively. Four peaks appeared, i.e., 284.3, 285.3, 286.2, and 287.5 eV on the C 1s spectrum, corresponding to C═C, C—N, C—O, and C═O, respectively [19]. Fig. S2D (Supporting information) revealed the peaks at 399.2 and 401.4 eV in the N 1s spectrum, representing amino N (N—C) and pyrrole N (C—NH2), respectively [31]. Regarding the O 1s spectrum, the two fitted peaks at 530.5 and 533.1 eV corresponded to the C═O and C—O, respectively (Fig. S2E in Supporting information).
Fig. S2F (Supporting information) showed the fluorescence spectra of CDs at different excitation wavelengths. Under excitation wavelength ranging of 320–360 nm, the CDs showed strong fluorescence emission in the blue region, with the optimal excitation condition of 350 nm, consistent with the CDs' UV spectra. The fluorescence emission peak of CDs (ca. 440 nm) did not show a clear excitation dependence due to the more homogeneous particle size of the CDs. CDs' fluorescence quantum yield (QY) was 92.5% using quinine sulfate as the standard material (Fig. S7 in Supporting information), proving that CDs had strong fluorescence properties.
In addition, the fluorescence emission of CDs was observed to vary with concentration. The peak value of fluorescence emission was found at a concentration of 0.01 mg/mL. As the concentration increased, the position of the emission peaks showed a redshift (Fig. S2G in Supporting information). Fig. S2H (Supporting information) exhibited the linear equation of CDs' fluorescence emission vs. concentration. Two linear relationships were found in the 0.002 mg/mL concentration range to 0.1 mg/mL. At concentrations below 0.01 mg/mL, each CD was not influenced by its surrounding CDs [32]. Consequently, the fluorescence emission of individual CDs dominated the overall fluorescence spectrum. The observed red shift in the fluorescence emission peak can be attributed to the strong coupling of the surface functional group.
The relationship between CDs concentration and fluorescence intensity indicated that the peak fluorescence intensity was observed at a concentration of 0.01 mg/mL. This finding was further supported by optimizing the initial concentration of CDs encapsulation (Fig. S8 in Supporting information). The morphology and structure of CDs@ONs were observed by TEM. The CDs@ONs exhibited a spherical-like structure (Fig. 1A). The particle size of CDs@ONs was relatively uniform, measuring 84 ± 5 nm (Fig. S9 in Supporting information). The elemental mapping of CDs@ONs of CDs@ONs revealed the presence of elements C, N, O, and Si (Figs. 1B–F). Furthermore, even after undergoing cyclic sonication and centrifugation, the CDs@ONs remained intact, demonstrating their structural solid stability.
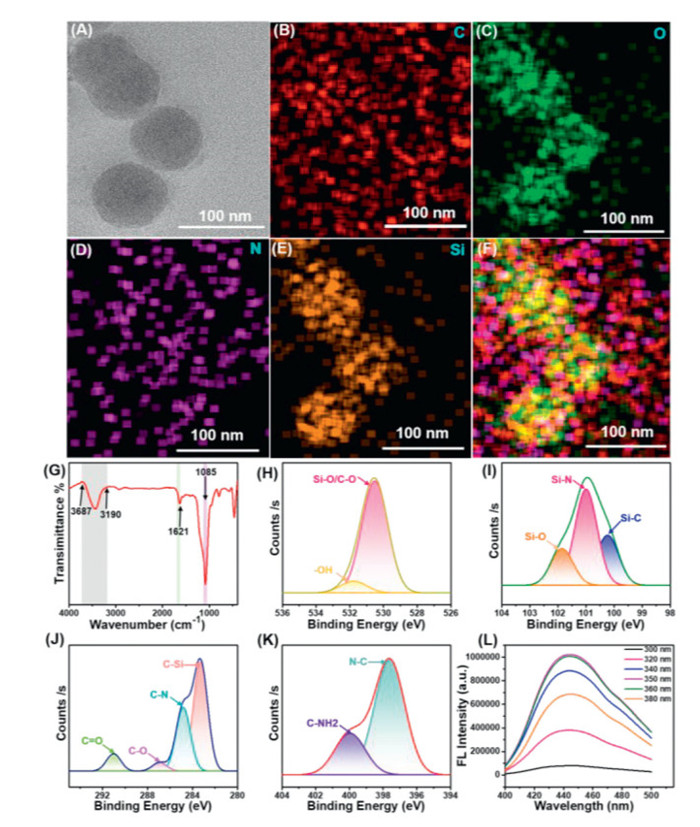
The FT-IR spectrum of CDs@ONs is shown in Fig. 1G. The absorption peaks at 3687–3190 cm−1 were attributed to the stretching vibration of O—H. The peak of 1621 cm−1 was related to the bending vibration of -NH2. The surface of CDs@ONs groups (-NH2 and -OH) contributed to the hydrophilicity of CDs@ONs. Moreover, -NH2 is a crucial reactive group for protein coupling. The absorption peak at 1089 cm−1 corresponded to the antisymmetric stretching of Si—O—Si. The XRD analysis revealed a broad diffraction peak in the 15°–30° range (Fig. S10 in Supporting information), consistent with the CDs' XRD pattern.
Five peaks appeared in the full XPS spectrum of CDs@ONs, i.e., 101, 152, 284, 399, and 531 eV, corresponding to the binding energies of Si 2p, Si 2s, C 1s, N 1s, and O 1s, respectively (Fig. S11 in Supporting information). Fig. 1H showed the 531.8 and 530.5 eV peaks in the O 1s spectrum, representing -OH and Si-O/C—O groups, respectively. Fig. 1I revealed the peaks at 101.9, 101, and 100.3 eV in the Si 2p spectrum, representing Si—O, Si—N, and Si—C groups, respectively [23]. Four peaks appeared in the C 1s spectrum, i.e., 291, 286.9, 284.8, and 283.3 eV (Fig. 1J), corresponding to C═O, C—O, C—N, and C—C/C—Si groups. Fig. 1K showed 397.6 eV and 400 eV peaks in the N 1s, corresponding to amino N(N—C) and pyrrole N(C—NH2).
Fig. 1L showed that the optimal excitation wavelength of CDs@ONs was ca. 360 nm, which was consistent with the fluorescence properties of CDs. The positions of CDs@ONs (443 nm) fluorescence emission peaks do not exhibit excitation dependence due to their uniform particle size. In addition, the fluorescence emission of CDs@ONs exhibited concentration dependence. The position of the emission peaks did not show a significant redshift with increasing concentration (Fig. S12A in Supporting information). There was linear within CDs@ONs' fluorescence emission vs. concentration (0.002–0.8 mg/mL). At concentrations below 0.8 mg/mL, each CDs@ON was an individual unit and was not influenced by its surrounding CDs@ONs. The linear increase in fluorescence emission peak with increasing concentration further confirmed that the increase in fluorescence emission is solely due to the rise in the number of CDs@ONs.
The morphology and structure of MNPs were observed by TEM. The MNPs displayed a uniform spherical (184 ± 27 nm) structure (Fig. S14 in Supporting information) and a lattice spacing of 0.21 nm (Fig. S13A in Supporting information). The elemental mappings of MNPs showed that they mainly contained the elements Fe and O (Figs. S13B–D in Supporting information). The FT-IR spectrum of MNPs is shown in Fig. S13E (Supporting information). The absorption at 3683–3058 cm−1 was attributed to the O—H stretching vibration. The peak of 1646 cm−1 was related to the -COOH group. The absorption peak at 1228 cm−1 was related to the C—OH stretching vibration of carboxylic acids, which contributed to the hydrophilicity of MNPs. In addition, -COOH is an essential reactive group for protein coupling. The 580 cm−1 peak was related to the Fe-O-Fe vibrational absorption peak of Fe3O4.
The MNPs showed typical Fe3O4 peaks at 30.1°, 35.4°, 43.1°, 53.5°, 56.9°, and 62.6°, corresponding to (220), (311), (400), (442), (511), and (440) Bragg reflections, respectively [33]. No characteristic diffraction peaks associated with other iron oxide structures were observed, indicating the absence of other iron-based compounds in the MNPs. The MNPs exhibited magnetic solid properties, with a saturation magnetization intensity of 63.6 emu/g (Fig. S13G in Supporting information). The MNPs could be collected within 25s using magnetic separation (Fig. S15 in Supporting information), allowing easy separation and collection of the serial MNPs for subsequent experiments.
To precisely capture and recognize GFAP, the nanocapsules and MNPs were modified by antibodies, and CDs@ONs-Ab1 and MNPs-Ab2 were prepared. Fig. 2A showed the TEM image of the CDs@ONs-Ab1, revealing some CDs@ONs tightly bound to the antibody surface. Figs. 2B–F showed the elemental mappings of CDs@ONs-Ab1, demonstrating that CDs@ONs composed of C, N, O, and Si elements were embedded in the C skeleton of Ab1. Furthermore, the absence of separation between Ab1 and CDs@ONs following cycled ultrasonic treatment suggests a relatively tight combination of Ab1 and CDs@ONs. These findings provide preliminary evidence of the successful acquisition of CDs@ONs-Ab1.
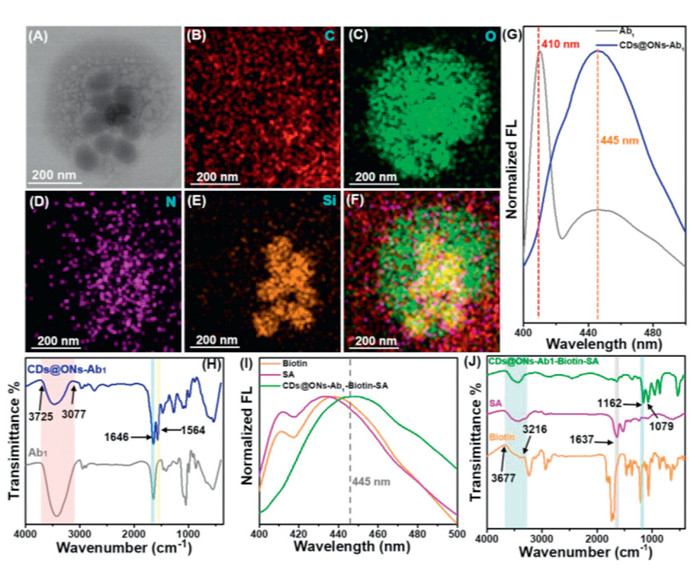
To further demonstrate Ab1, modifications of CDs@ONs, FL, and FT-IR were performed. The CDs@ONs-Ab1 exhibited two characteristic peaks of fluorescence emission (410, 445 nm). The emission peak at 410 nm corresponded to Ab1, while the peak at 445 nm corresponded to CDs@ONs (Fig. 2G, Fig. S16A in Supporting information). The absorption peaks at 3725–3077 cm−1 were attributed to the O—H stretching vibration, which was consistent with the peak pattern of CDs@ONs. Two firm absorption peaks at 1646 and 1564 cm−1 indicated the generation of amide bonds, further confirming the successful preparation of CDs@ONs-Ab1.
The FL and FT-IR analyses of SA-Biotin modified CDs@ONs-Ab1 were demonstrated in Figs. 2I and J. SA and Biotin exhibited two distinct fluorescence emission peaks at ca. 410 nm and 435 nm. CDs@ONs-Ab1-Biotin-SA showed a fluorescence emission peak at 445 nm, consistent with the peak pattern of CDs@ONs, which suggested that CDs@ONs-Ab1-Biotin-SA had superior fluorescence properties. The absorption peaks at 3677–3216 cm−1 were attributed to the O—H stretching vibration, with the peak pattern of CDs@ONs-Ab1 and SA. The absorption peaks at 1637 cm−1 might be consistent with CDs@ONs-Ab1 and SA. The absorption peaks at 1162 cm−1 were attributed to the C—O-H stretching vibration, which was consistent with the peak pattern of biotin. The absorption peaks at 1079 cm−1 might be caused by CDs@ONs.
Fig. S17A (Supporting information) displayed the TEM image of the MNPs-Ab2, revealing a significant number of MNPs firmly bound to the antibody surface. Two distinct cross-bound crystalline patterns were identified, with measured lattice spacings of 0.21 nm and 0.27 nm, corresponding to MNPs and Ab2, respectively. Figs. S17B–F (Supporting information) exhibited the elemental mappings of MNPs-Ab2, demonstrating that MNPs nanoparticles composed of Fe and O elements were embedded in the C skeleton of Ab2. Notably, there was no discernible separation between Ab2 and MNPs following cyclic sonication and magnetic fraction washing treatment, affirming the tight combination of Ab2 and MNPs.
To further validate the Ab2 modification of MNPs, FL and FT-IR of MNPs-Ab2 were performed. The MNPs-Ab2 exhibited two distinct fluorescence emission peaks at 410 and 435 nm. The peak at 410 nm corresponded to the emission peak of Ab2, while the peak at 435 nm corresponded to the emission peaks of both MNPs and Ab2 (Figs. S17G and S16B in Supporting information). The FT-IR pattern of MNPs-Ab2 demonstrated that the absorption peaks at 3698–3022 cm−1 were similar to the sharp absorption peak type of MNPs. Additionally, an absorption peak at 1564 cm−1 indicated the formation of an amide bond between MNPs and Ab2 (Figs. S17H and S18 in Supporting information).
To determine the optimal reaction time of GFAP and the immunoprotein, we performed magnetic separation to separate the immunoprobe and antigen in serial time gradient. Under 350 nm excitation, the emission spectra were measured within 400–500 nm. As shown in Figs. 3A and B, it was found that the fluorescence intensity undergoes significant changes during the first 0–20 min and tends to level off after 20 min. Additionally, there is no significant difference in fluorescence intensity between 30 min and 40 min (Fig. S19 in Supporting information). Consequently, it was concluded that 30 min was sufficient for GFAP and the immunoprobes to bind to.

We compared the effects of CDs-Ab1, CDs@ONs-Ab1, and CDs@ONs-Ab1-biotin-SA. Figs. 3C and D showed the GFAP sensing outcomes of the three probes. The CDs@ONs-Ab1 and CDs@ONs-Ab1-biotin-SA exhibited different degrees (2.03- and 3.6-fold) of fluorescence amplification compared to CDs-Ab1. The nanocapsule contained a substantial quantity of CDs, leading to an increased number of labeled CDs on the antibody surface. This was the primary factor behind the observed amplification of fluorescence signals in CDs@ONs-Ab1. Additionally, the distinctive structure of SA contributes to a secondary amplification effect on fluorescence signals in CDs@ONs-Ab1-biotin-SA. This confirmed the superior sensing ability of CDs@ONs-Ab1-biotin-SA.
To evaluate the sensing ability of CDs@ONs-Ab1-biotin-SA and MNPs-Ab2 for various concentrations of GFAP, fluorescence spectra were initially simulated in phosphate buffered saline (PBS, 0.1 mol/L, pH 7.4) environment (Fig. 4A). The MNPs-Ab2 specifically recognized and captured GFAP, while CDs@ONs-Ab1-biotin-SA also exhibited specific recognition of GFAP. It was demonstrated that the fluorescence intensity of CDs@ONs-Ab1-biotin-SA displayed a concentration-dependent relationship with GFAP. Fig. 4B showed that the fluorescence intensity ratio (F/F0) vs. GFAP concentration (10 pg/mL–10 ng/mL) was well-fitted with a linear equation of y = 0.0069x + 1.9 (n = 3, R2 = 0.99), and a limit of detection (LOD) of 2.2 pg/mL (by 3δ/slope).
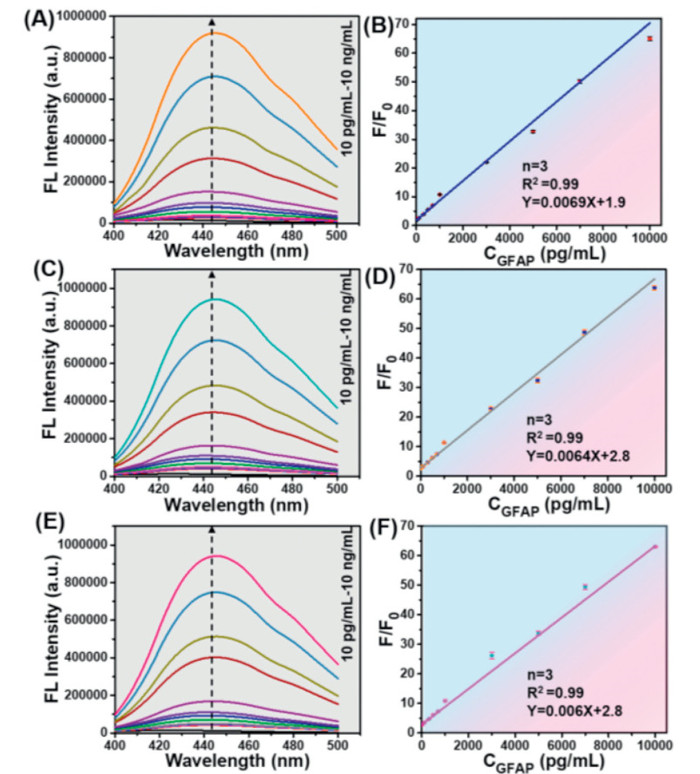
As shown in Figs. 4C and E, the CDs@ONs-Ab1-biotin-SA also showed the concentration dependence of GFAP in rabbit blood sample blood samples (10 pg/mL–10 ng/mL). As Figs. 4D and F demonstrated, two linear equations of y = 0.0064x + 2.8 (n = 3, R2 = 0.99) and y = 0.006x + 2.8 (n = 3, R2 = 0.99) were fitted for F/F0 vs. GFAP concentration (10 pg/mL–10 ng/mL) in serum and plasma environment, respectively. The LOD were 3.2 and 3.6 pg/mL, respectively. The LODs were lower compared to a previous study (Table S1 in Supporting information). The immunoprobes in the blood sample demonstrated excellent immunorecognition (R2 = 0.99). Furthermore, the immunoprobes specifically recognized and captured GFAP in the blood sample, yielding results consistent with those obtained in the PBS environment. This highlights the high specificity and resistance to background interference of immunoprobes.
The recoveries in the three environments were 99.4%–100.4%, 96%–102.6%, and 93.2%–110.2%, respectively (Table S2 in Supporting information). The higher recoveries indicated the fluorescence immunoassay system's reliability and high detection accuracy for quantitatively detecting GFAP. Therefore, the fluorescence immunoassay system might be effectively used for ultrasensitive and specific detection of GFAP, providing an essential basis for assessing GFAP detection and TBI grading in clinical practice.
Reproducibility, specificity, and stability are essential indicators for evaluating the application value of immunoprobes. To assess the reproducibility of immunoprobes, three batches of immunoprobes were freshly made. Treating three batches of immunoprobes with 6 ng/mL of GFAP, the relative standard error was approximately 1.7% (Fig. S20A in Supporting information), indicating good reproducibility of the immunoprobes. To evaluate the specificity of the immunoprobes, we assessed the interference of various potential interfering species, i.e., carcinoembryonic antigen (CEA), prostate-specific antigen (PSA), bovine serum albumin (BSA), C-reactive protein (CRP), GFAP, and their mixtures, on the detection system. The concentration of interfering species was 10 times that of the target detection molecule, GFAP (Fig. S20B in Supporting information). The presence of these interfering species had no significant effect on the detection of GFAP (0.5 ng/mL) detection, demonstrating the high specificity of the developed immunoprobes for GFAP detection and selective recognition. Furthermore, stability is another crucial indicator of practical performance. After 7 days (4 ℃), F/F0 only decreased by 3.2% compared to the fresh immunoprobe (Fig. S20C in Supporting information), indicating favorable stability of the immunoprobes.
In this study, a novel fluorescence signal cascade amplification detection system has been successfully developed. Based on SA-biotin-modified immunocapsules and immunomagnetic nanoparticles, the fluorescence immunoassay system allowed for the rapid, specific, and ultrasensitive detection of pg levels of GFAP in blood samples. The experimental parameters were optimized to obtain a fluorescence signal efficiently amplified nanocapsule with an ideal encapsulation of CDs. Furthermore, the fluorescence signal was further amplified via SA-biotin modification, resulting in the more pronounced fluorescent signal of the fluorescent immunoprobe. This fluorescent signal cascade amplification effect improved the immunoprobe's ability to sense and analyze GFAP. The fluorescence immunoassay system demonstrated an outstanding detection of GFAP in blood samples within a concentration range of 10 pg/mL–10 ng/mL, with detection limits of 3.2 pg/mL (serum) and 3.6 pg/mL (plasma). The high recovery rate ensured the accuracy of the immunoassay. The fluorescence immunoassay system also displayed increased resistance to background interference, excellent specificity, and favorable stability. Therefore, the novel fluorescence immunoassay system holds great potential for clinical application. It may be used to quantify protein biomarker levels in TBI rapidly.
The authors declare that they have no known competing financial interests or personal relationships that could have appeared to influence the work reported in this paper.
Bo Liu: Conceptualization, Data curation, Formal analysis, Investigation, Software, Visualization, Writing – review & editing. Shuaiqiang Shao: Conceptualization, Data curation, Formal analysis, Writing – review & editing. Junjie Cai: Formal analysis, Investigation, Software, Visualization. Zijian Zhang: Software, Visualization. Feng Tian: Writing – review & editing. Kun Yang: Formal analysis, Funding acquisition, Investigation, Methodology, Project administration, Writing – review & editing. Fan Li: Formal analysis, Investigation, Methodology, Supervision, Validation, Visualization, Writing – review & editing.
This work was supported by the AMS Funding Project (No. ZZB2023C7010).
Supplementary material associated with this article can be found, in the online version, at doi:
J.J. Bazarian, Ann. Emerg. Med. 70 (2017) S2.
M.Y. Mahan, M. Thorpe, A. Ahmadi, et al., World. Neurosurg. 128 (2019) e434–e444. doi: 10.1016/j.wneu.2019.04.170
K. Singh, R. Trivedi, M.M. Devi, et al., Exp. Neurol. 275 (2016) 427–435. doi: 10.1016/j.expneurol.2015.07.016
P.E. Vos, B. Jacobs, T.M.J.C. Andriessen, et al., Neurology 75 (2010) 1786–1793. doi: 10.1212/WNL.0b013e3181fd62d2
M. Jović, D. Prim, O. Righini, et al., Sens. Diagn. 2 (2023) 964–975. doi: 10.1039/d3sd00090g
S. Khetani, R. Salahandish, J.B. Tabor, et al., ACS Biomater. Sci. Eng. 9 (2023) 3556–3569. doi: 10.1021/acsbiomaterials.3c00048
M. Amoo, J. Henry, P.J. O'Halloran, et al., Neurosurg. Rev. 45 (2021) 1171–1193. doi: 10.1007/s10143-021-01678-z
D.M. Stanca, I.C. Mărginean, O. Sorițău, et al., J. Cell. Mol. Med. 19 (2015) 2253–2261. doi: 10.1111/jcmm.12614
P. Zheng, S. Kasani, W. Tan, et al., Anal. Chim. Acta 1203 (2022) 339721. doi: 10.1016/j.aca.2022.339721
A. Abdelhak, M. Foschi, S. Abu-Rumeileh, et al., Nat. Rev. Neurosci. 18 (2022) 58–172. doi: 10.1038/s41582-021-00616-3
Y. Ma, G. Xu, F. Wei, et al., Nanotechnology 29 (2018) 145501. doi: 10.1088/1361-6528/aaabea
M. Ghirardello, R. Shyam, X. Liu, et al., Nanoscale. Adv. 4 (2022) 1770–1778. doi: 10.1039/d2na00060a
M. Fang, B. Wang, X. Qu, et al., Chin. Chem. Lett. 35 (2024) 108423. doi: 10.1016/j.cclet.2023.108423
B. Wang, G.I.N. Waterhouse, S. Lu, Trends Chem. 5 (2023) 76–87. doi: 10.1016/j.trechm.2022.10.005
S. Durrani, J. Zhang, Mukramin, et al., ACS Appl. Nano Mater. 6 (2022) 76–85.
L. Gogianu, M.C. Popescu, B.S. Vasile, et al., Appl. Surf. Sci. 636 (2023) 157878. doi: 10.1016/j.apsusc.2023.157878
Y. Li, Y. Ren, Z. Yi, et al., Heliyon 9 (2023) e22674. doi: 10.1016/j.heliyon.2023.e22674
C.I. Weng, H.T. Chang, C.H. Lin, et al., Biosens. Bioelectron. 68 (2015) 1–6. doi: 10.1016/j.bios.2014.12.028
A. Gaikwad, M. Joshi, K. Patil, et al., ACS Appl. Bio Mater. 2 (2019) 5829–5840. doi: 10.1021/acsabm.9b00795
W. Yim, K. Takemura, J. Zhou, et al., ACS Nano 16 (2021) 683–693. doi: 10.1021/acsnano.1c08178
Y. Zhang, B.Y. Hsu, C. Ren, et al., Chem. Soc. Rev. 44 (2015) 315–335. doi: 10.1039/C4CS00199K
Z. Chen, T. Liao, L. Wan, Y. Kuang, et al., Nano Res. 14 (2021) 4264–4273. doi: 10.1007/s12274-021-3624-4
B. Liu, S. Lu, K. Yang, X. Dou, et al., Chem. Eng. J. 472 (2023) 145038. doi: 10.1016/j.cej.2023.145038
L. Yang, W. Deng, C. Cheng, et al., ACS Appl. Mater. Interfaces 10 (2018) 3441–3448. doi: 10.1021/acsami.7b18714
H. Yang, X. Zhao, Z. Zhang, et al., Talanta 246 (2022) 123496. doi: 10.1016/j.talanta.2022.123496
N. Xia, Z. Sun, F. Ding, et al., ACS Sens. 6 (2021) 1166–1173. doi: 10.1021/acssensors.0c02415
X. Xu, X. Song, R. Nie, et al., Talanta 205 (2019) 120089. doi: 10.1016/j.talanta.2019.06.089
X.M. Wang, S. Li, L.H. Li, et al., Anal. Biochem. 657 (2022) 114915. doi: 10.1016/j.ab.2022.114915
Y. Zhang, X. Liu, Y. Fan, et al., Nanoscale 8 (2016) 15281–15287. doi: 10.1039/C6NR03125K
H. Amir, V. Subramanian, S. Sornambikai, et al., Bioelectrochemistry 155 (2024) 108589. doi: 10.1016/j.bioelechem.2023.108589
J. Chen, C. Mao, H. Ye, et al., Spectrochim. Acta. A. Mol. Biomol. Spectrosc. 305 (2024) 123459. doi: 10.1016/j.saa.2023.123459
F. Zhao, Z. Liu, S. Sui, et al., Spectrochim. Acta. A. Mol. Biomol. Spectrosc. 294 (2023) 122542. doi: 10.1016/j.saa.2023.122542
S. Scurti, S. Dattilo, D. Gintsburg, et al., ACS Omega 7 (2022) 10775–10788. doi: 10.1021/acsomega.2c00558

Figure 1 Physicochemical properties analysis of CDs@ONs. (A) The TEM image of CDs@ONs. (B–F) The elemental mapping of CDs@ONs. (G) The FT-IR spectrum of CDs@ONs. (H) The O 1s spectrum of CDs@ONs. (I) The Si 2p spectrum of CDs@ONs. (J) The C 1s spectrum of CDs@ONs. (K) The N 1s spectrum of CDs@ONs. (L) The fluorescence spectra of CDs@ONs.

Figure 2 Physicochemical properties analysis of CDs@ONs-Ab1 and CDs@ONs-Ab1-biotin-SA. (A) The TEM image of CDs@ONs-Ab1. (B–F) The elemental mapping of CDs@ONs-Ab1. (G) The fluorescence spectra of Ab1, CDs@ONs-Ab1. (H) The FT-IR spectra of Ab1 and CDs@ONs-Ab1. (I) The fluorescence spectra of biotin, SA, and CDs@ONs-Ab1-biotin-SA. (J) The FT-IR spectra of biotin, SA, and CDs@ONs-Ab1-biotin-SA.

Figure 3 Analysis of immunoreaction time and fluorescence signal amplification effect. (A) The fluorescence spectra of CDs@ONs-Ab1-biotin-SA within different immunoreaction times. (B) The fluorescence peak of CDs@ONs-Ab1-biotin-SA vs. immunoreaction time. (C) The fluorescence spectra of CDs-Ab1, CDs@ONs-Ab1, and CDs@ONs-Ab1-biotin-SA for detection 4 ng/mL of GFAP. (D) Comparison of the fluorescence emission peaks of CDs-Ab1, CDs@ONs-Ab1, and CDs@ONs-Ab1-biotin-SA.

Figure 4 Detection of GFAP in PBS, serum, and plasma (rabbit serum and plasma were obtained from the Animal Center of Tianjin Medical Research Institute). (A) Fluorescence emission spectra of immunoprobes incubated with increasing concentrations of GFAP in PBS. (B) The linear fitting plot of F/F0 vs. GFAP concentration (n = 3). (C) Fluorescence emission spectra of immunoprobes, incubated with increasing concentrations of GFAP in serum. (D) The linear fitting plot of F/F0 vs. GFAP concentration (n = 3). (E) Fluorescence emission spectra of immunoprobes, incubated with increasing concentrations of GFAP in plasma. (F) The linear fitting plot of F/F0 vs. GFAP concentration (n = 3).

 扫一扫看文章

扫一扫关注我们
 DownLoad:

 下载:
下载: