
Scheme 1.
Synthesis of EP-COF.
A luminescent one-dimensional covalent organic framework for organic arsenic sensing in water
Chao Liu , Chao Jia , Shi-Xian Gan , Qiao-Yan Qi , Guo-Fang Jiang , Xin Zhao

Arsenic contamination in water environments poses a significant threat to human health in many parts of the world [1–3]. Long-term exposure to arsenic-contaminated water can lead to many health issues, including skin, respiratory, cardiovascular, neurological, gastrointestinal, endocrine and hematopoietic system diseases, and even can result in cancer or death [4–7]. Over the past few decades, extensive research has been conducted for the detection and removal of arsenic [8–10]. However, most of these studies have focused on inorganic arsenic, while little attention has been paid to organic arsenic species [11–14]. Organic arsenic compounds are widely used in agriculture and animal husbandry as pesticides, feed additives, and antibiotics. Roxarsone (ROX), specifically 4‑hydroxy-3-nitrophenylarsenic acid, is a multifunctional organic arsenic compound widely used to promote the growth of livestock and poultry, improve the feed conversion rate, increase the anticoccidial effect, and promote the deposition of animal pigments, due to its low price [15–18]. However, ROX has limited metabolic transformation within animals, leading to its excretion into soil and water environment through animal waste. Although ROX is less toxic to ecosystems and humans than inorganic arsenic, it can easily transform into highly toxic inorganic arsenic through a series of chemical changes, and thus endangers the ecological environment and human life [19,20]. Therefore, the need for efficient detection of ROX in wastewater is urgent. Currently, the methods for ROX detection mainly include high performance liquid chromatography (HPLC), solid phase microextraction (SPME), ion chromatography combined with inductively coupled plasma mass spectrometry (IC-ICP-MS), and electrochemical sensing [13,21–25]. While these methods are effective, they also have some shortcomings such as high equipment cost, complicated sample preparation, and limited sensitivity. Therefore, the development of new detection methods is of great significance. In this context, fluorescence sensing become a promising approach by offering the advantages including strong visual recognition ability, rapid response, and high selectivity [26–29].
Covalent organic frameworks (COFs) are a class of crystalline porous polymers composed of organic building blocks connected by dynamic covalent bonds [30–32]. They have aroused strong interest of researchers because of their great application potential in gas storage and separation [33], energy storage [34], proton conduction [35], drug delivery [36], optoelectronic devices [37], environmental management [38], sensing [39] and catalysis [40], which stems from their large specific surface areas, long-range conjugation, and customizable pore architectures. Since the emergence of COFs in 2005 [41], the research has been overwhelmingly focused on two-dimensional (2D) COFs and three-dimensional (3D) COFs, and there are only a few research on the designed synthesis and application of one-dimensional (1D) COFs [42–47]. Nonetheless, 1D COFs have distinctive structural features from 2D and 3D COFs, as their building blocks are only covalently linked in one dimension. Such structural characteristic endows 1D COFs with a potential for dispersion which is beneficial for chemical sensing. Herein, we report the design, synthesis, and characterization of a novel 1D COF (EP-COF), and its application as a fluorescent probe for ROX sensing in wastewater. It exhibits remarkable selectivity and high sensitivity in ROX sensing experiments, providing a promising solution for the detection of ROX in wastewater.
EP-COF was designed by incorporation of two fluorophores, tetraphenyl ethylene and carbazole, to enhance its fluorescence. The introduction of hydroxyl groups onto the inner wall of the pores not only functions as a recognition site for ROX but also improves hydrophilicity of the COF. EP-COF was synthesized through the solvothermal reaction of 4′,4′′′,4′′′′′,4′′′′′′′-(ethene-1,1,2,2-tetrayl)tetrakis(([1,1′-biphenyl]−4-amine)) (ETTBA) and 4,4′-(9-propyl-9H-carbazole-3,6-diyl)bis(2-hydroxybenzaldehyde) (PCDBH) (Scheme 1). In order to elucidate the crystal structure of EP-COF, the as-synthesized material was characterized with powder X-ray diffraction (PXRD) technique. On the other hand, unit cells of various possible COF structures were established using Materials Studio 7.0 software, by which their theoretical powder diffraction patterns were simulated and then compared with the experimentally observed PXRD pattern. There are two possible framework structures in the theoretical simulations, namely one-dimensional structure (Scheme 1) and two-dimensional structure (Fig. S1 in Supporting information). For each of them, two typical stacking models, overlapping (AA) stacking and staggered (AB) stacking, were considered and denoted as 1D-AA and 1D-AB, and 2D-AA and 2D-AB (Fig. S2 in Supporting information), respectively. Comparing the experimental PXRD data with the simulated PXRD patterns of 1D-AA, 1D-AB, 2D-AA, and 2D-AB, it could be found that the main peak positions of 1D-AB, 2D-AA, and 2D-AB significantly deviated from the main peak positions of the experimental data, indicating poor matching. In contrast, only the main peak position of 1D-AA has a high degree of coincidence with those of the experimental data (Fig. S3 in Supporting information). Therefore, the 1D-AA model appeared to be the most consistent with the structure of EP-COF. On the basis of the experimental PXRD pattern of EP-COF (Figs. 1a and b), Pawley refinement yielded the unit cell parameters of a = 28.48 Å, b = 28.10 Å, c = 4.48 Å, α = β = 90°, γ = 120°, with Rp = 2.11%, Rwp = 3.54%.
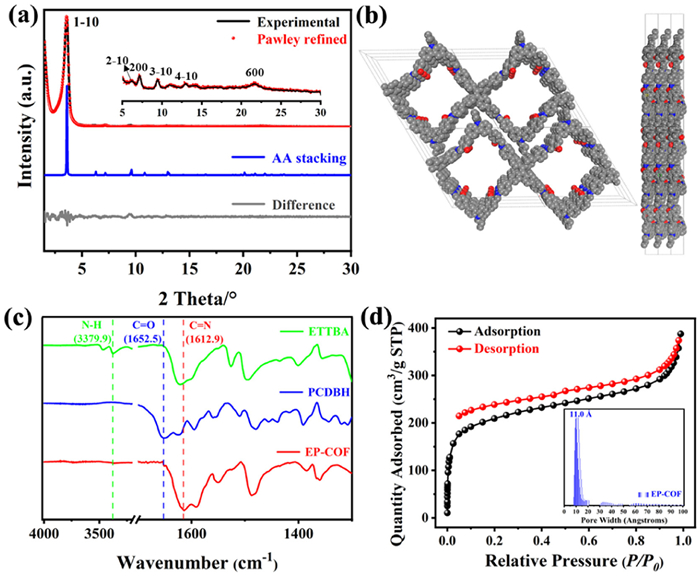
Fourier transform infrared (FT-IR) spectroscopy was used to characterize the functional groups in EP-COF. In its FT-IR spectrum (Fig. 1c), the characteristic peak at 1612.9 cm−1 corresponds to the C=N bond stretching vibration of the imine in EP-COF. Notably, unlike the typical C=N stretching vibration in common COFs which generally appears around 1625 cm−1, the lower wavenumber of the imine bond in EP-COF was attributed to the presence of a hydroxyl group on the benzene ring adjacent to the imine, which can form an intermolecular hydrogen bond between them [48,49]. In addition, the characteristic peaks corresponding to the stretching vibration of the amino group of ETTBA (3379.9 cm−1) and the vibration band of the aldehyde group of PCDBH (1652.5 cm−1) decrease significantly after their condensation reaction, suggesting that the polymerization degree of EP-COF is high. To further confirm the structure of EP-COF, its solid-state 13C cross polarization magic angle spinning (CP-MAS) NMR spectrum was collected, in which the chemical shift of imine carbon appears at 161.95 ppm (Fig. S4 in Supporting information), further proving the existence of imine bond in EP-COF. In addition, several peaks were observed in the range of 50–10 ppm, which are assigned to the alkyl carbon atoms attached to the carbazole N. Elemental analysis (EA) of EP-COF showed that the values of C, H, and N were close to the elemental composition of a single unit cell in the COF (Table S1 in Supporting information). Thermal stability of the EP-COF was assessed by thermogravimetric analysis (TGA) under N2 atmosphere. As revealed by the TGA traces, EP-COF showed less than 5% weight loss when the temperature increases from room temperature to 343 ℃ (Fig. S5 in Supporting information), indicating it had high thermal stability. The morphology of EP-COF was investigated with scanning electron microscopy (SEM) and transmission electron microscopy (TEM). SEM images presented an irregular micron-sized densely packed rod-like morphology (Fig. S6 in Supporting information), while TEM images revealed a random layer-by-layer aggregation (Fig. S7 in Supporting information).
The porosity of EP-COF was evaluated by nitrogen adsorption and desorption experiments. Its N2 adsorption-desorption isotherm exhibits good reversibility and a steep nitrogen adsorption in the low-pressure range (P/P = 0–0.01) (Fig. 1d), indicating that EP-COF has microporous feature. The pore size distribution (PSD) of the COF was estimated using nonlocal density functional theory (NLDFT), which revealed a dominant pore size distribution around 11.0 Å, in consistence with the theoretical aperture (11.8 Å) (Fig. S8 in Supporting information). Based on the N2 isotherm adsorption data in the low-pressure range (P/P = 0.01–0.10), the Brunauer-Emmett-Teller (BET) specific surface area of EP-COF (Fig. S9 in Supporting information) was calculated to be 780 m2/g, indicating its high porosity.
Since EP-COF contains two types of fluorescent moieties, its fluorescence emission is supposed to be greatly enhanced. Furthermore, compared with 2D COFs, the covalent bonding in EP-COF only extend in one-dimensional direction to form nanobelts. The weak interactions among the nanobelts should result in good dispersibility of EP-COF in water. On the other hand, ROX contains -AsO(OH)2 and -NO2. The former is capable of forming hydrogen bonds with EP-COF, while the latter can effectively quench the fluorescence of the COF. Therefore, theoretically EP-COF can serve as fluorescent sensing material for the detection of ROX. To explore such a potential, the stability of EP-COF was firstly investigated by dispersing it in various solutions (12 mol/L HCl, 12 mol/L NaOH, trifluoroacetic acid (TFA), and deionized water), with the suspension being dispersed with ultrasonic for 2 h and stirred at room temperature for 72 h. The stability of EP-COF remained high under neutral and acidic conditions, but significantly decreases under the strong alkaline condition, as revealed by comparing their PXRD patterns with the original one (Fig. S10 in Supporting information). The solid-state UV–vis spectrum of EP-COF showed a wide light absorption up to ca. 550 nm (Fig. S11 in Supporting information). The fluorescence emission spectra of ETTBA, PCDBH, and EP-COF in water was recorded. The spectra indicated that the emission of EP-COF exhibits an obvious red shift compared with that of ETTBA and PCDBH (Fig. S12 in Supporting information), confirming the formation of a large conjugated structure [50,51]. Time-correlated single-photon counting (TCSPC) measurements indicated a lifetime of 0.57 ns, with an absolute photoluminescence quantum yield of 1.09% for the solid EP-COF (Figs. S13 and S14 in Supporting information).
The sensing behavior of EP-COF toward ROX was investigated by introducing different amounts of ROX into the aqueous suspension of EP-COF and recording the changes of fluorescence emission. As shown in Fig. 2a, the fluorescence intensity of the suspension decreased significantly with the increase of ROX concentration. Specifically, the fluorescence intensity decreased by more than 90% when the concentration of ROX increased from 0 µmol/L to 40 µmol/L (Fig. S15 in Supporting information). Moreover, the concentration of ROX has a good linear relationship with the fluorescence intensity (Fig. S16 in Supporting information). And the quenching efficiency of ROX for EP-COF reaches 92.3%. The fluorescence quenching efficiency was quantified by the Stern-Volmer (SV) equation: (I0/I)−1 = Ksv[Q], where I0 represents the initial fluorescence intensity without the addition of the test substance, I represents the fluorescence intensity after adding the test substance, Ksv refers to the quenching constant, and Q refers to the concentration of the test substance. The SV map shows that EP-COF has a good linear relationship for the ROX (R2 = 0.997) at low concentrations (0~2.5 µmol/L) (Fig. 2b and Figs. S17 and S18 in Supporting information), and the quenching constant is estimated to be 3.45 × 10⁴ L/mol. The limit of detection (LOD) was calculated on the quenching constant and the standard deviation, using the formula LOD = 3σ/Ksv, where σ is the standard deviation of the fluorescence measurements of the blank solution, and Ksv is the quenching constant. It was determined that the detection limit of ROX by EP-COF was 4.5 nmol/L, which is much lower than the safety standard of ROX (19 nmol/L) stipulated by the World Health Organization, demonstrating a very high sensitivity. In contrast, the fluorescence intensity of the ETTBA and PCDBH suspensions only slightly diminished with the addition of ROX. Even by adding 100 µmol/L ROX, the fluorescence quenching efficiencies were only 10.4% and 17.0% for ETTBA and PCDBH, respectively (Figs. S19 and S20 in Supporting information).
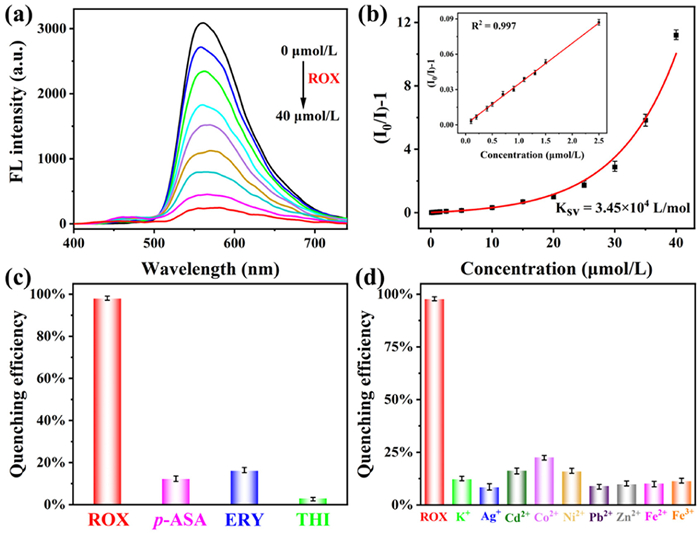
In farm wastewater, ROX often coexists with other antibacterial drugs and metal ions that could potentially interfere with the detection of ROX. Thus, it is essential to assess and mitigate such interference. Anti-interference tests were conducted on EP-COF using some typical antibacterial additives in animal feed, such as erythromycin (ERY), thiamphenicol (THI), and p-arsanilic acid (p-ASA). These organic compounds were individually introduced into the suspension of EP-COF, and fluorescence measurements were carried out. Subsequently, ROX was added to the cuvette and the tests were repeated. The changes in fluorescence intensity before and after the addition of ROX were compared (Fig. S21 in Supporting information). It was observed that upon the addition of p-ASA, ERY, and THI, the fluorescence intensity of the suspension just displays slight decreases compared with the initial state. In contrast, the fluorescence emission of the COF was almost quenched after the introduction of ROX. The quenching efficiency of EP-COF by each of the organic compounds was calculated (Fig. 2c). It can be seen that the quenching efficiency of p-ASA, ERY, and THI was below 20%, while it was 97.9% for ROX. This result demonstrates that the presence of p-ASA, ERY, and THI has little interference on the detection of ROX, indicating that EP-COF has good selectivity for ROX.
Anti-interference tests were also performed for common metal ions, including K+, Ag+, Cd2+, Co2+, Ni2+, Pb2+, Zn2+, Fe2+, and Fe3+. The procedure is similar to that for the organic compounds above. Metal salts were individually added into the aqueous suspension of EP-COF, and the fluorescence tests were carried out. After that ROX was introduced and the fluorescence emission spectra were recorded again. The analysis of the fluorescence emission spectra revealed that intensity of the suspension decreased upon the addition of the metal salts but just to a small extent, with their quenching efficiency below 30%, much lower than that of ROX (97.7%) (Fig. 2d). Notably, after the addition of ROX, the fluorescence emission of EP-COF almost disappeared (Fig. S22 in Supporting information). These results indicate that the presence of the aforementioned metal ions exerts minimal interference on the detection of ROX, further confirming the high selectivity of EP-COF toward ROX.
As a fluorescent probe, it is crucial not only to exhibit high sensitivity and good selectivity, but also to possess high stability in use. To access the stability of EP-COF, the aqueous suspension of EP-COF was left at room temperature for 15 days and then its fluorescence emission behavior was examined. The experimental result shows that the intensity of the fluorescence emission almost keep constant (Figs. S23 and S24 in Supporting information), indicating a high stability of EP-COF. Moreover, the fluorescence intensity of EP-COF slightly decreased (Fig. S25 in Supporting information). Meanwhile, the fluorescence quenching efficiency retained over 90% after five cycle experiments (Figs. S26 and S27 in Supporting information). The above results demonstrate an outstanding reusability and cyclic stability of EP-COF.
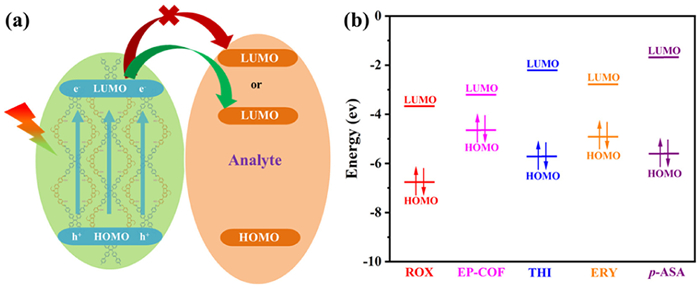
To elucidate the reasons behind the high sensitivity and selectivity of EP-COF for ROX detection, the UV–vis absorption of ROX and the fluorescence spectrum of EP-COF were compared, which showed no overlap. Therefore, the fluorescence quenching by energy transfer between them could be excluded (Fig. S28 in Supporting information) [52]. Molecular orbital (MO) calculations were performed for ROX, EP-COF, THI, ERY, and p-ASA, respectively, to shed light on the fluorescence quenching mechanism. ROX contains nitro group which has a strong electron-withdrawing effect, making it electron-deficient and prone to undergo photo-induced electron transfer (PET) process, which usually leads to fluorescence quenching. Generally, when the energy of the lowest unoccupied molecular orbital (LUMO) of the COF is higher than that of the analyte, the excited COF acts as an electron donor and the analyte acts as an electron acceptor [14,53,54]. Upon excitation by light of a specific wavelength, electrons in the excited state are transferred from the COF to the analyte, resulting in fluorescence quenching (Fig. 3a). As shown in Fig. 3b, the LUMO levels of THI, ERY, and p-ASA are all higher than that of EP-COF, implying that electronic transitions from excited COFs to these analytes are thermodynamically unfavorable, resulting in poor fluorescence responsiveness (Table S2 in Supporting information). In contrast, the LUMO energy level of ROX is lower than that of EP-COF, and electronic transition from the excited COF to ROX is thermodynamically feasible, thereby leading to the fluorescence quenching (Fig. 3b, and Figs. S29 and S30 in Supporting information). Based on these calculations, the response and high selectivity of EP-COF to ROX can be explained by the electron transfer mechanism between the donor (EP-COF) and the acceptor (ROX). In addition, DFT calculations suggest that the hydroxyl groups can generate hydrogen bonding interactions between the COF and ROX, as well as improve hydrophilicity (Section D, Supporting information).
In conclusion, we have designed and synthesized a 1D COF as an efficient fluorescent sensor to detect ROX in water. The COF achieves a remarkable fluorescence quenching efficiency of 97.9%, with a LOD of 4.5 nmol/L. Moreover, it also exhibits a high selectivity for ROX in the presence of other organic compound and various metal ions. The remarkable performance of EP-COF in ROX detection can be attributed to its well-ordered 1D framework structure, high porosity, abundant detection sites, and outstanding stability in aqueous environments. With the combination of the high sensitivity, selectivity, and stability, this research presents a convenient method for detecting ROX, highlighting the potential of this emerging crystalline 1D porous materials in various applications.
The authors declare that they have no known competing financial interests or personal relationships that could have appeared to influence the work reported in this paper.
We thank the Science and Technology Commission of Shanghai Municipality (No. 20JC1415400) for financial support.
Supplementary material associated with this article can be found, in the online version, at doi:
L. Rodríguez-Lado, G. Sun, M. Berg, et al., Science 341 (2013) 866–868. doi: 10.1126/science.1237484
B.K. Mandal, K.T. Suzuki, Talanta 58 (2002) 201–235. doi: 10.1016/S0039-9140(02)00268-0
J. Bundschuh, N.K. Niazi, M.A. Alam, et al., J. Hazard. Mater. 436 (2022) 129197. doi: 10.1016/j.jhazmat.2022.129197
M. Tolins, M. Ruchirawat, P. Landrigan, Ann. Glob. Health 80 (2014) 303–314. doi: 10.1016/j.aogh.2014.09.005
E.K. Silbergeld, K. Nachman, Ann. N. Y. Acad. Sci. 1140 (2008) 346–357. doi: 10.1196/annals.1454.049
A.A. Duker, E.J. Carranza, M. Hale, Environ. Int. 31 (2005) 631–641. doi: 10.1016/j.envint.2004.10.020
J. Luo, Z. Qiu, J. Chen, et al., Toxicology 311 (2013) 99–106. doi: 10.1016/j.tox.2013.06.007
D. Mohan, C.U. Pittman Jr., J. Hazard. Mater. 142 (2007) 1–53. doi: 10.1016/j.jhazmat.2007.01.006
C. Wang, J. Luan, C. Wu, Water Res. 158 (2019) 370–382. doi: 10.1016/j.watres.2019.04.043
B. Liu, K.H. Kim, V. Kumar, et al., J. Hazard. Mater. 388 (2020) 121815. doi: 10.1016/j.jhazmat.2019.121815
R. Quansah, F.A. Armah, D.K. Essumang, et al., Environ. Health Perspect. 123 (2015) 412–421. doi: 10.1289/ehp.1307894
K.E. Nachman, P.A. Baron, G. Raber, et al., Environ. Health Perspect. 121 (2013) 818–824. doi: 10.1289/ehp.1206245
Q. Liu, X. Lu, H. Peng, et al., Trac-Trend Anal. Chem. 104 (2018) 171–182. doi: 10.1016/j.trac.2017.10.006
H. Chen, W. Liu, L. Cheng, et al., Chem. Eng. J. 429 (2022) 132162. doi: 10.1016/j.cej.2021.132162
S. Chinnapaiyan, U. Rajaji, S.-M. Chen, et al., Electrochim. Acta 401 (2022) 139487. doi: 10.1016/j.electacta.2021.139487
R. Tang, Y. Wang, S. Yuan, et al., J. Hazard. Mater. 406 (2021) 124789. doi: 10.1016/j.jhazmat.2020.124789
B.P. Jackson, P.M. Bertsch, M.L. Cabrera, et al., J. Environ. Qual. 32 (2003) 535–540. doi: 10.2134/jeq2003.5350
K.R. Kim, G. Owens, S.I. Kwon, et al., Water Air Soil Pollut. 214 (2010) 163–174.
L. Wang, H. Cheng, Environ. Sci. Technol. 49 (2015) 3473–3481. doi: 10.1021/es505358c
A. Adak, K.P. Mangalgiri, J. Lee, et al., Water Res. 70 (2015) 74–85. doi: 10.1016/j.watres.2014.11.025
J. Cui, Y.-b. Xiao, L. Dai, et al., Food Anal. Method 6 (2012) 370–379.
J. Lv, B. Wang, Y. Xie, et al., Environ. Sci: Nano 6 (2019) 2759–2766. doi: 10.1039/C9EN00316A
S.D. Conklin, N. Shockey, K. Kubachka, et al., J. Agric. Food Chem. 60 (2012) 9394–9404. doi: 10.1021/jf302366a
S.K. Srivastava Nikhil, A. Srivastava, et al., ACS Omega 7 (2022) 2908–2917. doi: 10.1021/acsomega.1c05800
Z. Li, X. Chen, X. Zhang, et al., Food Chem. 347 (2021) 129054. doi: 10.1016/j.foodchem.2021.129054
L. Basabe-Desmonts, D.N. Reinhoudt, M. Crego-Calama, Chem. Soc. Rev. 36 (2007) 993–1017. doi: 10.1039/b609548h
J. Wu, W. Liu, J. Ge, et al., Chem. Soc. Rev. 40 (2011) 3483–3495. doi: 10.1039/c0cs00224k
R. Xue, H. Guo, T. Wang, et al., Anal. Methods 9 (2017) 3737–3750. doi: 10.1039/C7AY01261F
L. Guo, L. Yang, M. Li, et al., Coordin. Chem. Rev. 440 (2021) 213957. doi: 10.1016/j.ccr.2021.213957
L. Guo, J. Zhang, Q. Huang, et al., Chin. Chem. Lett. 33 (2022) 2856–2866. doi: 10.1016/j.cclet.2022.02.065
X.H. Han, J.Q. Chu, W.Z. Wang, et al., Chin. Chem. Lett. 33 (2022) 2464–2468. doi: 10.1016/j.cclet.2021.11.066
M.S. Lohse, T. Bein, Adv. Funct. Mater. 28 (2018) 1705553. doi: 10.1002/adfm.201705553
Z. Wang, S. Zhang, Y. Chen, et al., Chem. Soc. Rev. 49 (2020) 708–735. doi: 10.1039/C9CS00827F
D. Zhu, G. Xu, M. Barnes, et al., Adv. Funct. Mater. 31 (2021) 2100505. doi: 10.1002/adfm.202100505
Z.C. Guo, Z.Q. Shi, X.Y. Wang, et al., Coordin. Chem. Rev. 422 (2020) 213465. doi: 10.1016/j.ccr.2020.213465
Q. Du, J. Zou, Z. Huang, et al., Chin. Chem. Lett. 34 (2023) 107763. doi: 10.1016/j.cclet.2022.107763
F. Yang, S. Cheng, X. Zhang, et al., Adv. Mater. 30 (2017) 1702415.
Z. Xia, Y. Zhao, S.B. Darling, Adv. Mater. Interfaces 8 (2021) 2001507. doi: 10.1002/admi.202001507
X. Liu, D. Huang, C. Lai, et al., Chem. Soc. Rev. 48 (2019) 5266–5302. doi: 10.1039/C9CS00299E
H. Hu, Q. Yan, R. Ge, et al., Chinese J. Catal. 39 (2018) 1167–1179. doi: 10.1016/S1872-2067(18)63057-8
A.P. Cote, A.I. Benin, N.W. Ockwig, et al., Science 310 (2005) 1166–1170. doi: 10.1126/science.1120411
H.L. Nguyen, C. Gropp, O.M. Yaghi, J. Am. Chem. Soc. 142 (2020) 2771–2776. doi: 10.1021/jacs.9b13971
Z. Chen, K. Wang, X. Hu, et al., ACS Appl. Mater. Interfaces 13 (2021) 1145–1151. doi: 10.1021/acsami.0c16116
P. Shi, J. Wang, Z. Guo, Chem. Eng. J. 451 (2023) 139082. doi: 10.1016/j.cej.2022.139082
Z. Chen, K. Wang, Y. Tang, et al., Angew. Chem. Int. Ed. 62 (2023) e202213268. doi: 10.1002/anie.202213268
C. Jia, A. Duan, C. Liu, et al., Small 19 (2023) 2300518. doi: 10.1002/smll.202300518
S. An, X. Li, S. Shang, et al., Angew. Chem. Int. Ed. 62 (2023) e202218742. doi: 10.1002/anie.202218742
X. Chen, M. Addicoat, E.Q. Jin, et al., J. Am. Chem. Soc. 137 (2015) 3241–3247. doi: 10.1021/ja509602c
M. Yin, L. Wang, S. Tang, ACS Appl. Mater. Interfaces 14 (2022) 55674–55685. doi: 10.1021/acsami.2c18226
Z. Li, N. Huang, K.H. Lee, et al., J. Am. Chem. Soc. 140 (2018) 12374–12377. doi: 10.1021/jacs.8b08380
J.Y. Yue, X.L. Ding, Y.T. Wang, et al., J. Mater. Chem. A 9 (2021) 26861–26866. doi: 10.1039/D1TA06867A
H. Min, S. Wu, Z. Han, et al., Chem. Eur. J. 27 (2021) 17459–17464. doi: 10.1002/chem.202103297
M. Afshari, M. Dinari, H. Farrokhpour, et al., ACS Appl. Mater. Interfaces 14 (2022) 22398–22406. doi: 10.1021/acsami.1c24555
J.Q. Chen, Q.Q. Zheng, S.J. Xiao, et al., Anal. Chem. 94 (2022) 2517–2526. doi: 10.1021/acs.analchem.1c04406

Figure 1 (a) PXRD patterns of EP-COF: comparison between the experimental (black line) and Pawley refined (red dotted line) profiles, the eclipsed AA stacking model (blue line) and the refinement difference (gray line) (inset: partial enlargement of the PXRD pattern). (b) Top and side views of EP-COF. (c) FT-IR spectra of ETTBA, PCDBH, and EP-COF. (d) N2 adsorption-desorption isotherm (77 K) of EP-COF (inset: pore size distribution profile).

Figure 2 (a) Fluorescence emission spectra of aqueous suspension (100 mg/L) of EP-COF upon gradual addition of ROX (λex = 365 nm). (b) Stern-Volmer plot of EP-COF toward ROX. (c) Fluorescence quenching efficiency of EP-COF at 558 nm in the presence of various antibacterial drugs. (d) Fluorescence quenching efficiency of EP-COF at 558 nm in the presence of various metal ions.

 扫一扫看文章

扫一扫关注我们
 DownLoad:

 下载:
下载:
