Dynamic deformylation of 5-formylcytosine and decarboxylation of 5-carboxylcytosine during differentiation of mouse embryonic stem cells into mouse neurons
Citation:
Yang Feng, Yang-Qing Tian, Yong-Qiang Zhao, Sheng-Jun Chen, Bi-Feng Yuan. Dynamic deformylation of 5-formylcytosine and decarboxylation of 5-carboxylcytosine during differentiation of mouse embryonic stem cells into mouse neurons[J]. Chinese Chemical Letters,
2024, 35(11): 109656.
doi:
10.1016/j.cclet.2024.109656
Dynamic deformylation of 5-formylcytosine and decarboxylation of 5-carboxylcytosine during differentiation of mouse embryonic stem cells into mouse neurons
English
Dynamic deformylation of 5-formylcytosine and decarboxylation of 5-carboxylcytosine during differentiation of mouse embryonic stem cells into mouse neurons
Key Laboratory of Aquatic Product Processing, Ministry of Agriculture and Rural Affairs, National R&D Center for Aquatic Product Processing, South China Sea Fisheries Research Institute, Chinese Academy of Fishery Sciences, Guangzhou 510300, China
b.
Department of Occupational and Environmental Health, School of Public Health, Research Center of Public Health, Renmin Hospital of Wuhan University, Wuhan University, Wuhan 430071, China
c.
College of Veterinary Medicine, Yunnan Agricultural University, Kunming 650000, China
Received Date:
14 October 2023 Accepted Date:
13 February 2024 Revised Date:
19 January 2024 Available Online:
15 November 2024
Abstract:
Regulation of cell fate requires the establishment and erasure of 5-methylcytosine (5mC) in genomic DNA. The formation of 5mC is achieved by DNA cytosine methyltransferases (DNMTs), whereas the removal of 5mC can be accomplished by various pathways. Aside from ten-eleven translocation (TET)-mediated oxidation of 5mC followed by thymine DNA glycosylase (TDG)-initiated base excision repair (BER), the direct deformylation of 5-formylcytosine (5fC) and decarboxylation of 5-carboxylcytosine (5caC) have also been discovered as the novel DNA demethylation pathways. Although these novel demethylation pathways have been identified in stem cells and somatic cells, their precise roles in regulating cell fate remain unclear. Here, we differentiate mouse embryonic stem cells (mESCs) into mouse embryoid bodies (mEBs), followed by further differentiation into mouse neural stem cells (mNSCs) and finally into mouse neurons (mNeurons). During this sequential differentiation process, we employ probe molecules, namely 2′-fluorinated 5-formylcytidine (F-5fC) and 2′-fluorinated 5-carboxyldeoxycytidine (F-5caC), for metabolic labeling. The results of mass spectrometry (MS) analysis demonstrate the deformylation and decarboxylation activities are progressively decreased and increased respectively during differentiation process, and this opposite demethylation tendency is not associated with DNMTs and TETs.
Embryonic stem cells (ESCs) possess the remarkable ability of self-renewal and pluripotency, allowing them to differentiate into various cell types derived from the three germ layers [1–3]. The regulatory mechanisms governing ESC fate involve signal pathways, transcription factors, and epigenetic regulation [4–6]. Nucleic acids carry diverse modifications and they have been considered to play crucial roles in cell fate decision [7–10]. In particular, the epigenetic modification known as 5-methylcytosine (5mC) is of great importance in higher vertebrates, displaying a dynamic pattern during cell differentiation [11–13]. The establishment of 5mC is mediated by DNA cytosine methyltransferases (DNMTs), including DNMT1, DNMT3A, and DNMT3B [14]. Various demethylation pathways are responsible for the removal of this modification [15–21]. One such demethylation pathway is the ten-eleven translocation (TET)-thymine DNA glycosylase (TDG)-base excision repair (BER) pathway [22]. Within this pathway, TET dioxygenases catalyze the iterative oxidation of 5mC, resulting in the formation of 5-hydroxymethylcytosine (5hmC), 5-formylcytosine (5fC), and 5-carboxylcytosine (5caC) [23–29]. Subsequently, the glycosidic bonds of 5fC and 5caC are cleaved by TDG, generating abasic sites (AP sites) [30]. Finally, these AP sites are replaced with normal dC through the process of base excision repair (BER) [31]. Furthermore, recent studies have unveiled novel pathways for DNA demethylation involving the direct deformylation of 5fC and the decarboxylation of 5caC, leading to the formation of dC [17–21]. These additional pathways provide further complexity to the process of DNA demethylation.
The dynamic changes in 5mC patterns exert a widespread influence on embryonic development and cell- and tissue-specific differentiation, enabling precise regulation of essential life activities [32–35]. In mammalian germ cells, multiple DNA demethylation events occur during gamete formation and embryonic development [36]. Human primordial germ cells reach their lowest DNA methylation levels after weeks of gestation, followed by global re-methylation at later stages [37]. The prevalence of DNA demethylation during embryonic development underscores its crucial role in life processes. Notably, DNA demethylation plays a significant role in regulating the development of neuronal cells [38,39]. It occurs at specific regulatory sites and transcription units, dynamically influencing neuronal differentiation and function [40]. Aberrant DNA demethylation is strongly associated with neurological disorders such as Alzheimer’s disease, autism, and Rett syndrome [41–43]. These findings highlight the critical involvement of DNA demethylation in neuronal cell development and the regulation of neural function.
Abundant levels of 5fC and 5caC have been observed in both ESCs and neurons, and their levels undergo changes during the process of differentiation [44–47]. These findings further highlight the significance of DNA demethylation in embryonic development and the regulation of neural function. Therefore, it is crucial to investigate the DNA demethylation events that occur during the differentiation of ESCs, particularly in their directed differentiation into neurons. Although the deformylation of 5fC and decarboxylation of 5caC have been identified as novel DNA demethylation pathways in ESCs and somatic cells [18–21], their dynamics during the differentiation of ESCs into neurons have yet to be elucidated. To address this knowledge gap, we employed the metabolic labeling in conjunction with mass spectrometry (MS) analysis to examine the temporal dynamics of these novel DNA demethylation pathways.
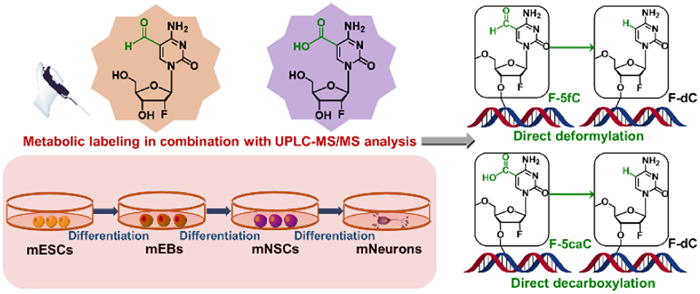
In this study, we employed the technique of directional inducement to differentiate mouse embryonic stem cells (mESCs) into mouse embryoid bodies (mEBs), mouse neural stem cells (mNSCs), and mouse neurons (mNeurons). During this differentiation process, we utilized two probes of nucleoside molecules, 2′-fluorinated 5-formylcytosine (F-5fC) and 2′-fluorinated 5-carboxyldeoxycytidine (F-5caC), to metabolically label these cells. We then utilized ultra-performance liquid chromatography-tandem mass spectrometry (UPLC-MS/MS) to investigate the dynamic deformylation and decarboxylation events that occur during this process (Fig. 1). We aimed to gain a deeper understanding of the mechanisms underlying DNA demethylation during ESC differentiation into neurons.
Figure 1
Figure 1.
Experimental design and analysis overview. mESCs were induced to differentiate into mEBs, mNSCs, and mNeurons sequentially. Metabolic labeling was performed using nucleoside probes of F-5fC or F-5caC to label the respective cell types during the differentiation process. UPLC-MS/MS analysis was employed to determine the dynamics of deformylation of 5fC and decarboxylation of 5caC during cell differentiation.
To establish successful differentiation of mESCs into mNeurons, several steps were followed. Initially, mESCs were cultured on a mouse embryonic fibroblast (MEF) feeder layer, displaying characteristic round cellular morphology (Fig. S1 in Supporting information). Subsequently, the mESCs were induced to differentiate into mEBs and mNSCs through suspension culture. During this process, the mEBs showed enlargement and increased density, indicating successful differentiation (Fig. S2 in Supporting information). Moreover, the induced-mNSCs exhibited a roughened cell membrane due to the formation of dendrites and axons (Fig. S3 in Supporting information). Finally, mNeurons were formed through differentiation from mNSCs and demonstrated adherent growth. Abundant dendrites and axons were observed, extending in various directions (Fig. S4 in Supporting information).
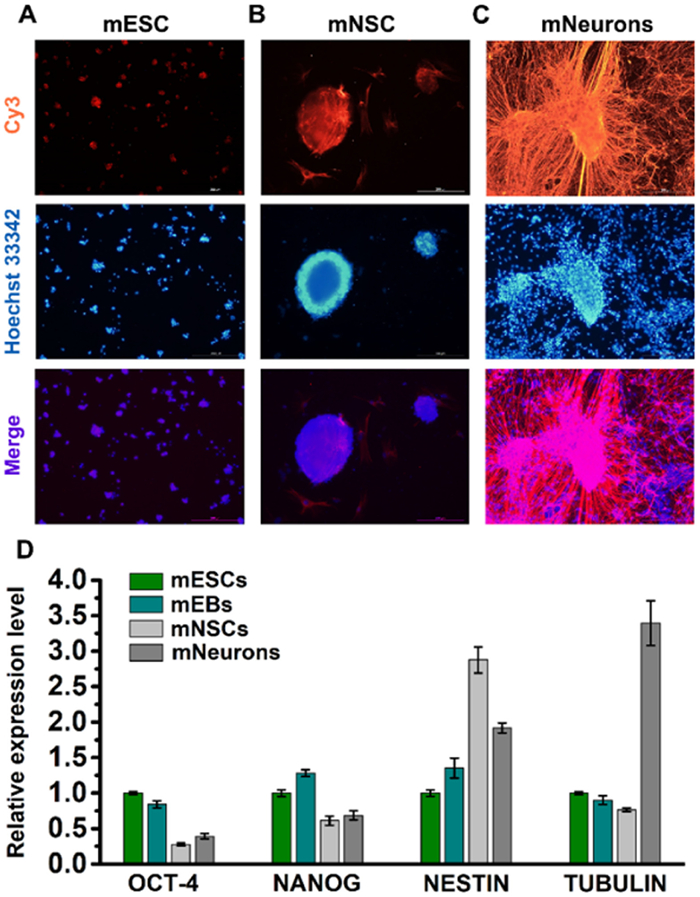
To confirm the success of the induced differentiation, we examined marker gene expressions in the corresponding cell types using immunofluorescence staining and RT-qPCR according to previously described protocol [48]. The results showed the relatively high levels of expression of NANOG and OCT-4, which are known pluripotency marker genes, in mESCs (Fig. 2A and Fig. S5 in Supporting information). In mNSCs, NESTIN, a marker gene for neural stem cells, was highly expressed (Fig. 2B). Lastly, in mNeurons, the high-level expression of TUBULIN, a marker gene for mature neurons, was observed (Fig. 2C). The relative expressions of these genes are shown in Fig. 2D. These findings supported the successful differentiation of mESCs into mEBs, mNSCs, and mNeurons.
Figure 2
Figure 2.
Detection of the marker gene expression in corresponding cell types under induced differentiation. (A-C) Immunofluorescence staining of NANOG in mESCs, NESTIN in mNSCs, and TUBULIN in mNeurons. Scale bars represent 200 µm. (D) Relative expression levels of OCT-4, NANOG, NESTIN, and TUBULIN in mESCs, mEBs, mNSCs, and mNeurons.
The probes of F-5fC and F-5caC were synthetized as the previous literature with slight modification [49,50]. The synthetic route is shown in Fig. S6 in Supporting information. Briefly, we started with F-dC (1), which was firstly silylation-protected by tert-butyldimethylsilyl chloride (TBS-Cl) to give (2). Subsequent iodination at C5 position with elemental iodine and ceric ammonium nitrate (CAN) yielded TBS-protected 5-iodo-F-dC (3). The formation of methyl ester structure (4) was conducted by using palladium-mediated CO insertion in methanol solvent. Next, the silylation groups was deprotected to give 5-methyl ester-F-dC (5). The saponification reaction was performed by utilizing LiOH in H2O:MeCN (1:1) to give F-5caC (7). Carbonylative Stille coupling of (3) with tributyltin hydride formed formyl group at C5 position (8), and subsequently converted into F-5fC (6) by deprotection of the silylation groups. The total yield of F-5fC (6) and F-5caC (7) was 35 % and 23 %, respectively, with regard to F-dC (1).
The nucleoside probes of F-5fC and F-5caC were utilized to investigate the intragenomic deformylation and decarboxylation, respectively. To ensure the accuracy of the results, we further purified the probes of F-5fC and F-5caC to eliminate any potential contamination of 2′-fluorinated cytosine (F-dC). If there is F-dC contamination, it will be integrated into genomes during DNA replication, making it indistinguishable from F-dC produced through the direct deformylation of F-5fC or the decarboxylation of F-5caC. Thus, even trace amounts of F-dC contamination could lead to false positive results. Purification was carried out using high-performance liquid chromatography (HPLC), and the peaks corresponding to F-5fC and F-5caC were collected (Figs. S7 and S8 in Supporting information). Following purification, high-resolution mass spectrometry (HRMS) and nuclear magnetic resonance (NMR) were employed to confirm the absence of F-dC contamination (Figs. S9-S14 in Supporting information).
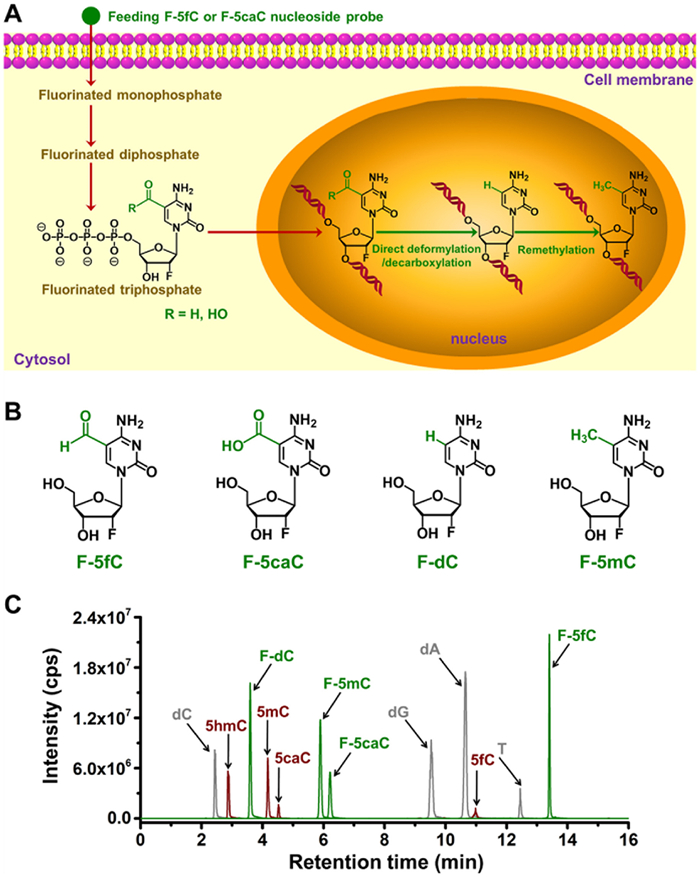
Once F-5fC or F-5caC probes were introduced to growing cells, they were sequentially converted into the corresponding forms of fluorinated monophosphate, diphosphate, and triphosphate. The fluorinated triphosphate was then incorporated into the genomic DNA and underwent deformylation or decarboxylation, resulting in the production of F-dC. Additionally, the obtained F-dC was remethylated to produce 2′-fluorinated 5-methylcytosine (F-5mC) (Fig. 3A). The presence of the 2′-fluorinated group in these nucleosides enhances their hydrophobicity in reversed-phase chromatography and improves the sensitivity in the UPLC-MS/MS analysis of fluorinated compounds. Consequently, our data demonstrate that the fluorinated nucleosides can be effectively separated from canonical nucleosides and natural derivatives of dC (Figs. 3B and C), thus establishing a solid foundation for subsequent analysis using UPLC-MS/MS.
Figure 3
Figure 3.
Metabolic labeling of F-5fC or F-5caC monitored by mass spectrometry. (A) Schematic diagram of the feeding experiment using F-5fC or F-5caC. Upon feeding these nucleoside probes to cells, the nucleosides of F-5fC or F-5caC are converted into fluorinated monophosphate, diphosphate, and triphosphate sequentially, and then the fluorinated triphosphate is incorporated into genomic DNA. F-5fC and F-5caC within genomic DNA undergo deformylation and decarboxylation respectively to produce F-dC, and the obtained F-dC is remethylated to produce F-5mC. (B) Chemical structures of F-5fC, F-5caC, F-dC, and F-5mC. (C) Extracted-ion chromatograms of the nucleosides by UPLC-MS/MS analysis.
To investigate the dynamic deformylation of 5fC and decarboxylation of 5caC during the differentiation process from mESCs to mNeurons, we supplemented the culture medium of mESCs and induced-differentiation medium of mEBs, mNSCs, and mNeurons with 300 µmol/L of F-5fC or 300 µmol/L of F-5caC. This treatment was carried out for a duration of 4 d to allow effective genomic incorporation of the probe molecules. Subsequently, the cells were harvested and lysed, and genomic DNA was extracted. To analyze the nucleosides, the genomic DNA was further digested according to the previously described methods [51–53]. The resulting nucleosides were then subjected to analysis using UPLC-MS/MS. The mass spectrometry parameters are listed in Table S1 in Supporting information. To ensure accurate quantification, standard curves of the nucleosides were established (Figs. S15 and S16 in Supporting information) according to previous studies [54–58]. These standard curves serve as reference points for determining the precise amounts of nucleosides present in the samples.
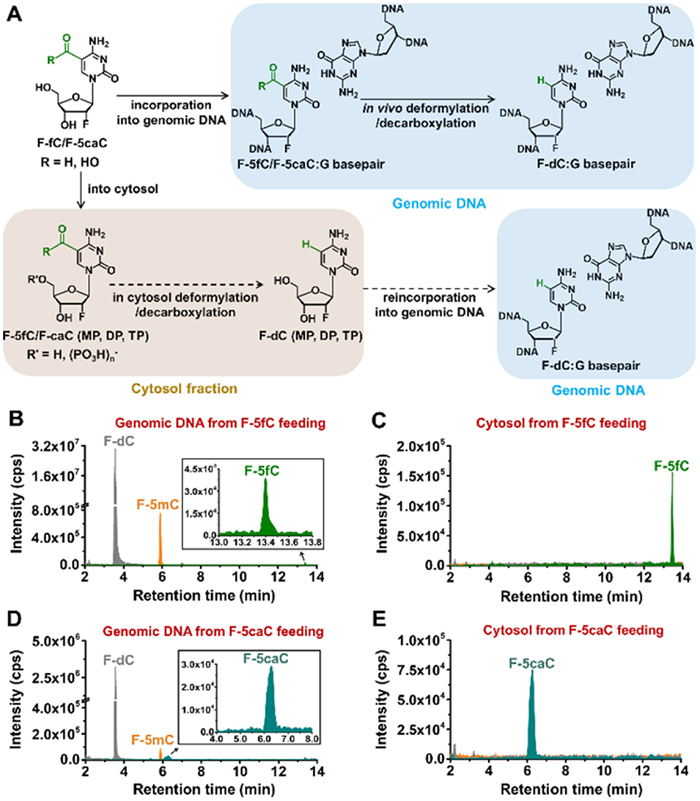
To interrogate the intragenomic deformylation of 5fC and decarboxylation of 5caC, we should exclude the possibility of the deformylation and decarboxylation in cytosol fraction. The potential conversion of F-5fC or F-5caC in cytosol to form F-dC would then be followed by reincorporation of the triphosphate into genome (Fig. 4A). Thus, the observed F-dC may not demonstrate the deformylation of F-5fC or decarboxylation of F-5caC within genomic DNA. The analysis of deformylation of 5fC revealed that, in addition to F-5fC, the genomic DNA of mESCs also contained the deformylated product of F-dC and the remethylated product of F-5mC (Fig. 4B). In addition, we also investigated the possibility of deformylation of F-5fC in the cytosol fraction. As shown in Fig. 4C, F-5fC was detected in the cytosol, while F-dC and F-5mC were undetectable. This suggests that the deformylation of F-5fC primarily occurs in genomic DNA and not in the cytosol. Regarding the decarboxylation analysis, we found that F-5caC, F-dC, and F-5mC were present in the genomic DNA of mESCs (Fig. 4D). In contrast, only F-5caC was detected in the cytosol fraction (Fig. 4E). These findings indicate that the decarboxylation of F-5caC takes place in the genomes of mESCs, while it is absent or negligible in the cytosol. Taken together, these results strongly suggest that the deformylation of F-5fC and the decarboxylation of F-5caC predominantly occur in the genomes of mESCs, while these processes are limited or absent in the cytosol.
Figure 4
Figure 4.
Intragenomic deformylation of 5fC and decarboxylation of 5caC. (A) Schematic overview of the deformylation of F-5fC and decarboxylation of F-5caC in genomes and assumed conversion of deformylation and decarboxylation in cytosol fraction. F-5fC/5caC (MP, DP, and TP) and F-dC (MP, DP, and TP) refer to the form of nucleoside, monophosphate, diphosphate, and triphosphate, respectively. Extracted-ion chromatograms of F-5fC, F-dC, and F-5mC from genomic DNA (B) and cytosol (C) of mESCs upon feeding with 300 µmol/L of F-5fC. Extracted-ion chromatograms of F-5caC, F-dC, and F-5mC from genomic DNA (D) and cytosol (E) of mESCs upon feeding with 300 µmol/L of F-5caC.
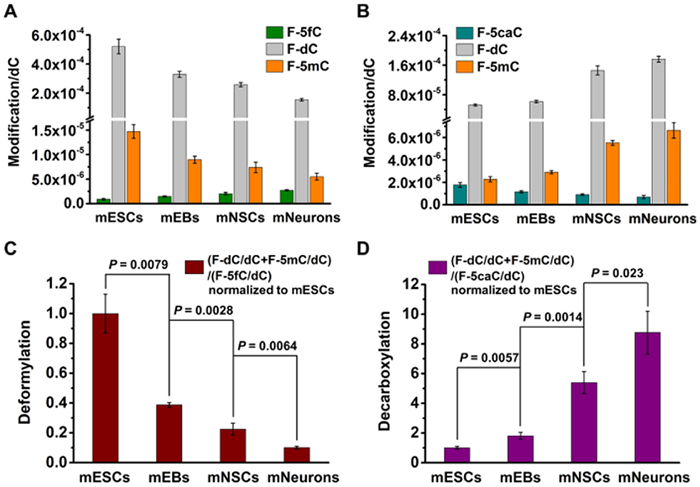
In addition to the intragenomic deformylation of 5fC and decarboxylation of 5caC in mESCs, we also observed these phenomena during the differentiation of mESCs into mEBs, mNSCs, and mNeurons (Fig. S17 in Supporting information). This indicates that deformylation and decarboxylation occur throughout the differentiation process. To further quantify these processes, we analyzed the production of F-dC resulting from deformylation of F-5fC or decarboxylation of F-5caC, as well as the ratio of F-5mC to F-dC. The significant amount of produced F-dC suggests effective genomic deformylation and decarboxylation (Figs. 5A and B). The ratio of F-5mC to F-dC, which is around 3 %, is similar to the natural methylation level, indicating the existence of genomic turnover of 5fC/5caC→dC→5mC (Figs. 5A and B). Furthermore, we investigated the activities of deformylation and decarboxylation during the differentiation process. The ratios of (F-dC/dC+F-5mC/dC)/(F-5fC/dC) and (F-dC/dC+F-5mC/dC)/(F-5caC/dC) were used as measures of deformylation and decarboxylation activity, respectively. To analyze the data, we normalized the deformylation and decarboxylation activities to mESCs. Interesting, we found that the deformylation activity progressively decreased during the differentiation of mESCs into mNeurons (Fig. 5C). In contrast, the decarboxylation activity showed a contrary trend, progressively increasing throughout this differentiation process (Fig. 5D).
Figure 5
Figure 5.
Dynamic changes in deformylation of 5fC and decarboxylation of 5caC during the differentiation of mESCs into mNeurons. (A) Quantification of F-5fC, F-dC, and F-5mC levels in genomic DNA of mESCs, mEBs, mNSCs, and mNeurons upon feeding with 300 µmol/L of F-5fC. (B) Quantification of F-5caC, F-dC, and F-5mC levels in genomic DNA of mESCs, mEBs, mNSCs, and mNeurons upon feeding with 300 µmol/L of F-5caC. (C) Deformylation activity during the differentiation of mESCs into mEBs, mNSCs, and mNeurons, which was normalized to mESCs. (D) Decarboxylation activity during the differentiation of mESCs into mEBs, mNSCs, and mNeurons, which was normalized to mESCs.
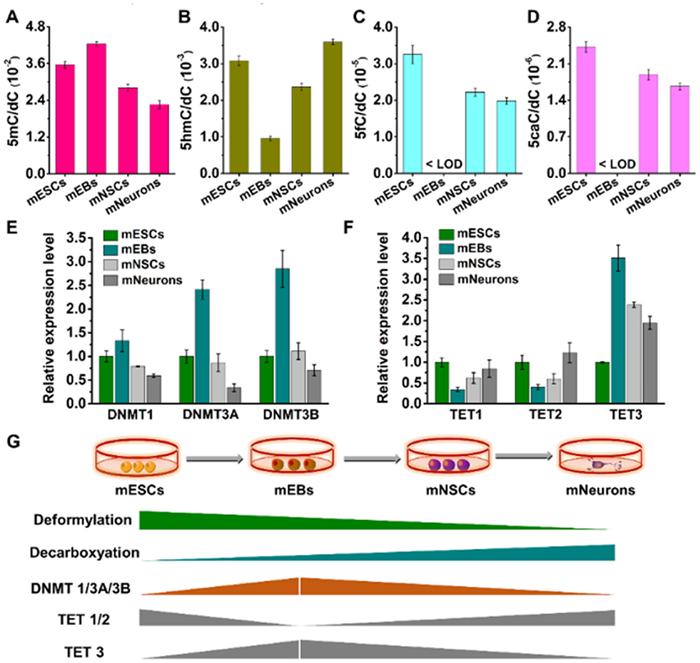
To investigate whether the observed opposite tendency in deformylation and decarboxylation activities is associated with DNMTs and TETs, we examined the levels of these proteins during the differentiation process of mESCs. We used cells without metabolic labeling as the negative control for this research. Initially, we utilized UPLC-MS/MS to determine the content of genomic 5mC, 5hmC, 5fC and 5caC. The results showed that during the differentiation from mESCs to mEBs, the content of 5mC increased, accompanied by a distinct decrease in 5hmC content (Figs. 6A, B and Figs. S18A, B in Supporting information). Additionally, the contents of 5fC and 5caC became undetectable (Figs. 6C, D and Figs. S18C, D in Supporting information). However, as the differentiation progressed from mEBs to mNSCs and mNeurons, the 5mC content dropped while the contents of 5hmC, 5fC, and 5caC increased (Figs. 6A-D and Fig. S18 in Supporting information).
Figure 6
Figure 6.
Dynamic changes in the contents of dC derivatives and the relative levels of DNMTs and TETs during the differentiation of mESCs into mNeurons. (A-D) Quantification of various dC derivatives in mESCs, mEBs, mNSCs, and mNeurons using UPLC-MS/MS analysis. (E) Relative expression levels of DNMT1, DNMT3A, and DNMT3B in mESCs, mEBs, mNSCs, and mNeurons. (F) Relative expression levels of TET1, TET2, and TET3 in mESCs, mEBs, mNSCs, and mNeurons. (G) Schematic illustration of the deformylation activity of 5fC, decarboxylation activity of 5caC, and the level of DNMT and TET enzymes during the differentiation from mESCs into mNeurons.
Furthermore, we examined the expression levels of DNMTs and TETs using RT-qPCR. The PCR primer sequences are listed in Table S2 (Supporting information). The analysis revealed that the levels of DNMT1, DNMT3A, and DNMT3B increased during the differentiation from mESCs to mEBs, but progressively decreased during the differentiation from mEBs to mNSCs and mNeurons (Fig. 6E). This finding was consistent with the genomic 5mC content determined by UPLC-MS/MS. As for the TET analysis the levels of TET1 and TET2 were drastically reduced from mESCs to mEBs, and then increased from mEBs to mNSCs and mNeurons (Fig. 6F), in accordance with the levels of genomic 5hmC, 5fC, and 5caC. The expression level of TET3 displayed a tendency opposite to those of TET1 and TET2 (Fig. 6F). Based on the results from UPLC-MS/MS and RT-qPCR, we can conclude that the activities of deformylation and decarboxylation during the differentiation from mESCs to mNeurons are not associated with DNMTs and TETs (Fig. 6G).
In summary, our data demonstrate that during the directional differentiation of mESCs, from mESCs into mEBs, mNSCs, and mNeurons sequentially, the deformylation activity is progressively decreased, while the decarboxylation activity is progressively increased. This opposite demethylation tendency highlights the epigenetic significance of these pathways, which can serve as the epigenetic basis for ESC differentiation. Further investigation suggests that the dynamic deformylation and decarboxylation are not associated with the expression of DNMTs and TETs. Based on this, we speculate that the regulation of deformylase for 5fC and decarboxylase for 5caC may affect ESC differentiation. Future studies are needed to identify the endogenous deformylase and decarboxylase and determine their expression levels during ESC differentiation. By understanding these intricate epigenetic regulatory mechanisms, researchers can gain insights into the control of ESC fate and potentially harness this knowledge for various applications in regenerative medicine and disease modeling.
Declaration of competing interest
The authors declare that they have no known competing financial interests or personal relationships that could have appeared to influence the work reported in this paper.
Acknowledgments
The work is supported by the National Key R&D Program of China (Nos. 2022YFC3400700, 2022YFA0806600), the National Natural Science Foundation of China (No. 22074110), Guangdong Basic and Applied Basic Research Foundation (No. 2022A1515110550), Central Public-interest Scientific Institution Basal Research Fund, South China Sea Fisheries Research Institute, CAFS (No. 2021TS02), Guangzhou Basic and Applied Basic Research Foundation (No. 2023A04J1337), and Central Public-interest Scientific Institution Basal Research Fund, CAFS (No. 2023TD78).
Supplementary materials
Supplementary material associated with this article can be found, in the online version, at doi:10.1016/j.cclet.2024.109656.
Figure 1
Experimental design and analysis overview. mESCs were induced to differentiate into mEBs, mNSCs, and mNeurons sequentially. Metabolic labeling was performed using nucleoside probes of F-5fC or F-5caC to label the respective cell types during the differentiation process. UPLC-MS/MS analysis was employed to determine the dynamics of deformylation of 5fC and decarboxylation of 5caC during cell differentiation.
Figure 2
Detection of the marker gene expression in corresponding cell types under induced differentiation. (A-C) Immunofluorescence staining of NANOG in mESCs, NESTIN in mNSCs, and TUBULIN in mNeurons. Scale bars represent 200 µm. (D) Relative expression levels of OCT-4, NANOG, NESTIN, and TUBULIN in mESCs, mEBs, mNSCs, and mNeurons.
Figure 3
Metabolic labeling of F-5fC or F-5caC monitored by mass spectrometry. (A) Schematic diagram of the feeding experiment using F-5fC or F-5caC. Upon feeding these nucleoside probes to cells, the nucleosides of F-5fC or F-5caC are converted into fluorinated monophosphate, diphosphate, and triphosphate sequentially, and then the fluorinated triphosphate is incorporated into genomic DNA. F-5fC and F-5caC within genomic DNA undergo deformylation and decarboxylation respectively to produce F-dC, and the obtained F-dC is remethylated to produce F-5mC. (B) Chemical structures of F-5fC, F-5caC, F-dC, and F-5mC. (C) Extracted-ion chromatograms of the nucleosides by UPLC-MS/MS analysis.
Figure 4
Intragenomic deformylation of 5fC and decarboxylation of 5caC. (A) Schematic overview of the deformylation of F-5fC and decarboxylation of F-5caC in genomes and assumed conversion of deformylation and decarboxylation in cytosol fraction. F-5fC/5caC (MP, DP, and TP) and F-dC (MP, DP, and TP) refer to the form of nucleoside, monophosphate, diphosphate, and triphosphate, respectively. Extracted-ion chromatograms of F-5fC, F-dC, and F-5mC from genomic DNA (B) and cytosol (C) of mESCs upon feeding with 300 µmol/L of F-5fC. Extracted-ion chromatograms of F-5caC, F-dC, and F-5mC from genomic DNA (D) and cytosol (E) of mESCs upon feeding with 300 µmol/L of F-5caC.
Figure 5
Dynamic changes in deformylation of 5fC and decarboxylation of 5caC during the differentiation of mESCs into mNeurons. (A) Quantification of F-5fC, F-dC, and F-5mC levels in genomic DNA of mESCs, mEBs, mNSCs, and mNeurons upon feeding with 300 µmol/L of F-5fC. (B) Quantification of F-5caC, F-dC, and F-5mC levels in genomic DNA of mESCs, mEBs, mNSCs, and mNeurons upon feeding with 300 µmol/L of F-5caC. (C) Deformylation activity during the differentiation of mESCs into mEBs, mNSCs, and mNeurons, which was normalized to mESCs. (D) Decarboxylation activity during the differentiation of mESCs into mEBs, mNSCs, and mNeurons, which was normalized to mESCs.
Figure 6
Dynamic changes in the contents of dC derivatives and the relative levels of DNMTs and TETs during the differentiation of mESCs into mNeurons. (A-D) Quantification of various dC derivatives in mESCs, mEBs, mNSCs, and mNeurons using UPLC-MS/MS analysis. (E) Relative expression levels of DNMT1, DNMT3A, and DNMT3B in mESCs, mEBs, mNSCs, and mNeurons. (F) Relative expression levels of TET1, TET2, and TET3 in mESCs, mEBs, mNSCs, and mNeurons. (G) Schematic illustration of the deformylation activity of 5fC, decarboxylation activity of 5caC, and the level of DNMT and TET enzymes during the differentiation from mESCs into mNeurons.

 DownLoad:

 下载:
下载:


