Figure 1.
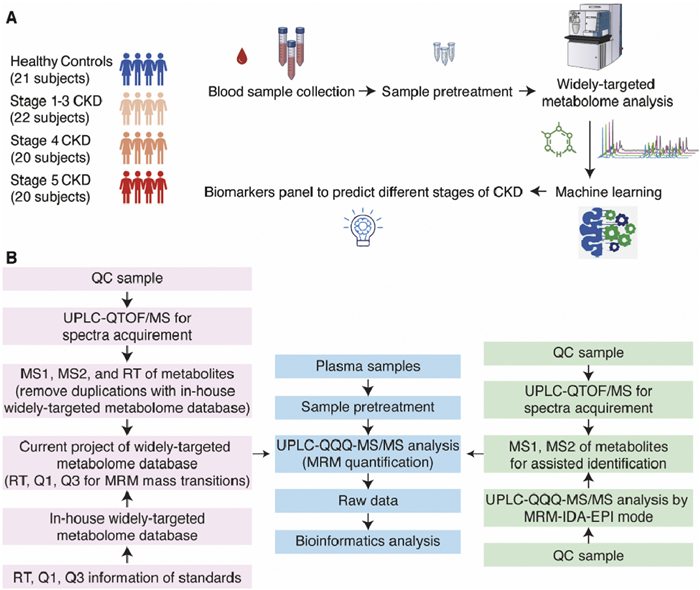
WT-Met approach. (A) Schematic illustration of the study design. (B) The workflow of the WT-Met approach.
Metabolome profiling by widely-targeted metabolomics and biomarker panel selection using machine-learning for patients in different stages of chronic kidney disease
Yao-Hua Gu , Yu Chen , Qing Li , Neng-Bin Xie , Xue Xing , Jun Xiong , Min Hu , Tian-Zhou Li , Ke-Yu Yuan , Yu Liu , Tang Tang , Fan He , Bi-Feng Yuan

Chronic kidney disease (CKD) has a high prevalence in the general population and is associated with high mortality and cardiovascular incidence [1,2]. Accurately assessing the health of the glomerulus is of utmost importance as it determines the diagnosis, management, and prognosis of CKD [3]. Currently, serum creatinine-based estimated glomerular filtration rate (eGFRcr) and urinary albumin/creatinine ratio are the primary indices of CKD, and have been in use for over 7 decades [4]. However, they are inadequate in fully capturing kidney damage due to their weak relationship with tubular atrophy and tubulointerstitial fibrosis on biopsy. Therefore, a broader assessment of kidney health that goes beyond the glomerulus is required.
From a biomarker perspective, metabolites, as the products of metabolism and the final indicators of homeostasis, can provide a more direct reflection of the physiological state [5–9]. Since most metabolites are primarily cleared by glomerular filtration [10], kidney dysfunction can lead to systematic metabolic disturbances that may contribute to the progression of CKD. Therefore, the identification of endogenous metabolite markers with high specificity is highly desirable. Currently, several promising metabolites associated with the onset or progression of CKD have been highlighted, including fibroblast growth factor 23 (FGF23) in urine [11] and serum pseudouridine, C-mannosyltryptophan, N-acetylalanine, erythronate, myo-inositol, and N-acetylcarnosine [3]. However, there is heterogeneity across study cohorts and designs, and the majority of studies have been constrained by measuring only a limited number of metabolites [12].
Mass spectrometry is the most frequently employed platform for identifying metabolites and endogenous compounds [13–21]. However, high-quality metabolomics research for CKD is lacking because large-scale identification and quantification of thousands of metabolites remains challenging [22,23]. Additionally, traditional medical statistics has limitations in extracting valuable information from high-dimensional, multicollinear, and non-independent metabolomics data. Furthermore, limited studies have focused on the Asian population, including China, where CKD impacts 10.8% of the total population with an estimated 119.5 million existing cases [24].
Targeted metabolomics offers high specificity and sensitivity, but its coverage is limited to known metabolites and relies on prior knowledge [25,26]. On the other hand, untargeted metabolomics allows for comprehensive metabolite detection and the discovery of novel metabolites, but it suffers from low specificity and sensitivity [27–29]. To address these limitations, we propose a hypothesis-free, large-scale plasma metabolite identification and quantification system that combines the strengths of targeted and untargeted metabolomics technologies, i.e., widely-targeted metabolomics (WT-Met) approach. Additionally, machine-learning algorithms have been employed to select the most valuable metabolite biomarker panel to predict different stages of CKD.
In the current study, a total of 83 participants were included, consisting of 62 patients with CKD and 21 healthy controls. Among the CKD patients, there were 22 in stage 1–3, 20 in stage 4, and 20 in stage 5. The healthy controls were matched with the CKD patients in terms of age and sex (Fig. 1A). Table S1 (Supporting information) presents the demographic characteristics of the participants, showing that 55.42% of the participants were male, and the mean age was 47.000 ± 14.969 years old. There were no significant differences in age (P = 0.177) or sex (P = 0.737) among the four groups of participants. This study has been approved by the Ethics Committee of Tongji Hospital, Tongji Medical College, Huazhong University of Science and Technology (TJ-IRB20230614).
We then conducted a comprehensive analysis of the plasma metabolome in the 83 participants using the proposed WT-Met approach. The schematic illustration of the WT-Met approach is shown in Fig. 1B and the procedure of sample pretreatment is shown in Fig. S1 (Supporting information). Briefly, we have currently established a widely-targeted metabolome database consisting of 2800 standard compounds with multiple reaction monitoring (MRM) mass transitions and retention times. In the WT-Met approach, we initially employed high-resolution mass spectrometry to conduct non-targeted analysis (UPLC-QTOF/MS analysis) using the pooled sample with data-dependent acquisition (DDA) mode. The pooled sample prepared by combining equal aliquots of the supernatants from all 83 samples also served as a reference for quality control (QC) purposes throughout the analysis. If we encountered metabolites that were not present in our in-house widely-targeted metabolome database, we incorporated them into the database. It was discovered that, in addition to the existing 2800 MRM mass transitions in the in-house widely-targeted metabolome database, we have additionally included 315 MRM mass transitions. As a result, a total of 3115 MRM mass transitions have been established in the current widely-targeted metabolome database, comprising 1910 MRM mass transitions monitored in positive mode and 1205 MRM mass transitions monitored in negative mode. Subsequently, we utilized triple quadrupole mass spectrometry to perform the widely-targeted metabolome analysis (UPLC-QQQ-MS/MS analysis). The detailed analytical procedures can be found in Supporting information.
To identify metabolites, we employed an in-house database and a comprehensive public metabolome databases. Following data filtering, a total of 1431 compounds were successfully identified in the QC sample (Supplementary Data 1). The confidence levels for metabolite identification were categorized into three tiers. The identified metabolites were compared to authentic standards in terms of MS1, MS2, and retention time, indicating a high level of confidence (level 1). Metabolites were identified by interpreting their MS1, MS2, and retention time without comparing them to authentic standards, but with a score above 0.9 in the public metabolome databases, which suggests a relatively high level of confidence in their identification (level 2). Metabolites identified by interpreting their MS1, MS2, and retention times with a score between 0.5 and 0.9 in the public metabolome databases were assigned as level 3. Among these 1431 compounds, 401 (28.02%) were classified as level 1. Additionally, 174 compounds (12.16%) were classified as level 2 (Table S2 in Supporting information). The use of both an in-house database and comprehensive public metabolome databases allowed us to achieve a robust identification of metabolites in the plasma samples.
The total ion chromatograms (TICs) of the QC samples exhibited excellent overlap (Fig. S2 in Supporting information) and high correlation (Fig. S3 in Supporting information) with each other, as evidenced by the high Pearson coefficients. This observation indicates the high reproducibility of the measurements. Principal Component Analysis (PCA) demonstrated that the QC samples consistently clustered near the center of the chart (Fig. S4A in Supporting information), suggesting a reliable testing process and stable performance of the UPLC-QQQ-MS/MS measurement. Moreover, the coefficient of variation (CV) values for all the compounds in the QC sample were found to be less than 30% and 1200 (83.86%) were found to be less than 20%, further confirming the high reproducibility of the experimental results (Fig. S4B in Supporting information). We then removed exogenous compounds, including toxins, pollutants and drugs, from the dataset. The remaining set of 539 compounds was predominantly composed of endogenous metabolites (Supplementary Data 2), with the majority falling into one of four categories, amino acids and their metabolites (n = 130, 24.12%), glycerophospholipids (n = 102, 18.92%), fatty acids (n = 80, 14.84%), and organic acids and their derivatives (n = 76, 14.10%) (Fig. S5A and Table S3 in Supporting information).
By applying fuzzy c-means clustering analysis, we classified the 539 metabolites into six distinct groups based on their changing trends during the progression from healthy controls to stage 5 CKD (Fig. S5B in Supporting information). Metabolites in cluster 1, 2, and 5 exhibited a unidirectional changing tendency that increased or decreased along with the progression of kidney dysfunction. Metabolites in cluster 3 showed an “L” shape, indicating a decreased concentration if kidney function was impaired and an increase with the progression of CKD, but levels remained lower than normal. Metabolites in cluster 4 exhibited a “V” shape, showing a decrease in concentration during the early stages of CKD but an increase with further progression. Conversely, metabolites in cluster 6 exhibited a reverse trend, increasing with kidney function impairment but decreasing slightly with the progression of CKD, while still remaining higher than normal levels.
Out of the 539 endogenous metabolites, 399 metabolites (74.03%) exhibited significant differences among the four groups, as determined by analysis of variance (ANOVA) with a false discovery rate (FDR) below 0.05 (Fig. 2A). This indicates that there are extensive metabolic changes occurring during the progression of CKD. After grouping the 539 metabolites, we observed that the levels of 99 metabolites (18.36%) were up-regulated, 63 metabolites (11.69%) were down-regulated, and the remaining 377 metabolites (69.94%) showed non-linear changes (Fig. 2B). We also compared and visually represented the top 10 changed metabolites based on the between-group variance of their intensity (Fig. 2B). Among the top 10 up-regulated metabolites, 4 belonged to nucleotides and their metabolites, while 3 belonged to organic acids and their derivatives. Similarly, among the top 10 down-regulated metabolites, 4 belonged to glycerophospholipids and 3 belonged to amino acids and their metabolites. Furthermore, among the top 10 non-linear metabolites, 3 belonged to amino acids and their metabolites.
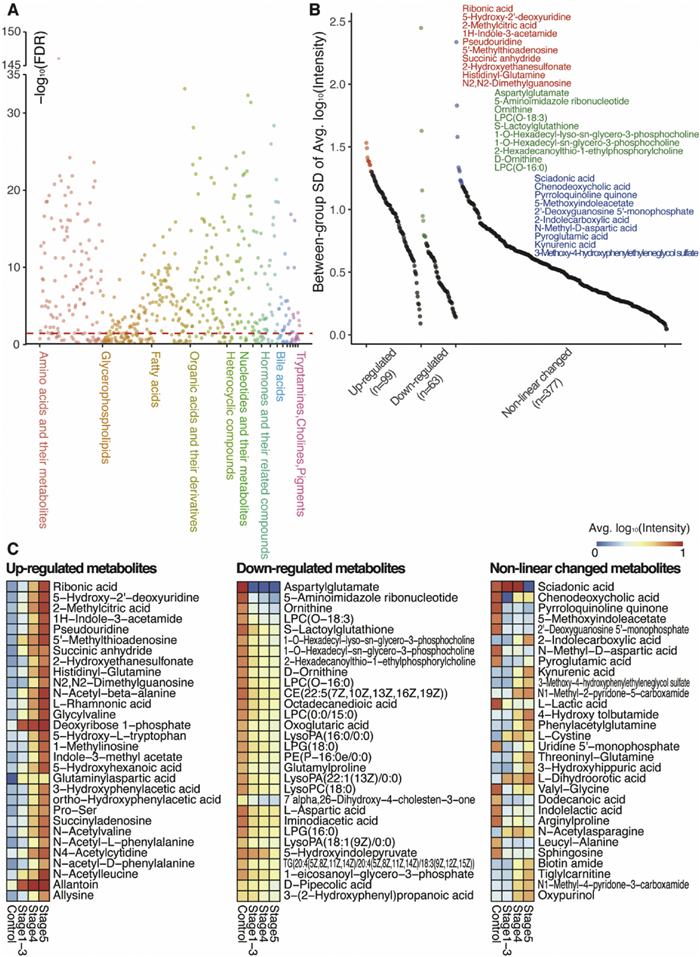
Expanding our analysis to the top 90 changed metabolites (30 in each group), we found that 28 (31.11%) were amino acids and their metabolites, 16 (17.78%) were organic acids and their derivatives, 14 (15.56%) were glycerophospholipids, and 11 (12.22%) were nucleotides and their metabolites (Fig. 2C). These results highlight the diverse array of metabolites that undergo significant changes during the progression of CKD, with amino acids, organic acids, glycerophospholipids, and nucleotides being particularly affected.
We next conducted a further analysis of the top changed metabolites based on their respective classes. Among the top 30 changed metabolites, 7 were found to be amino acids and their metabolites, with 1 being upregulated and 3 being downregulated (Fig. 3A). Additionally, 6 metabolites belonged to nucleotides and their metabolites, with 4 being up-regulated and 1 being down-regulated (Fig. 3B). Furthermore, 6 metabolites belonged to organic acids and their derivatives, with 3 being up-regulated and 1 being down-regulated (Fig. 3C). For correlation analysis of the top 15 changed metabolites (top 5 in each group), we observed that 5-aminoimidazole ribonucleotide, aspartylglutamate, and pyrroloquinoline quinone had the highest sum of correlation coefficients, indicating strong relationships among these metabolites (Fig. 3D).
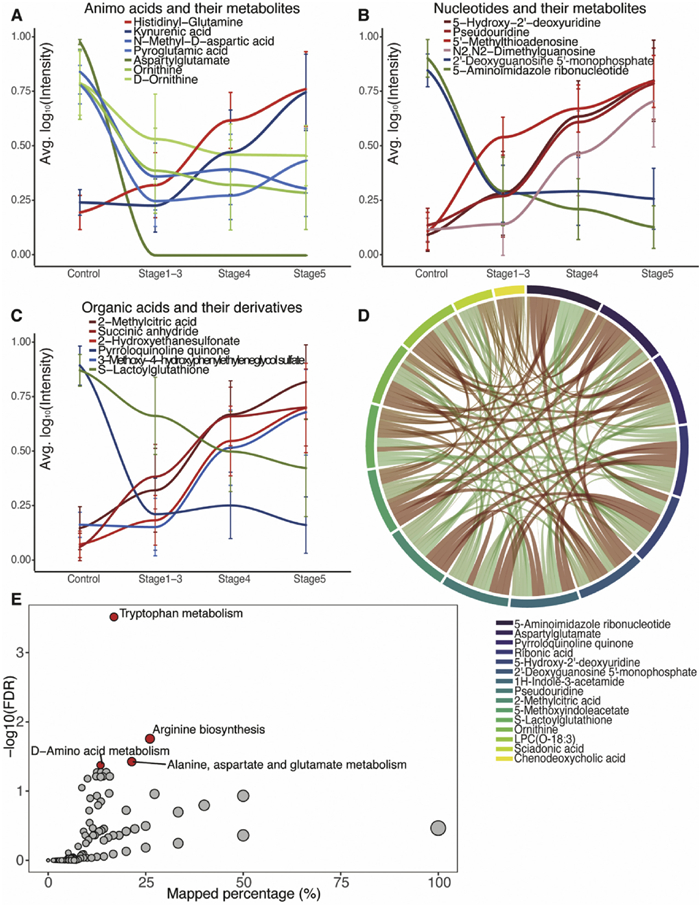
To gain further insights into the metabolic pathways affected by CKD, we performed KEGG pathway analysis (Fig. 3E). We found four significantly altered pathways with FDR below 0.05, all of which were related to amino acid metabolism. These findings shed light on the specific classes of metabolites that undergo significant changes in CKD and highlight the altered metabolic pathways associated with the disease.
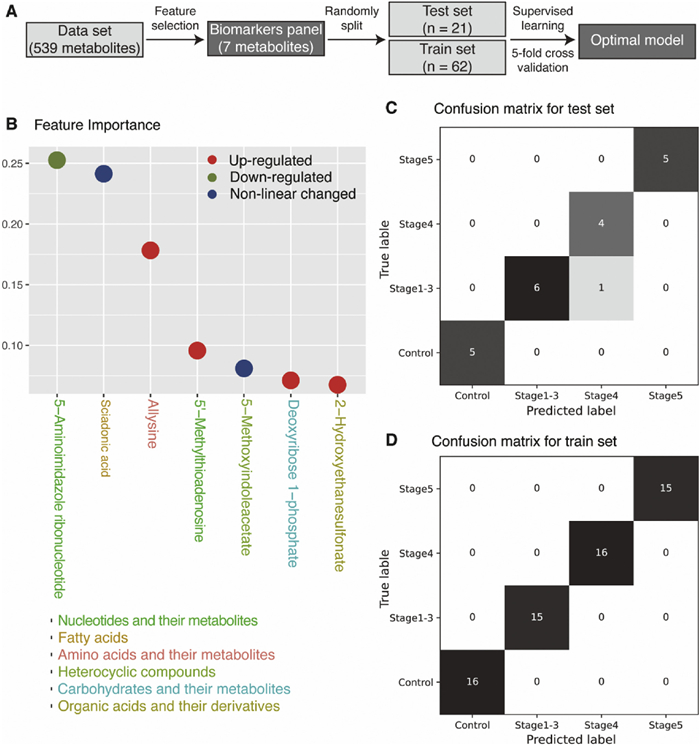
Machine-learning technique was utilized to determine the most effective combination of metabolites for predicting different stages of CKD (Fig. 4A). The process involved feature selection through a random forest model to identify the most important metabolites from the initial pool of 539 endogenous metabolites, resulting in an optimal panel of 7 metabolites (Fig. 4B). Subsequently, various machine-learning models, including random forest, logistic regression, linear support vector machine (SVM), kernel SVM, and multiple perception machine, were employed to fit the dataset (n = 83) comprising of the 7 metabolites. Grid search and 5-fold cross validation were performed for each model to determine the best parameters. Based on high accuracy and average f1 scores in both the training and testing sets (Table S4 in Supporting information), the random forest model was chosen as the final model. The implemented optimal model effectively predicts the stages of CKD in both the test set (Fig. 4C) and the training set (Fig. 4D).
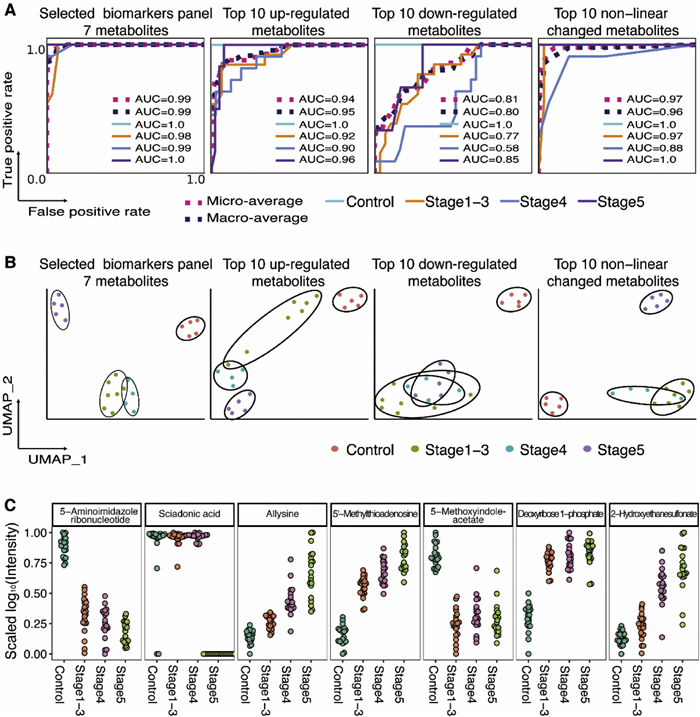
To validate the performance of the selected biomarker panel, we compared it with three other combinations of metabolites, the top 10 up-regulated metabolites, top 10 down-regulated metabolites, and the top 10 metabolites with non-linear changes. We fitted each combination of metabolites using the random forest model and plotted the receiver operating characteristic (ROC) curves in the test set. The area under the ROC curves (AUC) was calculated for each metabolite combination (Fig. 5A). In the 7-metabolite model, AUC scores for each group range from 0.98 to 1.0 and the micro-average and macro-average AUC scores are 0.99, presenting the highest performance over the other three combinations of metabolites. We also utilized Uniform Manifold Approximation Projection (UMAP) analysis to validate the ability of each metabolite combination to cluster the subjects (Fig. 5B). Both supervised and unsupervised machine-learning techniques confirmed that the 7-metabolite panel exhibited the highest performance (Fig. 5B). Fig. 5C shows the levels change of these 7 metabolites across different stages of CKD. These findings highlight the potential significance of these metabolites and their involvement in metabolic pathways and cellular processes related to kidney impairment in CKD. Collectively, these results demonstrate the robustness and accuracy of the 7-metabolite panel in predicting different stages of CKD.
Among the 7 metabolites identified, 5-aminoimidazole ribonucleotide emerged as the most significant feature. This compound, an intermediate in purine nucleotide biosynthesis and a substrate for various proteins, exhibited a decreasing trend from normal function to end-stage renal disease. Additionally, 5′-methylthioadenosine, another nucleotide metabolite included in the selected panel, is a byproduct of polyamine biosynthesis and is exclusively metabolized by 5′-methylthioadenosine phosphorylase. We noted an increasing accumulation of 5′-methylthioadenosine, which may potentially inhibit the enzymatic activity of protein arginine methyltransferase PRMT5 [30]. Sciadonic acid, a non-methylene-interrupted polyunsaturated long-chain fatty acid, has been recognized as a potent inhibitor of arachidonic acid metabolism by cyclooxygenase in human platelets [31]. Allysine, a lysine derivative, results from lysyl oxidase enzyme activity in the extracellular matrix and plays a crucial role in the cross-link formation that stabilizes collagen and elastin. Disruption in this process contributes to the pathology of fibrotic and metastatic diseases [32]. 5-Methoxyindoleacetate, a metabolite of tryptophan formed through oxidative deamination, has been identified as a biomarker for predicting the efficacy of tacrolimus in renal transplant patients [33]. Deoxyribose 1-phosphate, known for its proangiogenic properties, participates in the biosynthesis and degradation pathways of several nucleoside analogues [34]. Lastly, 2-hydroxyethanesulfonate, which may be linked to gut microbiota, has been associated with an increased risk of developing type 2 diabetes [35,36]. Collectively, these findings underscore the importance of these metabolites in metabolic pathways and cellular processes that are relevant to kidney dysfunction in CKD.
In summary, we have introduced a highly effective and sensitive WT-Met technology. This approach offers comprehensive, sensitive, and accurate detection and quantification of metabolites, providing a deeper understanding of the metabolic changes associated with diseases. With WT-Met, we are able to identify and quantify 1431 compounds from plasma samples. Focusing on the 539 endogenous metabolites, we employed machine-learning algorithm to identify 7 metabolites that could accurately differentiate patients in different stages of CKD. The identification of 7 metabolites as potential diagnostic biomarkers and therapeutic targets holds promise for improving CKD management. Further extensive validation in diverse populations with larger sample sizes is necessary before it can be recommended for clinical use. Additionally, it is important to thoroughly investigate the specific mechanisms underlying the alterations of these metabolites during CKD progression. Overall, our study serves as a starting point for further understanding the physiological roles and metabolic networks involving these implicated metabolites.
The authors declare that they have no known competing financial interests or personal relationships that could have appeared to influence the work reported in this paper.
The work is supported by the National Key R&D Program of China (Nos. 2022YFC3400700, 2022YFA0806600), the Key Research and Development Project of Hubei Province (No. 2023BCB094), the Interdisciplinary Innovative Talents Foundation from Renmin Hospital of Wuhan University (No. JCRCGW-2022–008), and the Key Laboratory of Hubei Province (No. 2021KFY005).
Supplementary material associated with this article can be found, in the online version, at doi:
T.K. Chen, D.H. Knicely, M.E. Grams, JAMA 322 (2019) 1294–1304. doi: 10.1001/jama.2019.14745
K. Kalantar-Zadeh, T.H. Jafar, D. Nitsch, B.L. Neuen, V. Perkovic, Lancet 398 (2021) 786–802. doi: 10.1016/S0140-6736(21)00519-5
J. Coresh, L.A. Inker, Y. Sang, et al., Nephrol. Dial. Transp. 34 (2019) 825–833. doi: 10.1093/ndt/gfy094
P. Romagnani, G. Remuzzi, R. Glassock, et al., Nat. Rev. Dis. Primers 3 (2017) 1–24.
T. Buergel, J. Steinfeldt, G. Ruyoga, et al., Nat. Med. 28 (2022) 2309–2320. doi: 10.1038/s41591-022-01980-3
Q.F. Zhang, H.M. Xiao, J.T. Zhan, B.F. Yuan, Y.Q. Feng, Chin. Chem. Lett. 33 (2022) 4746–4749. doi: 10.1016/j.cclet.2022.01.004
G.D. Cao, Z.B. Song, Z.Y. Yang, et al., Chin. Chem. Lett. 32 (2021) 3207–3210. doi: 10.1016/j.cclet.2021.03.052
H.Z. Zhao, Y.Y. Zheng, L. Zhu, et al., Chin. Chem. Lett. 33 (2022) 3139–3143. doi: 10.1016/j.cclet.2021.10.001
S.A. Baker, J. Rutter, Nat. Rev. Mol. Cell. Biol. 24 (2023) 355–374. doi: 10.1038/s41580-022-00572-w
P. Schlosser, M.E. Grams, E.P. Rhee, Mol. Cell. Proteomics 22 (2023) 100550. doi: 10.1016/j.mcpro.2023.100550
M. Hannan, S. Ansari, N. Meza, et al., Clin. J. Am. Soc. Nephrol. 16 (2021) 648–659. doi: 10.2215/CJN.07830520
E.P. Rhee, S.S. Waikar, C.M. Rebholz, et al., Clin. J. Am. Soc. Nephrol. 14 (2019) 40–48. doi: 10.2215/CJN.07070618
A. Bauermeister, H. Mannochio-Russo, L.V. Costa-Lotufo, A.K. Jarmusch, P.C. Dorrestein, Nat. Rev. Microbiol. 20 (2022) 143–160. doi: 10.1038/s41579-021-00621-9
S.L. Collins, I. Koo, J.M. Peters, P.B. Smith, A.D. Patterson, Annu. Rev. Anal. Chem. 14 (2021) 467–487. doi: 10.1146/annurev-anchem-091620-015205
T.M. Domenick, E.L. Gill, V. Vedam-Mai, R.A. Yost, Anal. Chem. 93 (2021) 546–566. doi: 10.1021/acs.analchem.0c04363
M.Y. Chen, Z. Gui, K.K. Chen, et al., Chin. Chem. Lett. 33 (2022) 2086–2090. doi: 10.1016/j.cclet.2021.08.094
M.Y. Chen, C.B. Qi, X.M. Tang, et al., Chin. Chem. Lett. 33 (2022) 3772–3776. doi: 10.1016/j.cclet.2021.12.008
Y.Y. Chen, Z. Gui, D. Hu, et al., Chin. Chem. Lett. 35 (2024) 108522. doi: 10.1016/j.cclet.2023.108522
X.M. Tang, T.T. Ye, X.J. You, et al., Chin. Chem. Lett. 34 (2023) 107531. doi: 10.1016/j.cclet.2022.05.045
W.B. Tao, N.B. Xie, Q.Y. Cheng, Y.Q. Feng, B.F. Yuan, Chin. Chem. Lett. 34 (2023) 108243. doi: 10.1016/j.cclet.2023.108243
X.J. You, L. Li, T.T. Ji, et al., Chin. Chem. Lett. 34 (2023) 107181. doi: 10.1016/j.cclet.2022.01.074
S. Alseekh, A. Aharoni, Y. Brotman, et al., Nat. Methods 18 (2021) 747–756. doi: 10.1038/s41592-021-01197-1
L. Chen, W. Lu, L. Wang, et al., Nat. Methods 18 (2021) 1377–1385. doi: 10.1038/s41592-021-01303-3
B. Gao, J. Wang, L. Zhang, S. Zhuang, Chronic Renal Disease, 2nd. ed., Elsevier, Amsterdam, 2020.
L. Xiang, Y. Ru, J. Shi, et al., Anal. Chem. 95 (2023) 2183–2191. doi: 10.1021/acs.analchem.2c02507
X. Meng, H. Pang, F. Sun, et al., Anal. Chem. 93 (2021) 10075–10083. doi: 10.1021/acs.analchem.1c00767
E. Stancliffe, M. Schwaiger-Haber, M. Sindelar, et al., Anal. Chem. 94 (2022) 17370–17378. doi: 10.1021/acs.analchem.2c01270
J. Houriet, W.S. Vidar, P.K. Manwill, D.A. Todd, N.B. Cech, Anal. Chem. 94 (2022) 17964–17971. doi: 10.1021/acs.analchem.2c04088
T.D. Schneider, T. Kraemer, A.E. Steuer, Anal. Chem. 95 (2023) 16575–16584. doi: 10.1021/acs.analchem.3c02707
K.J. Mavrakis, E.R. McDonald, M.R. Schlabach, et al., Science 351 (2016) 1208–1213. doi: 10.1126/science.aad5944
E.J. Baker, E.A. Miles, P.C. Calder, Prog. Lipid Res. 82 (2021) 101097. doi: 10.1016/j.plipres.2021.101097
P.A. Waghorn, B.L. Oliveira, C.M. Jones, A.M. Tager, P. Caravan, J. Chromatogr. B Analyt. Technol. Biomed. Life Sci. 1064 (2017) 7–13. doi: 10.1016/j.jchromb.2017.08.032
X.Y. He, X. Yang, X.T. Yan, et al., Molecules 27 (2022) 3517. doi: 10.3390/molecules27113517
N. Hamon, M. Slusarczyk, M. Serpi, J. Balzarini, C. McGuigan, Bioorg. Med. Chem. 23 (2015) 829–838. doi: 10.1016/j.bmc.2014.12.039
Z. Krejcik, K. Hollemeyer, T.H.M. Smits, A.M. Cook, Microbiology 156 (2010) 1547–1555. doi: 10.1099/mic.0.036699-0
L. Shi, C. Brunius, M. Lehtonen, et al., Diabetologia 61 (2018) 849–861. doi: 10.1007/s00125-017-4521-y

Figure 1 WT-Met approach. (A) Schematic illustration of the study design. (B) The workflow of the WT-Met approach.

Figure 2 Significantly altered metabolites across the progression of CKD. (A) False discovery rate (FDR) for analysis of variance among the four groups. (B) Top 10 altered metabolites in up-regulated, down-regulated, and non-linear groups. (C) Top 30 altered metabolites in up-regulated, down-regulated, and non-linear groups.

Figure 3 Altered groups of metabolites and pathways during CKD progression. (A) Changing tendency of 7 amino acids and their metabolites among the top 30 altered metabolites. (B) Changing tendency of 6 nucleotide and their metabolites among the top 30 altered metabolites. (C) Changing tendency of 6 organic acids and their derivatives among the top 30 altered metabolites. (D) Correlation of the top 15 metabolites (5 metabolites in each group). (E) KEGG pathway analysis.

Figure 4 Biomarkers panel selected by machine-learning. (A) Metabolites selection pipeline using machine-learning. (B) Selected 7 metabolites. (C) Confusion matrix of the 7-metabolite biomarker panel by random forest in the test set. (D) Confusion matrix of the 7-metabolite biomarker panel by random forest in the train set.

Figure 5 Predicting different stages of CKD using different combination of metabolites. (A) ROCs in test set using 7-metabolite panel, top 10 up-regulated metabolites, top 10 down-regulated metabolites, and top 10 non-linear changed metabolites. (B) UMAP for clustering 83 subjects using 7-metabolite panel, top 10 up-regulated metabolites, top 10 down-regulated metabolites, and top 10 non-linear changed metabolites. (C) Scaled log10(Intensity) distribution of the 7 metabolites in four groups.

 扫一扫看文章

扫一扫关注我们
 DownLoad:
 下载:
下载: