Xiaodong@muc.edu.cn (X. Wang). 1 These authors contributed equally to this work.
Received Date:
15 September 2023 Accepted Date:
04 February 2024 Revised Date:
12 January 2024 Available Online:
15 November 2024
Abstract:
Endogenous metabolites play key functions in many important physiological and biochemical processes. The comprehensive in situ detection and direct imaging of metabolites in bio-tissues by matrix-assisted laser desorption/ionization mass spectrometry imaging (MALDI-MSI) is very important for understanding complex and diverse biological processes and has become an essential aspect of spatial omics. In this work, 4-aminoazobenzene (AAB) was successfully screened and optimized as a new negative ion (−)MALDI matrix to enhance the in situ detection and imaging of metabolites in tissues using MALDI-MSI. Obviously, AAB exhibited superior properties in terms of ultraviolet absorption, background ion interference, matrix morphology, and metabolite ionization efficiency. AAB was used for in situ detection and imaging of metabolites in rat brain and germinating Chinese yew seed tissue sections, where 264 and 339 metabolite ion signals were successfully detected and imaged using (-)MALDI-MS, respectively. In addition, high-resolution imaging of mouse eyeball section using MALDI-timsTOF MSI with spatial resolution of up to 10 µm was successfully carried out, showing that AAB is an efficient (-)MALDI matrix for capturing high-resolution images of metabolites in biological tissue sections.
Endogenous metabolites originated from various physiological and biochemical processes, play crucial roles in cellular energy metabolism, signal transmission, membrane construction, as well as other functions [1]. Previous studies have demonstrated that numerous diseases, such as cardiovascular diseases [2], neurological disorders [3], and cancers [4], are linked to the imbalanced or abnormal metabolite expression in vivo. Thus, the thorough in situ detection and direct imaging of metabolites within bio-tissues have increasingly become an important aspect for metabolomics research in advancing knowledge about functions and alterations of metabolites in diverse physiological and biochemical processes [5].
Matrix-assisted laser desorption/ionization mass spectrometry imaging (MALDI-MSI) is a newly developed label-free molecular snapshot technology, that has progressively become a standard analytical tool for the high-throughput in situ detection and imaging of numerous endogenous compounds (e.g., nucleotides, lipids, and proteins) in biological tissue sections [6]. So far, MALDI-MSI has been used in a wide range of areas, such as pharmacology [7,8], botany [9], zoology [10], basic medicine [11,12].
In MALDI-MSI experiments, matrix selection is typically considered a key step in achieving high-performance imaging of compounds from the surface of bio-tissue sections [13]. An appropriate matrix means a better co-crystalline molecular layer between the matrix and the target molecules, enhancing efficient ionization of target compounds by strong absorption of laser energy with no or few interferences from matrix-related ions [14]. Currently, tissue metabolomic MALDI imaging in positive-ion mode can be performed using the following matrices, e.g., α-cyano-4-hydroxycinnamic acid (CHCA), 2,5-dihydroxybenzoic acid (DHB), 3,4-dimethoxycinnamic acid (DMCA), 2,3-dicyanohydroquinone (DCH), and hydroxyflavones [15–17]. Although with the application of above excellent matrices, the imaging quality has been significantly improved in positive ion mode, some metabolites would tend to be ionized in the negative ion mode, such as some glycerophospholipids, including phosphatidic acids (PAs), phosphatidylglycerols (PGs), phosphatidylethanolamines (PEs), phosphatidylserines (PSs), and phosphatidylinositols (PIs) [18]. Thus, many negative ion (-)MALDI matrices have been evaluated and used recently, such as 9-aminoacridine (9-AA), 2-mercaptobenzothiazole (2-MBT), 1,8-bis(dimethylamino) naphthalene (DMAN), 2,6-dihydroxyacetophenone (DHAP), 1,5-diaminonapthalene (DAN), and so on [19–21]. The application of the aforementioned matrices has indeed vastly enhanced the in situ characterization of metabolites from bio-tissues in negative ion mode, however, the above matrices still have their shortcomings. For instance, a major drawback of 9-AA and 2-MBT is the generation of high-abundance matrix-associated ion signals which in turn disturbs the analysis of the low-molecular-weight (low-MW, m/z < 500) compounds [15,22]. Meanwhile, both DHAP and DMAN exhibit low vacuum stability, impeding their widespread use in metabolite MALDI imaging in larger tissues [15]. Previous studies have shown that DAN is highly toxic and has been suspected of being carcinogenic, which could put the safety of experimenters at risk [23]. Thus, screening and optimizing novel (-)MALDI matrices that can detect and visualize more endogenous metabolites is still an urgent necessity.
In this study, 4-aminoazobenzene (AAB) is screened and optimized as a novel matrix for the in situ detection and imaging of metabolites on thin-sectioned rat brain and germinating Chinese yew (Taxus chinensis var. mairei) seed tissue slices by (-)MALDI time-of-flight (TOF)/TOF MS using a 355 nm Nd:YAG UV laser. In addition, high-resolution imaging of mouse eyeball section was also successfully performed by MALDI-timsTOF MS using AAB as a matrix. The use of animal organs for this study was performed in accordance with the Regulations for the Administration of Affairs Concerning Experimental Animals of the People’s Republic of China and approved by the Animal Ethics Committee of Minzu University of China. Our results showed that AAB has superior properties in terms of stronger ultraviolet (UV) laser absorption, smaller matrix crystals, more homogeneous matrix deposition, fewer matrix interfering ions, and higher ionization efficiency. We therefore propose AAB as a novel (-)MALDI matrix for noticeably enhancing the in situ detection and imaging of endogenous metabolites in both animal and plant tissue sections.
The UV absorption capacity with high absorption coefficient under the operating laser wavelength, is one of crucial features for a potential MALDI matrix [24]. In this work, the Nd:YAG UV laser (355 nm) was installed on the MALDI-TOF/TOF mass spectrometer. To assess the laser absorption capacity of AAB, the liquid UV-vis absorption spectra of AAB and two widely used matrices (i.e., 2-MBT and 9-AA) had first been examined. Notably, AAB exhibited a wide UV absorption range from 338 nm to 500 nm, with relatively strong absorption at 355 nm in particular (Figs. S1A-C in Supporting information). Moreover, the molar extinction coefficient (ε) of AAB at UV 355 nm has the highest value of 15500 L mol−1 cm−1, compared with 500 L mol−1 cm−1, 1500 L mol−1 cm−1 of 2-MBT, and 9-AA, respectively. Furthermore, we carried out solid-state UV-vis absorption analysis of AAB, 2-MBT, and 9-AA matrices deposited directly on quartz slides, as matrix molecular layers on the tissue sections in MALDI-MS experiments. The AAB matrix also exhibited significantly stronger absorbance at 355 nm compared to 2-MBT and 9-AA matrices (Fig. S1D in Supporting information). These results suggested that AAB has high potential as a new MALDI matrix.
Generally, matrices are prone to fragmentation after absorbing UV energy, producing some low-MW matrix-related ion signals [25], thus limiting their applications for spatial MALDI-MS analysis of endogenous metabolites in biological samples. Thus, we have investigated matrix-related ion signals interference for AAB, 2-MBT, and 9-AA using (-)MALDI-MS (signal-to-noise (S/N) > 3). As shown in Fig. 1, only 16 matrix-related ion signals were detected using AAB as a matrix, which was clearly less than 2-MBT (65 ion signals) and 9-AA (45 ion signals). Compared with the other two matrices, the relatively clean matrix background spectrum from AAB further ensured its advantage as a potential matrix for metabolite detection.
Figure 1
Figure 1.
MALDI-TOF MS spectra detected in the negative ion mode using AAB, 2-MBT, and 9-AA as the matrices. AAB solution was 10.0 mg/mL dissolved in MeOH/H2O/NH3·H2O (80:20:0.1, v/v/v), without optimization. 2-MBT solution was 12.0 mg/mL dissolved in MeOH/H2O/FA (80:20:2, v/v/v). 9-AA solution was 10.0 mg/mL dissolved in EtOH/H2O (70:30, v/v), respectively. The laser energy was maintained at 80%.
Based on preliminary experiments, we evaluated the performance of AAB for metabolite detection by dissolving 10.0 mg/mL in MeOH/H2O/NH3·H2O (80:20:0.1, v/v/v). As shown in Fig. S2 (Supporting information), AAB enabled the clear detection of numerous metabolites in the negative ion mode, whereas no better results were observed in the positive ion mode. According to the Brønsted-Lowry acid-base theory, MALDI matrices that are suitable for negative ion mode detection extract protons from the analyte [26]. The AAB used in this study is an organic base containing an amino group, and we speculate that the amino functional group of AAB accepts protons from the analyte, leading to the formation of the deprotonated and negatively charged analyte [A-H]−. These results proved that AAB is an appropriate MALDI matrix for the detection of metabolites in the negative ion mode.
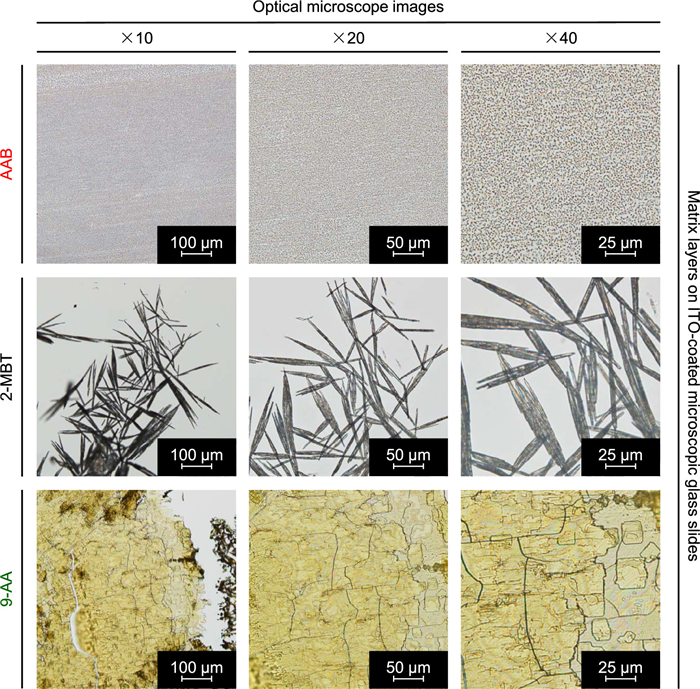
Moreover, matrix crystal homogeneity is one of the basic prerequisites for the great reproducibility of MALDI-MS analysis [27], so we also evaluated the matrix crystal particle state of these three matrices on the surface of glass slides using an Olympus BX53 microscope (Fig. 2). Microscopic experiments confirmed that other matrix coatings tended to form needle-like crystals (2-MBT) or large particles (9-AA), while AAB formed micron-scale crystal sizes (<10 µm) with the best coating homogeneity. This suggested that AAB may be suitable for tissue imaging with a high spatial resolution and high reproducibility of point-to-point data acquisition.
Figure 2
Figure 2.
Comparison of the matrix crystal morphologies of AAB, 2-MBT, and 9-AA coated on ITO conductive glass slides. An Olympus BX53 microscope (Tokyo, Japan) was used for microscopic images acquired under 10×, 20×, and 40× magnification.
To maximize the performance of AAB as a matrix for in situ detection and direct imaging of metabolites, the effects of acidic (0.1% TFA or 1.0% FA) and basic (0.1% NH3·H2O) additives on the detection of AAB matrix were firstly compared (Fig. S3 in Supporting information). After pre-testing, it was found that the addition of NH3·H2O could enhance the detection of AAB matrix. Next, orthogonal array testing was used to optimize the formulation of the AAB matrix solution using aqueous MeOH containing NH3·H2O as a solvent. The concentrations of AAB, MeOH, and NH3·H2O were selected as three crucial experimental variables in the preparation of matrix solution, and more details of three levels for each variable were shown in Fig. S4 (Supporting information). Our results demonstrated that the optimal composition of the AAB solution was determined to be 8.0 mg/mL of AAB solubilized in an aqueous 80% MeOH solution containing 0.1% NH3·H2O, and used for the following experiments.
To accurately evaluate the vacuum stability of the AAB matrix, rat liver tissue sections were coated with AAB, then stored under a high vacuum MALDI source at approximately 10−7 mbar using a modified standby mode. This mode involved switching off the high voltage on the target plate and maintaining the UV laser in a non-excited state to ensure precise evaluation. Fig. S5 (Supporting information) illustrates that the use of the AAB matrix resulted in negligible changes in the intensity of metabolites and the morphology of matrix crystals, even after subjecting the tissue sections to vacuum conditions for up to 48 h. These results suggest that the optimized AAB solution has outstanding chemical stability and low volatility even when exposed to high vacuum environments.
Twenty-seven commercial metabolite standards (i.e., 20 amino acid standards and 7 lipid standards) and two mixed solutions (mixtures of the 20 amino acid standards or 7 lipid standards) were selected to assess the capability of AAB as a negative ion matrix. As shown in Figs. S6 and S7 (Supporting information), all commercial metabolite standards were effectively detectable by (-)MALDI-MS with AAB as the matrix, as well as 20 amino acid and 7 lipid standards were detected in [M-H]− form with very little matrix interference. As shown in Fig. S8 (Supporting information), all metabolite standards coated with AAB were detected with a greater number of metabolite ion signals, and clearer isotopic clusters compared to 2-MBT, and 9-AA. These comparisons demonstrated that the signals of the chosen metabolite standards were readily detectable when AAB served as a matrix, whereas the background ions were barely detected.
To measure the quantitative accuracy of this novel AAB matrix, bradykinin (1-7) standard was employed for the linearity assessment in MALDI-MS analysis. As shown in Fig. S9A (Supporting information), the limit of detection (LOD, S/N = 3) for bradykinin (1-7) was 0.0006 µg/mL. The standard curve plotted for the detection of 30 different concentrations of bradykinin (1-7) standard over a non-linear gradient from 0.0 to 10.0 µg/mL was shown in Fig. S9B (Supporting information), which exhibited a good linear correlation between 0.002 and 2.05 µg/mL (R2 = 0.9925). The limit of quantitation (LOQ) for bradykinin (1-7) was 0.002 µg/mL with an S/N ratio threshold of 9, and the limit of linear response (LOL) was 2.05 µg/mL. These works showed that AAB as a (-)MALDI matrix performed excellently in the quantitative analysis of metabolites, supporting its potential utility for in situ quantification of metabolites from bio-tissue.
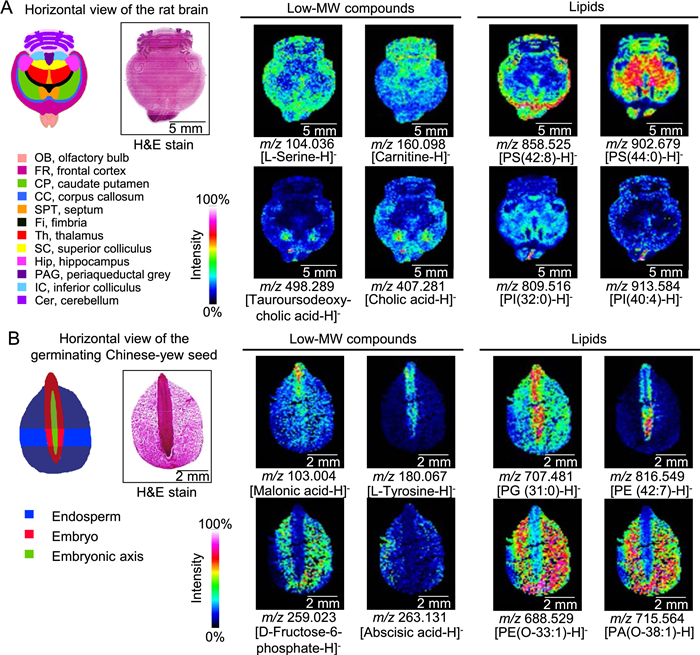
As a promising (-)MALDI matrix, AAB had excellent properties and was used to detect and visualize metabolite composition and spatial distribution in transverse 12 µm rat brain tissue sections. To facilitate the analysis, metabolites were categorized into low-MW compounds (typically m/z < 500) [28] and lipids. Fig. S10 and Table S1 (Supporting information) showed that a total of 264 metabolite ion signals could be detected from a rat brain tissue section. With the combination of MALDI-MS/MS and LC-MS/MS analysis, a total of 207 metabolites were successfully identified, including 108 low-MW compounds (29 carboxylic acids, 6 nucleosides, 23 fatty acyls (FAs), 11 steroids (STs), and other 39 low-MW compounds) and 99 lipids (83 glycerophospholipids (GPs), 6 glycerolipids (GLs), and 10 sphingolipids (SLs)) (Table S2 in Supporting information). In comparison, two widely used MALDI matrices (i.e., 2-MBT and 9-AA) detected only 203 and 103 metabolite ion signals, respectively (Fig. S10 and Table S1 in Supporting information). Notably, the signal intensities of the detectable metabolite ions using AAB as the matrix were substantially higher. Considering the superiority of AAB for MALDI-MS analysis, it was feasible to determine the distributions of metabolites within rat brain tissue sections (Fig. 3A). The H&E-stained section displayed the anatomical structure of the rat brain tissue, including distinguishable regions such as the olfactory bulb (OB), frontal cortex (FR), corpus callosum (CC), caudate putamen (CP), septum (SPT), fimbria (Fi), thalamus (Th), superior colliculus (SC), hippocampus (Hip), periaqueductal grey (PAG), inferior colliculus (IC), and cerebellum (Cer). Moreover, the localization of spatial heterogeneity with regard to different classes of metabolites throughout the brain tissue section can be distinctly observed in these reconstructed metabolite images. For instance, the low-MW compound ion of m/z 104.036 [L-serine-H]− was observed in the OB, FR, SPT, Hip, and the grey matter of Cer, while other low-MW compound detected at m/z 160.098 [carnitine-H]− was mainly found in the complementary areas, i.e., CP, Th, SC, PAG, IC, and Cer. Bile acid ions [cholic acid-H]− and [tauroursodeoxycholic acid-H]− (m/z 407.281 and m/z 498.289) were clearly present in the regions of OB, Cp, and Hip, which may be related to their biological and physiological functions in the central nervous system [29]. In addition, the lipid ion of PS detected at m/z 858.525 [PS(42:8)-H]− were predominantly distributed within OB, FR, SPT, Hip, and the grey matter of Cer, while the lipid ion detected at m/z 902.679 [PS(44:0)-H]− was mostly observed in the CC, CP, Fi, Th, SC, PAG, IC, and the white matter of Ce. As the most prevalent negatively charged phospholipids in eukaryotic membranes [30], the different distribution patterns of PSs in specific rat brain regions likely reflect structural and functional differences. Notably, certain lipids, such as m/z 809.516 [PI(32:0)-H]− and m/z 913.584 [PI(40:4)-H]−, were distributed only in the OB, and it remains to be further determined whether these lipids play a role in odor encoding and neural characterization [31]. Our results implied that AAB would be an excellent negative ion matrix for MALDI-TOF analysis to detect and image these essential metabolites from animal tissue slices.
Figure 3
Figure 3.
The selected ion maps of metabolites detected from rat brain (A) and germinating Chinese yew (Taxus chinensis var. mairei) seed (B) tissue sections by MALDI-TOF/TOF MS in negative ion mode using AAB as the matrix. The H&E-stained image was obtained from the same tissue section after MSI. MS imaging was acquired at 200 µm and 100 µm spatial resolutions, respectively.
To assess the effect of the AAB matrix for metabolite detection and imaging in plant tissues, the serial parallel 20 µm thick sections of germinating Chinese yew seed were taken as target tissue slices for metabolite analysis by (-)MALDI-TOF MS. Fig. S11 (Supporting information) showed the effective detection of 339 metabolite ion signals in germinating Chinese yew seed slice. A total of 257 metabolites were successfully identified using MALDI-MS/MS coupled with LC-MS/MS analysis, including 81 low-MW compounds (18 carboxylic acids, 3 nucleosides, 14 FAs, 7 STs, and other 39 low-MW compounds) and 176 lipids (157 GPs and 19 GLs) (Table S3 in Supporting information). As shown in Fig. S11 and Table S4 (Supporting information), only 238 and 173 metabolites were detected by the use of 2-MBT and 9-AA, respectively, all of which are significantly lower than the 339 metabolite ions that were detected with AAB. Fig. 3B showed several chosen metabolite images in germinating Chinese yew seed slice with apparently inhomogeneous distributions. As shown, two low-MW compound ions, i.e., m/z 103.004 [malonic acid-H]−, and m/z 180.067 [l-tyrosine-H]−, were clearly observed in the region of the embryo and embryonic axis. Meanwhile, the low-MW compound ion of m/z 259.023 [d-fructose-6-phosphate-H]− was primarily found in the endosperm region, and the ion detected at m/z 263.131 [abscisic acid-H]− was only found in the outer edge of the endosperm. The unique distribution of these low-MW compounds on tissue may be related to seed germination, where they perform key functions in numerus biological activities in plants. Moreover, the imaging maps of selected lipid ions were also illustrated in Fig. 3B. Among them, two lipid ions detected at m/z 688.529 [PE(O-33:1)-H]−, and m/z 715.564 [PA(O-38:1)-H]− were predominantly distributed in the endosperm region of the seed, while two lipid ions of m/z 707.481 [PG(31:0)-H]−, and m/z 816.549 [PE(42:7)-H]− were clearly found in the complementary region, i.e., embryo and embryonic axis. Phospholipids are known to be vital components of bio-membranes and signal transmission processes; therefore, the spatial heterogeneity of phospholipid distribution in plant tissues can reflect the structural and functional differences between different tissues or cells in the section region [32]. These results showed that AAB is an excellent matrix for (-)MALDI-MS analysis in plant samples, indicating its potential as a novel negative ion matrix to enhance in situ detection and direct imaging of metabolites in other plant tissues.
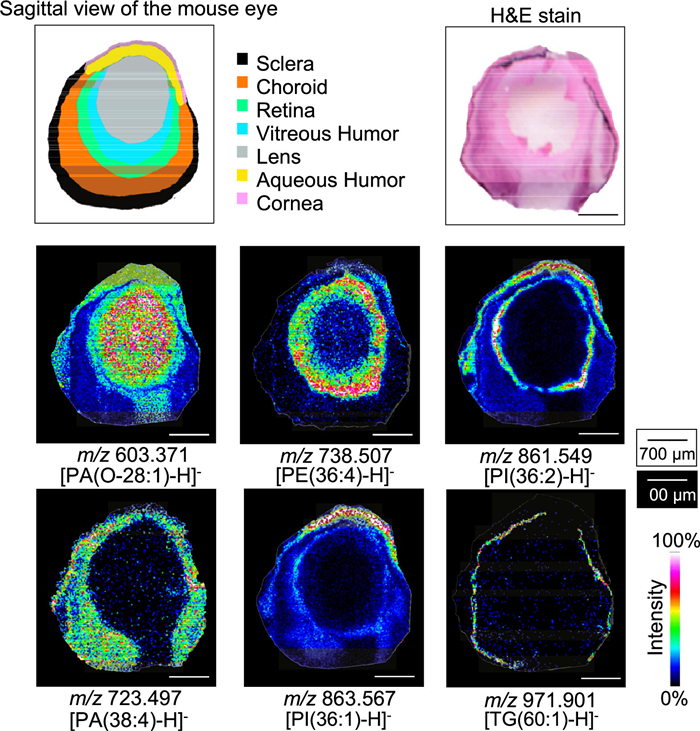
Given that the AAB matrix is capable of forming crystalline particles of less than 10 µm size, we expect to further confirm its suitability for high-resolution imaging of bio-tissues. Due to the small volume and significant tissue heterogeneity characteristic of mouse eye samples, we therefore chose them for in situ high-resolution imaging using MALDI-timsTOF MS with a spatial resolution of 10 µm. After staining the longitudinal section of mouse eye with H&E reagent, it was obvious that the mouse eye tissue section includes sclera, choroid, retina, vitreous humor, lens, aqueous humor, and cornea (Fig. 4). As shown, metabolite ions detected at m/z 603.371 [PA(O-28:1)-H]− were distributed within the lens and aqueous regions of mouse eyeball tissue section. The metabolite ions detected at m/z 738.507 [PE(36:4)-H]− were primarily distributed in the retina and vitreous, whereas ion of m/z 861.549 [PI(36:2)-H]− were predominantly found in the cornea and retina. The metabolite ion of m/z 723.497 [PA(38:4)-H]− were only distributed in choroid region, while the metabolite ion at m/z 863.567 [PI(36:1)-H]− were exclusive to the corneal region. Additionally, the metabolite ion of m/z 971.901 [TG(60:1)-H]− was solely present in the sclera region. The high spatial resolution of MALDI imaging facilitated the observation of intricate structural details within the mouse eye region. Our results suggest that AAB serves as a highly effective (-)MALDI matrix for capturing high-resolution images of metabolites within biological tissue sections.
Figure 4
Figure 4.
The selected ion maps of metabolites detected from mouse eyeball tissue section by MALDI-timsTOF MS in negative ion mode using AAB as the matrix. The H&E-stained image was obtained from the same tissue section after MSI. MS imaging was acquired at 10 µm spatial resolutions.
In conclusion, AAB has been successfully screened and optimized as a novel negative ion matrix for in situ metabolite detection and imaging by MALDI-MSI on thin slices of rat brain and germinating Chinese yew seed. This study demonstrated several excellent properties of AAB, including strong UV laser absorption at 355 nm, low matrix-related ion interference, µm-scale crystal particles, outstanding matrix coating uniformity, and high ionization efficiency of metabolites. In addition, AAB outperformed two commonly used matrices (i.e., 2-MBT and 9-AA) with respect to the number and signal intensity of metabolites detected and imaged in both animal and plant tissue sections. A total of 264 and 339 metabolite ion signals were effectively detected using AAB as a matrix from rat brain and germinating Chinese yew seed tissue slices, respectively. And these different distribution patterns of metabolites provide strong support for further investigation of the metabolic mechanisms, which may contribute to discovering potential biomarkers in the physiological and biochemical processes from biological samples. Meanwhile, high-resolution imaging of mouse eyeball was also successfully performed using AAB as a (-)MALDI matrix, revealing the complex structural details in the mouse eye region. In summary, our study demonstrates the superiority of AAB as the novel and powerful (-)MALDI matrix for the enhancement of in situ metabolite detection and imaging in both animal and plant samples, enhancing the applicability of MALDI tissue imaging in metabolomics.
Declaration of competing interest
The authors declare that they have no known competing financial interests or personal relationships that could have appeared to influence the work reported in this paper.
Acknowledgments
This work was supported by the National Natural Science Foundation of China (Nos. 31770384 and 21605164), the Youth Academic Team Project of MUC (No. 10301-02200301), the Huayi Technology Innovation Center for Research Resources (No. HTIC P01RR2017001A), and the Key Laboratory Construction Funds of State Ethnic Affairs Commission of China (No. 10301-02200303).
Supplementary materials
Supplementary material associated with this article can be found, in the online version, at doi:10.1016/j.cclet.2024.109624.
Figure 1
MALDI-TOF MS spectra detected in the negative ion mode using AAB, 2-MBT, and 9-AA as the matrices. AAB solution was 10.0 mg/mL dissolved in MeOH/H2O/NH3·H2O (80:20:0.1, v/v/v), without optimization. 2-MBT solution was 12.0 mg/mL dissolved in MeOH/H2O/FA (80:20:2, v/v/v). 9-AA solution was 10.0 mg/mL dissolved in EtOH/H2O (70:30, v/v), respectively. The laser energy was maintained at 80%.
Figure 2
Comparison of the matrix crystal morphologies of AAB, 2-MBT, and 9-AA coated on ITO conductive glass slides. An Olympus BX53 microscope (Tokyo, Japan) was used for microscopic images acquired under 10×, 20×, and 40× magnification.
Figure 3
The selected ion maps of metabolites detected from rat brain (A) and germinating Chinese yew (Taxus chinensis var. mairei) seed (B) tissue sections by MALDI-TOF/TOF MS in negative ion mode using AAB as the matrix. The H&E-stained image was obtained from the same tissue section after MSI. MS imaging was acquired at 200 µm and 100 µm spatial resolutions, respectively.
Figure 4
The selected ion maps of metabolites detected from mouse eyeball tissue section by MALDI-timsTOF MS in negative ion mode using AAB as the matrix. The H&E-stained image was obtained from the same tissue section after MSI. MS imaging was acquired at 10 µm spatial resolutions.


 DownLoad:

 下载:
下载:


