Received Date:
27 November 2023 Accepted Date:
04 January 2024 Revised Date:
19 December 2023 Available Online:
15 November 2024
Abstract:
Multi-response metal cluster supercrystal materials, which can simultaneously display various such as color, photoluminescence, changes by bearing only one stimulus, have huge potential as stimuli-responsive intelligent material, but are rarely reported. Here, we report three Cu8 cluster supercrystals, Cu8-1, Cu8-2, and Cu8-3, with homologous cluster molecule units [Cu8(PNP)3(EPPTA)6](PF6)2 but distinct packing. These supercrystals display bright µs-long photoluminescence with a high quantum yield of up to 26.6% in solid-state at room temperature and aggregation-induced emission (AIE) characteristic. Superior thermal stability and blue-excitable bright yellow emission make Cu8-3 serve as a yellow phosphor for white light-emitting diode. Furthermore, upon being stimulated by solvent vapor and temperature, reversible supercrystal-to-supercrystal transformations can be witnessed accompanied by remarkable color and luminescence switching. This work not only provides a kind of Cu cluster supercrystal model but also motivates the further development of metal clusters in multi-response materials.
Stimulus-responsive optical materials undergoing reversible color and/or luminescence changes in response to numerous external stimuli (e.g., organic vapors, temperature, light, pressure) are becoming increasingly attractive owing to their potential applications in new intelligent devices, such as optical switches, sensors, and actuator [1-5]. These smart optical materials can provide reversible optical signals directly discerned by naked eye to monitor surrounding environment changes. In past decades, various stimulus-responsive optical materials including organic [6], supramolecular [7], organometallic [8], covalent [9], and coordination complexes have been designed and synthesized. However, reasonably designing and fabricating the stimulus-responsive optical materials remain challenging due to tedious synthesis, complex response mechanism, and high cost [10], especially for the multi-response optical materials, which can simultaneously show multiple changes such as color, photoluminescence, changes by bearing only one stimulus. Thus, development of new stimulus-responsive optical materials with simple synthesis process, precise structure, sensitivity, and high photostability is needed.
Atomically precise monolayer-protected coinage metal (Cu, Ag, Au) clusters with ultrasmall size bridging discrete atoms and bulk matter are fast explored in synthetic strategies, structure types, various applications, etc. [11-15]. Surface ligands of metal clusters can not only protect the metal core and stabilize structure but also endow various surface chemical environments to metal clusters, which frequently play an important role in cluster self-assembly and affect photophysical properties [16-21]. Upon aggregation, intermolecular non-covalent interactions (e.g., hydrogen bonding, halogen bonding, electrostatic, π···π, C–H···π, van der Waals interactions) would drive bottom-up self-organization of cluster units leading to supercrystals or superlattices [22-27]. As an attractive property, the photophysical behavior of metal clusters is generally related to the metal core and ligands [28-33]. Uniquely, the intra- or intercluster weak metallophilic interactions may display remarkable responsive behaviors to numerous external stimuli (e.g., organic vapors, temperature, light, pressure) giving dramatic visual photoluminescence and color changes [27,34]. In general, when bearing external stimuli in solution or the solid state, the cluster skeleton will suffer from irreversible modulation. However, it is very rare in coinage metal clusters, especially for Cu clusters, to observe the reversible transformation of color and photoluminescence triggered by chemical vapor or temperature resulting in distinct packing change but without dramatically deforming the cluster structures from crystal to crystal [4,8,35,36].
Herein, by 2,6-bis(diphenylphosphino)pyridine (PNP) and 10-(4-ethynylphenyl)−10H-phenothiazine (HEPPTA) ligands, we first prepared in high yield and structurally characterized a Cu8 cluster single crystal, abbreviated as Cu8-1, which crystallized in the cubic P-1 space group and featured distinct both red color and red emission with a peak centered at 614 nm with a photoluminescence quantum yield (PLQY) of 13.3%. Wondrously, the red crystal Cu8-1 can be spontaneously transformed to the other yellow Cu8 cluster crystal, denoted as Cu8-3, showing yellow photoluminescence with a maximum wavelength at 578 nm (PLQY = 26.6%), via treating with acetone vapor. Interestingly, when heated at 180 ℃ for 20 min, yellow Cu8-3 will be reversibly turned into red Cu8-1. However, another yellow crystal, denoted as Cu8-2, can be harvested after Cu8-3 suffers from heating at 50 ℃ for 1 h, showing the same solid-state optical absorption but an emission behavior with a redshift of 20 nm compared to Cu8-3 crystal. Furthermore, the reversible transformation from Cu8-2 to Cu8-3 could also be promoted by acetone vapor. According to a series of experiments, clusters Cu8-2 and Cu8-3 with the molecular formula of [Cu8(PNP)3(EPPTA)6](PF6)2(CH2Cl2)5.5 and [Cu8(PNP)3(EPPTA)6](PF6)2(C2H5OH)2, respectively, could also be isolated in different mixed solvent. Undoubtedly, this vapor- and temperature-induced reversible supercrystal transformation combining color and photoluminescence is very rare for coinage-metal clusters. The absorption edge of the monomeric Cu8 cluster is about 500 nm and all these Cu8 clusters display remarkable aggregation-induced emission (AIE) behaviors. In contrast, the solid-state absorption band is red-shifted to 600 nm for Cu8-1 and 550 nm for Cu8-2 and Cu8-3.
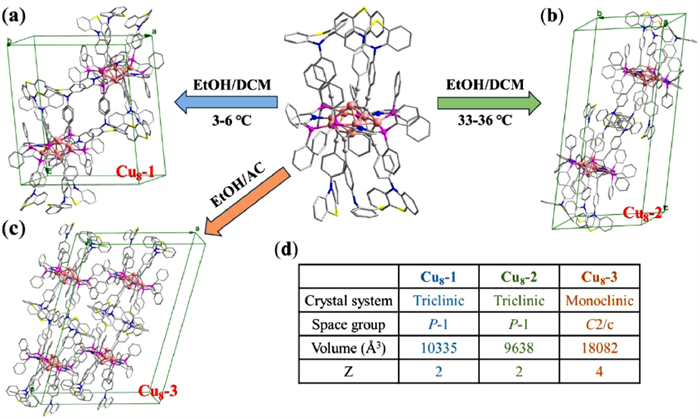
The Cu8-1, Cu8-2 and Cu8-3 clusters could be synthesized in situ in a high-yield and simple synthetic approach. The reaction of [Cu(CH3CN)4](PF6), PNP and HEPPTA (Scheme S1 and Figs. S1-S3 in Supporting information) with a little triethylamine (NEt3) in CH2Cl2 was first conducted resulting in the crude products. Red Cu8-1 and yellow Cu8-2 were obtained as single crystals by recrystallization of the crude products in CH2Cl2 (DCM) via slow diffusion of ethanol (EtOH) at 3-6 ℃ and room temperature, respectively, and the yellow Cu8-3 clusters crystallized using the same crude products in acetone (AC) by slow diffusion of ethanol under ambient conditions. Cu8-1 and Cu8-2 crystallized in the same solution but at different ambient temperatures, which resulted in the same crystal space group but different unit cells and intrinsic absorbance, indicating that the cluster crystallization is highly sensitive to the crystallization rate. In addition, the crystal materials of three Cu8 clusters could also be harvested by the vapor or temperature-triggered reversible transformation processes.
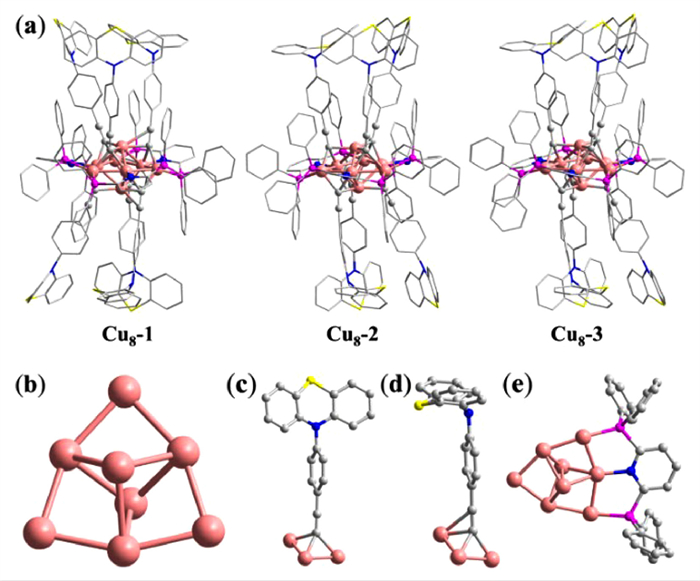
Detailed molecular structures of Cu8-1, Cu8-2 and Cu8-3 were determined by single-crystal X-ray diffraction (SC-XRD) analysis. Cu8-1 crystallized in a triclinic crystal system with a space group of P-1 and a cell volume of 10,335 Å3 (Table S1 in Supporting information). In Cu8-1 single crystal structure, there were two Cu8 ([Cu8(PNP)3(EPPTA)6](PF6)2) cluster units in the unit cell. As shown in Fig. 1, Cu8 cluster shows a columnar structure, in which the Cu8 metal core can be regarded as three Cu atoms forming a Reuleaux-like triangular ring with a triangular bipyramid of Cu5 in the center (Fig. 1b and Fig. S4a in Supporting information). The Cu-Cu bond distances are in the range of 2.483‒2.564 Å, which are shorter than the Cu-Cu van der Waals distance of 2.8 Å, indicating metallic bonding. Then, three EPPTA ligands further cover the two surfaces of Cu8 metal core through Cu-C coordinate bonds, respectively, forming the columnar structure (Figs. S4b and c in Supporting information). Four EPPTA ligands were found to adopt a µ3–η1σ1σ1σ ligation mode (Fig. 1c), while the other two EPPTA take a µ3–η1σ1σ2π mode (Fig. 1d). In addition, the σ-type dCu–C ranged from 1.995 Å to 2.140 Å, and the π-type dCu–C were 2.505 Å and 2.528 Å Three PNP ligands are ligatured on the Cu8 metal core through Cu-P and Cu-N coordinate bonds around the waist of the columnar structure with an average Cu-P bond length of 2.32 Å and Cu-N bond length of 2.04 Å (Fig. 1e and Fig. S4d in Supporting information). Furthermore, the cationic [Cu8(PNP)3(EPPTA)6]2+ is surrounded by two PF6‒ as counterions.
Figure 1
Figure 1.
The crystal structures of Cu8-1, Cu8-2 and Cu8-3. (a) Overall structure. (b) Metal core of Cu8. (c) σ and (d) π ligation modes of the EPPTA ligand with Cu atoms. (e) The monodentate mode of PNP ligand. Color code: light rose = copper; gray = carbon; pink = phosphorus; yellow = sulfur; blue = nitrogen. H atoms are omitted for clarity. (For interpretation of the references to color in this figure legend, the reader is referred to the web version of this article.)
Cu8-2 is also crystallized in a triclinic crystal system with the space group of P-1 and a cell volume of 9638 Å3 (Fig. 2 and Table S1 in Supporting information). The molecular structure of Cu8-2 is very similar to Cu8-1 (Fig. 1a). All of the six alkyne ligands adopt a µ3–η1σ1σ1σ ligation mode (Fig. 1c). Structurally similar Cu8-3 cluster crystallized in a monoclinic crystal system with the space group of C2/c and a cell volume of 18,082 Å3 (Fig. 2 and Table S1 in Supporting information). The cluster molecular structure of Cu8-3 is nearly identical to Cu8-2 (Fig. 1a) showing the same Cu8 core protected by the same ligands adopting the same ligation mode.
Figure 2
Figure 2.
Unit cell molecular packing of (a) Cu8-1, (b) Cu8-2 and (c) Cu8-3 (along b crystallographic axis). (d) Comparison of the unit cell parameters for Cu8-1, Cu8-2 and Cu8-3.
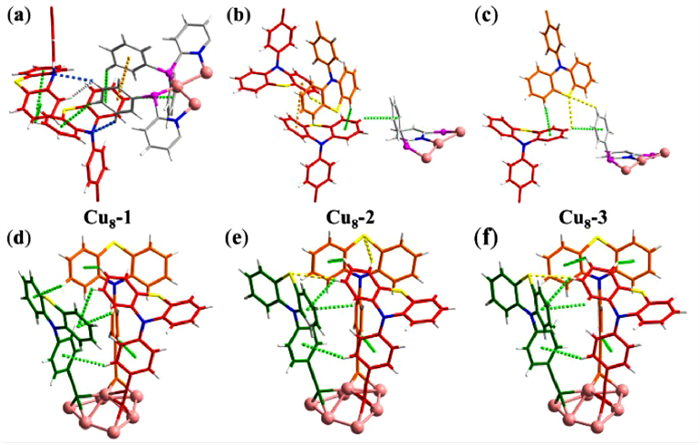
In the packing structure of Cu8-1, two clusters are packed inside the unit cell (Figs. 2a and d, Fig. S5 in Supporting information), and the extended cluster packing shows an AB/AB kind of layered packing mode (Figs. S8a and b in Supporting information). Careful analysis further reveals that a large number of C—H⋯F interactions exist between each Cu8 cluster and its seven surrounding PF6‒ (Fig. S9a in Supporting information), besides, the considerable C—H⋯N, C—H⋯S, C—H⋯π, S⋯S, π⋯π and H⋯H intermolecular or intramolecular interactions among the EPPTA and PNP ligands were also observed, promoting cluster crystallization (Figs. 3a and d, Fig. S10 in Supporting information). Interestingly, in each Cu8 structure, two phenothiazine groups in the EPPTA ligands are seriously bent resulting in the EPPTA forming a ‘7′-like shape (Fig. 3). In the case of Cu8-2, two Cu8 cluster molecules are packed inside the cubic unit cell (Figs. 2b and d, Fig. S6 in Supporting information) with an AB/AB packing mode (Figs. S8c and d in Supporting information). Eight C—H⋯F interactions were observed between each Cu8 cluster and the adjacent eight PF6‒ (Fig. S9b in Supporting information), which combine the C—H⋯S, C—H⋯π and π⋯π intermolecular or intramolecular interactions to result in the intermolecular packing (Fig. 3b, 3e and S11). For cluster Cu8-3, there are four Cu8 cluster molecules in the unit cell featuring an AB/AB packing mode (Figs. 2c and d, Figs. S7, S8e and f in Supporting information), in which the cluster molecules are tightly stacked through C—H⋯F, C—H⋯S, C—H⋯π, π⋯π and H⋯H interactions (Figs. 3c and f, Figs. S9c and S12 in Supporting information). Similarly, two EPPTA ligands are also bent to a ‘7’-like shape in each cluster molecule of Cu8-2 and Cu8-3.
Figure 3
Figure 3.
Intermolecular and intramolecular forces in (a, d) Cu8-1, (b, e) Cu8-2 and (c, f) Cu8-3. Color code: C—H⋯N for bright blue dotted line, C—H⋯S for yellow dotted line, C—H⋯π for light green dotted line, π⋯π for light orange dotted line and H⋯H for white dotted line. (For interpretation of the references to color in this figure legend, the reader is referred to the web version of this article.)
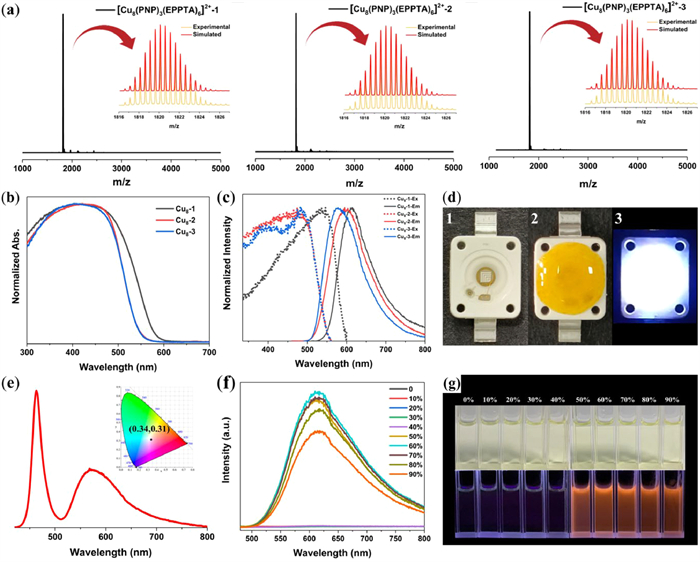
The composition of each cluster was further confirmed by electrospray ionization mass spectrometry (ESI-MS). As shown in Fig. 4a, the ESI-MS spectra in positive ion mode of Cu8-1, Cu8-2 and Cu8-3 show prominent peaks at m/z 1820.1196, 1820.1226 and 1820.1226 corresponding to the molecular ions [Cu8(PNP)3(EPPTA)6]2+−1, [Cu8(PNP)3(EPPTA)6]2+−2, and [Cu8(PNP)3(EPPTA)6]2+−3 (calcd. m/z 1820.1209), respectively. Detailed analysis shows that the experimental isotopic distribution patterns matched well with the simulated ones. The phase purities of these Cu8 crystals were confirmed by the powder X-ray diffraction (PXRD) patterns (Fig. S13 in Supporting information). Thermogravimetric analysis (TGA) shows that the decomposition temperatures of Cu8-1, Cu8-2 and Cu8-3 are about 275, 258, and 260 ℃, respectively, indicating superior thermal stability of these Cu8 cluster materials (Fig. S14 in Supporting information).
Figure 4
Figure 4.
(a) Positive-ion mode ESI-MS of Cu8-1, Cu8-2, and Cu8-3 dissolved in N,N-dimethylformamide (DMF) and EtOH. Insets: Enlarged portion of the ESI-MS exhibiting the measured (black line) and simulated (red line) isotopic distribution patterns in the m/z range of 1000–5000 with a charge state of +2. (b) Normalized UV–vis absorption spectra and (c) excitation with emission spectra of Cu8-1 (black trace), Cu8-2 (red trace) and Cu8-3 (blue trace) clusters in the solid state. (d) Photographs of WLED assembly: 1, LED panel is turned off (OSRAM LED Lighting Company); 2, LED panel coated with Cu8-3 powders is turned off; 3, LED panel coated with Cu8–3 is turned on. (e) The monitored emission spectrum and CIE coordinates of the white LED panel. (f) Emission spectra of Cu8-1 dissolving in DMF with a different fraction (0%–90%) of H2O. (g) Images of Cu8-1 in DMF (c = 10−5 mol/L) with 0%–90% of H2O under ambient light (top) and UV light (bottom). (For interpretation of the references to color in this figure legend, the reader is referred to the web version of this article.)
Among the various properties of metal clusters, the photoluminescence is greatly attractive. So, we have systematically investigated the optical properties of these Cu8 clusters. UV-vis absorption of the Cu8 cluster in DMF solution is below 500 nm (Fig. S19b in Supporting information), however, the absorption edge is red-shifted to 600 nm for Cu8-1 and 550 nm for Cu8-2 and Cu8-3 (Fig. 4b), respectively, indicating the significant collective behavior for these supercrystals beyond isolated cluster block.
As presented in Fig. 4c and Table 1, the solid-state Cu8-1, Cu8-2 and Cu8-3 showed bright photoluminescence with the maximum emissions at 614 nm, 598 nm and 578 nm, and the PLQYs of 13.3%, 12.4% and 26.6% at room temperature, respectively, which are different from the emission behavior of HEPPTA ligand exhibiting blue emission centered at 459 nm in the solid-state and 500 nm in dichloromethane (DCM) solution (Fig. S15 in Supporting information). In addition, time-correlated single-photon counting (TCSPC) technique studies show that these Cu8 clusters in the solid state display the microsecond lifetimes of 5.89, 3.30, and 2.97 µs for Cu8-1, Cu8-2 and Cu8-3 (Fig. S16 in Supporting information), respectively, manifesting that the transitions should be spin-forbidden triplet emission [37-41]. Furthermore, the excitation wavelength-independent emission behaviors of these Cu8 clusters indicate the emission originates from the lowest excited states (Fig. S17a in Supporting information). According to the above studies, cluster Cu8-3, displaying blue excitable yellow emission combined with its high thermal stability, maybe a yellow-emitting fluorophore. Then a white light-emitting diode (WLED) was fabricated by using a commercial blue LED panel with an emission peak approximately at 467 nm, on which Cu8-3 powders were coated as a yellow luminescence layer [29]. As shown in Figs. 4d and e, bright white light with the CIE coordinates of (0.34, 0.31) could be observed when the blue LED was turned on with a voltage of 3.0 V.
Table 1
Table 1.
Summary of photoluminescence parameters of clusters Cu8-1, Cu8-2, and Cu8–3 in the solid state.
Although clusters Cu8-1, Cu8-2 and Cu8-3 are PL-active in the solid state and more active after being frozen in liquid nitrogen (Fig. S17b in Supporting information), all are non-emissive in diluted solutions (Figs. S18a and b in Supporting information), indicating possible aggregation-induced emission (AIE) behavior, which is a common phenomenon for organic molecules and metal clusters [38,42-48]. All clusters are non-emissive in DMF, however, as decreasing the temperature by liquid nitrogen, bright yellow luminescence centered at 590 nm was observed (Fig. S18c in Supporting information), illustrating that non-radiative transition was activated in solution. After adding water to the above DMF solution, strong orange luminescence with a maximum emission wavelength of 614 nm was lighted (Figs. 4f and g, Fig. S18d in Supporting information). The UV-vis absorption and emission spectra measurements show that aggregates started forming at a water fraction (fw) of 50%, and the emission intensity reaches the highest value at 60% H2O content with a PLQY of 5.8% and a lifetime of 4.75 µs (Figs. S18d-f in Supporting information).
To further understand the complex photophysical properties of these Cu8 clusters, density functional theory (DFT) and time-dependent DFT (TD-DFT) calculations were further performed. The calculated UV-vis absorption spectrum of Cu8-1 matched well with the experimental spectrum in the DMF solution (Fig. S19 in Supporting information). The band centered at 415 nm is attributed to the HOMO-6 → LUMO (50%) and HOMO-4 → LUMO (29%) transitions and other deeper energy levels (highest occupied molecular orbital, HOMO; lowest unoccupied molecular orbital, LUMO). The band centered at 384 nm is attributed to the HOMO-8 → LUMO+1 (17%) and HOMO-4 → LUMO+8 (40%) transitions and other deeper energy levels. As shown in Fig. S20 and Table S2 (Supporting information), the HOMO is distributed at the EPPTA (99.9%), and the LUMO resides on the PNP with a high population (90%) and Cu8 core with a small contribution. Thus, the emissions of these Cu8 clusters may mainly originate from ligand-to-ligand charge transfer transitions (LLCT) and ligand-to-metal charge transfer transitions (LMCT) [49-51].
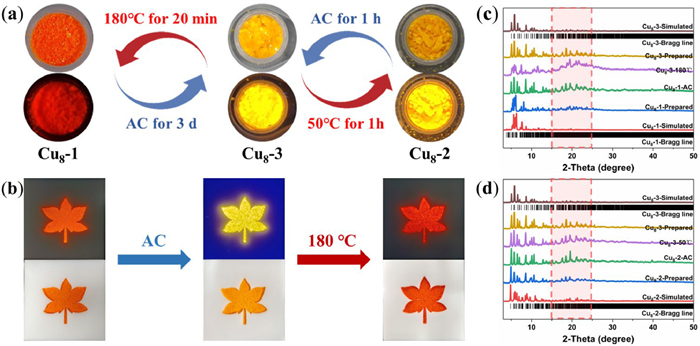
Cluster building block rearrangement in the unit cell is an effective strategy to tailor physicochemical properties, but rarely reported. Clusters Cu8-1, Cu8-2 and Cu8-3 feature identical molecule structures but entirely different packing ways in single-crystal accompanied with disparate color and PL. More significantly, the structure with color and PL can completely reversibly transform after suffering from solvent vapor and heating. When we stimulated the red Cu8-1 by acetone (AC) vapor at room temperature for 3 days, yellow Cu8-3 was generated. Conversely, Cu8-3 can reversibly transform to Cu8-1 after being heated at 180 ℃ for 20 min. Interestingly, cluster molecules in Cu8-3 will further rearrange upon heating at 50 ℃ for 1 h, producing Cu8-2. Cu8-3 can be reversibly generated by treating Cu8-2 with AC vapor for 1 h (Fig. 5a). As shown in Fig. 5b, a ‘maple leaf’ pattern was prepared by depositing Cu8-1 powders on a polytetrafluoroethylene (PTFE) mold, and the visualized and reversible pattern transformation based on both color and luminescence could be achieved upon AC vapor and heating. However, we failed to realize the transformation between Cu8-1 and Cu8-2. Furthermore, the reversible transformations were evidenced by recyclable repeatable PXRD patterns, solid-state UV–vis absorption spectra, solid-state emission spectra, and ESI-MS spectra (Figs. 5c and d, S21 and S22 in Supporting information).
Figure 5
Figure 5.
(a) The transformation behavior among the Cu8-1, Cu8-2 and Cu8-3 clusters. (b) Photographs under natural light and UV light of a ‘maple leaf’ pattern made by Cu8-1 powders simulated by AC vapor and heating in a PTFE mold. (c) PXRD patterns monitoring the reversible phase transformation between Cu8-1 and Cu8-3. (d) PXRD patterns monitoring the reversible phase transformation between Cu8-3 and Cu8-2.
In the final analysis, we think that the abundant intermolecular and intramolecular interactions sensitive to the AC vapor and temperature dominate the cluster crystallization and reversible transformations of these Cu8 cluster supercrystals [52]. According to the SC-XRD analysis, there are rich intercluster C—H⋯π, π⋯π, C—H⋯S, and S⋯S interactions among the surface ligands, which play a crucial role in stabilizing lattice. In addition, abundant C—H⋯F interactions between the surface ligands and PF6− anions can also suppress the molecular motion. So we infer that the more facilitated intercluster interactions in Cu8-3 result in a higher PLQY. The emission shifts for these clusters can be explained via the electronic coupling induced by intercluster interactions [53]. As for vapor induced transformations from Cu8-1 or Cu8-2 to Cu8-3, we think the interactions (C—H⋯O and C—H⋯Cl) between solvent molecules and surface ligands or PF6− anions are crucial (Fig. S23 in Supporting information). After removing the guests by AC vapor, the C—H⋯O or C—H⋯Cl interactions were destroyed resulting in the relative displacement of the cluster molecules [27]. Interestingly, the temperature-dependent transformations from Cu8-3 to Cu8-1 or Cu8-2 are related to the escape speed of solvent molecules from the lattice at different temperatures, namely, high-speed behavior at 180 ℃ causes the transformation from Cu8-3 to Cu8-1 and low-speed triggers the transformation from Cu8-3 to Cu8-2.
In summary, we report three atomically precise Cu8 cluster supercrystals, Cu8-1, Cu8-2 and Cu8-3, by introducing PNP and HEPPTA ligands. All Cu8 supercrystals feature the same [Cu8(PNP)3(EPPTA)6](PF6)2 composition but different intrinsic optical absorption and PL. Solid-state Cu8-1, Cu8-2 and Cu8-3 showed bright photoluminescence centered at 614, 598 and 578 nm with the PLQYs of 13.3%, 12.4% and 26.6% and microsecond lifetimes at room temperature, respectively. As a representative, cluster Cu8-3 displaying blue-excitable bright yellow luminescence and high thermal stability serves as a yellow phosphor for WLED. An obvious AIE property was shown for these clusters. Impressively, reversible structural transformations of these supercrystals can be triggered by AC vapor and temperature promoting the color and PL switching. This work not only provides a rare kind of stimuli-multi-responsive Cu8 cluster supercrystals but also expands the research field for Cu clusters.
Declaration of competing interest
The authors declare that they have no known competing financial interests or personal relationships that could have appeared to influence the work reported in this paper.
Acknowledgements
This work was supported by the National Natural Science Foundation of China (Nos. 92061201, U21A20277, 21825106, 21975065, 22205212), Project funded by China Postdoctoral Science Foundation (Nos. 2021TQ0291, 2022M722863), and Postdoctoral Science Foundation of Zhengzhou University.
Supplementary materials
Supplementary material associated with this article can be found, in the online version, at doi:10.1016/j.cclet.2024.109493.
[1]
S. Zeng, H. Sun, C. Park, et al., Mater. Horiz. 7 (2020) 164–172. doi: 10.1039/c9mh00851a
[2]
M. Wang, Q. Li, E. Li, et al., Angew. Chem. Int. Ed. 60 (2021) 8115–8120. doi: 10.1002/anie.202013701
[3]
M. Iyoda, M. Takashika, M. Hasegawa, et al., J. Am. Chem. Soc. 142 (2020) 13662–13666. doi: 10.1021/jacs.0c05340
[4]
Q. Zhang, J. Su, D. Feng, et al., J. Am. Chem. Soc. 137 (2015) 10064–10067. doi: 10.1021/jacs.5b04695
[5]
Z. Hu, B.J. Deibert, J. Li, Chem. Soc. Rev. 43 (2014) 5815–5840. doi: 10.1039/C4CS00010B
[6]
Q. Li, H. Zhu, F. Huang, J. Am. Chem. Soc. 141 (2019) 13290–13294. doi: 10.1021/jacs.9b05054
[7]
Y. Li, L. Chen, Y. Ai, et al., J. Am. Chem. Soc. 139 (2017) 13858–13866. doi: 10.1021/jacs.7b07638
M. Olaru, E. Rychagova, S. Ketkov, et al., J. Am. Chem. Soc. 142 (2020) 373–381. doi: 10.1021/jacs.9b10829
[52]
L.Y. Yao, Z. Chen, K. Zhang, V.W.W. Yam, Angew. Chem. Int. Ed. 59 (2020) 21163–21169. doi: 10.1002/anie.202009728
[53]
R.U. Melero, B. Huitorel, M. Cordier, et al., Inorg. Chem. 59 (2020) 13607–13620. doi: 10.1021/acs.inorgchem.0c01967
Figure 1
The crystal structures of Cu8-1, Cu8-2 and Cu8-3. (a) Overall structure. (b) Metal core of Cu8. (c) σ and (d) π ligation modes of the EPPTA ligand with Cu atoms. (e) The monodentate mode of PNP ligand. Color code: light rose = copper; gray = carbon; pink = phosphorus; yellow = sulfur; blue = nitrogen. H atoms are omitted for clarity. (For interpretation of the references to color in this figure legend, the reader is referred to the web version of this article.)
Figure 2
Unit cell molecular packing of (a) Cu8-1, (b) Cu8-2 and (c) Cu8-3 (along b crystallographic axis). (d) Comparison of the unit cell parameters for Cu8-1, Cu8-2 and Cu8-3.
Figure 3
Intermolecular and intramolecular forces in (a, d) Cu8-1, (b, e) Cu8-2 and (c, f) Cu8-3. Color code: C—H⋯N for bright blue dotted line, C—H⋯S for yellow dotted line, C—H⋯π for light green dotted line, π⋯π for light orange dotted line and H⋯H for white dotted line. (For interpretation of the references to color in this figure legend, the reader is referred to the web version of this article.)
Figure 4
(a) Positive-ion mode ESI-MS of Cu8-1, Cu8-2, and Cu8-3 dissolved in N,N-dimethylformamide (DMF) and EtOH. Insets: Enlarged portion of the ESI-MS exhibiting the measured (black line) and simulated (red line) isotopic distribution patterns in the m/z range of 1000–5000 with a charge state of +2. (b) Normalized UV–vis absorption spectra and (c) excitation with emission spectra of Cu8-1 (black trace), Cu8-2 (red trace) and Cu8-3 (blue trace) clusters in the solid state. (d) Photographs of WLED assembly: 1, LED panel is turned off (OSRAM LED Lighting Company); 2, LED panel coated with Cu8-3 powders is turned off; 3, LED panel coated with Cu8–3 is turned on. (e) The monitored emission spectrum and CIE coordinates of the white LED panel. (f) Emission spectra of Cu8-1 dissolving in DMF with a different fraction (0%–90%) of H2O. (g) Images of Cu8-1 in DMF (c = 10−5 mol/L) with 0%–90% of H2O under ambient light (top) and UV light (bottom). (For interpretation of the references to color in this figure legend, the reader is referred to the web version of this article.)
Figure 5
(a) The transformation behavior among the Cu8-1, Cu8-2 and Cu8-3 clusters. (b) Photographs under natural light and UV light of a ‘maple leaf’ pattern made by Cu8-1 powders simulated by AC vapor and heating in a PTFE mold. (c) PXRD patterns monitoring the reversible phase transformation between Cu8-1 and Cu8-3. (d) PXRD patterns monitoring the reversible phase transformation between Cu8-3 and Cu8-2.

 DownLoad:


 下载:
下载:


