Citation:
Jing Chen, Peisi Xie, Pengfei Wu, Yu He, Zian Lin, Zongwei Cai. MALDI coupled with laser-postionization and trapped ion mobility spectrometry contribute to the enhanced detection of lipids in cancer cell spheroids[J]. Chinese Chemical Letters,
2024, 35(4): 108895.
doi:
10.1016/j.cclet.2023.108895
MALDI coupled with laser-postionization and trapped ion mobility spectrometry contribute to the enhanced detection of lipids in cancer cell spheroids
English
MALDI coupled with laser-postionization and trapped ion mobility spectrometry contribute to the enhanced detection of lipids in cancer cell spheroids
Ministry of Education Key Laboratory of Analytical Science for Food Safety and Biology, Fujian Provincial Key Laboratory of Analysis and Detection Technology for Food Safety, College of Chemistry, Fuzhou University, Fuzhou 350116, China
b.
Department of Chemistry, State Key Laboratory of Environmental and Biological Analysis, Hong Kong Baptist University, Hong Kong, China
c.
College of Forestry, Nanjing Forestry University, Nanjing 210018, China
* Corresponding author. E-mail address: zwcai@hkbu.edu.hk (Z. Cai). 1 These authors contributed equally to this work.
Received Date:
29 March 2023 Accepted Date:
04 August 2023 Revised Date:
23 July 2023 Available Online:
15 April 2024
Abstract:
Cancer cell spheroids (CCS) are a valuable three-dimensional cell model in cancer studies because they could replicate numerous characteristics of solid tumors. Increasing researches have used matrix-assisted laser desorption/ionization mass spectrometry imaging (MALDI-MSI) to investigate the spatial distribution of endogenous compounds (e.g., lipids) in CCS. However, only limited lipid species can be detected owing to a low ion yield by using MALDI. Besides, it is still challenging to fully characterize the structural diversity of lipids due to the existence of isomeric/isobaric species. Here, we carried out the initial application of MALDI coupled with laser-postionization (MALDI-2) and trapped ion mobility spectrometry (TIMS) imaging in HCT116 colon CCS to address these challenges. We demonstrated that MALDI-2 is capable of detecting more number and classes of lipids in HCT116 colon CCS with higher signal intensities than MALDI. TIMS could successfully separate numerous isobaric/isomeric species of lipids in CCS. Interestingly, we found that some isomeric/isobaric species have totally different spatial distributions in colon CCS. Further MS/MS imaging analysis was employed to determine the compositions of fatty acid chains for isomeric species by examining disparities in signal intensities and spatial distributions of product ions. This work stresses the robust ability of TIMS and MALDI-2 imaging in analyzing endogenous lipids in CCS, which could potentially become powerful tools for future cancer studies.
Cancer cell spheroids (CCS), a novel in-vitro cell model, have aroused a growing attention to replace the traditional mono-layer cell model [1,2]. This is because CCS have more similar characteristics to tumor tissues. For instance, CCS with radiuses greater than 250 µm form three layers containing layers of necrosis, quiescence, and proliferation [3]. Tumor tissues exhibit similar internal structures. For example, the parenchyma layer consists of proliferative tumor cells and the necrotic layer comprises dead tumor cells [4]. In addition, the spatial distributions of lipids and expression levels of genes in CCS are comparable to those in tumor tissues [5,6].
Matrix-assisted laser desorption/ionization mass spectrometry imaging (MALDI-MSI) is a soft-ionization technique with a wide application to study the spatial distribution of endogenous compounds (e.g., lipids) in different biological samples including CCS [7–10]. However, MALDI has a low ionization efficiency for many different analytes. It is estimated that its ionization efficiency is about 10−5 or lower [11,12]. To increase the ionization efficiency, some methods have been developed [13–16]. One common method is the introduction of specific functional groups to target analytes through chemical derivatization techniques. For example, corticosteroids contain the carbonyl group that could react with hydrazine group in Girard's reagents to form readily ionizable hydrazones. Zecchi et al. employed this strategy to investigate the spatial localization of corticosteroids in the lung sections of rabbit [17]. Nonetheless, chemical derivatization presents several shortcomings including an extended reaction duration and potential analyte delocalization in sample sections [18]. A different approach to enhance the ionization efficiency of MALDI source is the use of MALDI coupled with laser-postionization, also known as MALDI-2. MALDI-2 utilizes a secondary ionization event that is spatially and temporally distinct from the first laser-desorption event, resulting in an enhancement of overall ion yield [19,20]. This approach does not require extra sampling procedures and can be directly applied to the same sample sections used in MALDI analysis. Previous works reported that MALDI-2 showed significant improvements in the detected intensities and number of different lipid species in different biological samples [21,22]. However, no studies have employed MALDI-2 to analyze lipids in CCS.
Lipids are important bioactive molecules within the biological system and participate in numerous biological processes such as signal transmission, energy storage and cellular differentiation [23–25]. However, analyzing these molecules poses a big challenge due to their structural complexity and the presence of numerous isomers or isobars [18,26]. Conventional methods for analyzing lipids contain electrochemistry [27], liquid chromatography [28] and capillary electrophoresis [29]. These methods have played important roles in providing insights into biological functions. However, they often have limitations in terms of throughput, specificity, sensitivity or inability of carrying out an imaging study. Trapped ion mobility spectrometry (TIMS) allows the separations of ions according to their charge status, shape and size [30–32]. Briefly, ions are firstly trapped by an electric field and subsequently propelled by the movement of an inert gas. When the strength of the electric field is progressively reduced, trapped ions will be released based on the mobility (K0), which is influenced by the charge, mass and size of ions [33–35]. TIMS is able to be coupled with MSI and allows for the separation of isomeric/isobaric molecules. However, to be the best of our knowledge, TIMS-MSI has not been applied to investigate isomeric/isobaric species of lipids in CCS.
Here, we described the first application of TIMS and MALDI-2 to separate and detect lipids in HCT116 colon CCS. The whole experiments were conducted on a timsTOF flex MALDI-2 mass spectrometer (Bruker Daltonics, Germany). This instrument allows for the collection of data with a high mass accuracy (< 5 ppm) and a high data-acquisition rate (10 kHz for MALDI and 1 kHz for MALDI-2). Two common matrices, 1,5-diaminonaphthalene (1,5-DAN) for negative ionization mode and 2,5-dihydroxybenzoic acid (DHB) for positive ionization mode, were used. To identify the compositions of fatty acid chains for isomeric species of lipids, we conducted the MS/MS imaging experiments by examining disparities in signal intensities and spatial distributions of their product ions.
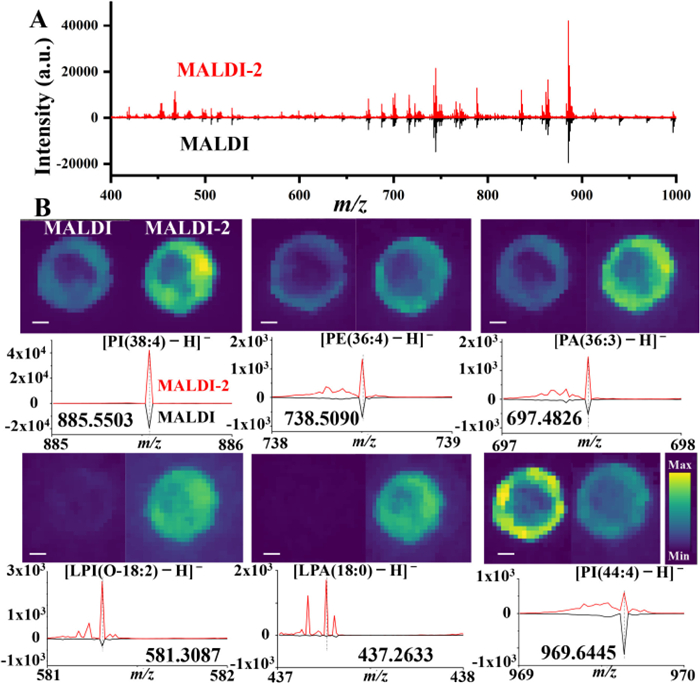
To compare the detected classes and number of lipids by utilizing MALDI-2 and MALDI, we used the following optimized instrumental parameters: 350 voltage peak-peak (Vpp) for funnel 1 radio frequency (RF), 1000 Vpp for multipole RF, 180 µs for transfer time, 500 Vpp for funnel 2 RF, 18 µs for pre pulse storage, 1200 Vpp for collision RF, 90% for laser power, 70 shots for MALDI-2 and 350 shots for MALDI. Data were acquired at a resolution of 50 µm in the M5 small mode. Cell spheroids on culture day 13 were harvested and sliced into 14-µm thick sections. A total of 60 mg of DHB (10 mg/mL in 90% MeOH) and 25 mg of DAN (5 mg/mL in 90% MeOH) were sprayed on each ITO slide by using an airbrush. As shown in Fig. 1A, in negative ionization mode, intensities of many ion peaks within the m/z range of 400-940 were observed to be lower in MALDI compared to MALDI-2. However, signal intensities of ion peaks above m/z 940 were higher in MALDI compared to MALDI-2. All these peaks were further assigned to lipid species with a mass accuracy better than 5.0 ppm. A total of 94 and 95 lipid species were found in colon CCS by using MALDI and MALDI-2, respectively (Fig. S1A and Table S1 in Supporting information). These lipids species fell into nine lipid classes including lysophosphatidic acid (LPA), lysophosphatidylethanolamine (LPE), lysophosphatidylserine (LPS), lysophosphatidylinositol (LPI), phosphatidic acid (PA), phosphatidylglycerol (PG), phosphatidylethanolamine (PE), phosphatidylserine (PS) and phosphatidylinositol (PI) (Table S1). The number of shared lipid species between MALDI and MALDI-2 was 94 (Fig. S1A). Among these lipids, 90 lipid species (e.g., PI(38:4), PE(36:4), PA(36:3), LPI(O-18:2)) in MALDI-2 had higher signal intensities than in MALDI, whereas signal intensities of three lipid species including PI(44:4), PI(46:4) and PI(46:5) were lower in MALDI-2 than those in MALDI (Fig. 1B, Fig. S2A and Table S1 in Supporting information). One lipid specie, LPA (18:0), was only detected in MALDI-2 (Fig. 1B and Fig. S2A).
Figure 1
Figure 1.
(A) Average spectra of HCT116 colon CCS sections analyzed with MALDI-2 (red, top) and MALDI (black, bottom) with the 1,5-DAN matrix. There were three replicates in each group. (B) Representative MALDI-2-MS (right) and MALDI-MS (left) ion images of various lipids in colon CCS sections. Below the ion images, the spectra of various lipid ions analyzed with MALDI-2 (red, top) and MALDI (black, bottom) were provided. Black dash lines indicated the corresponding ion peaks. Scale bars for all ion images were 200 µm.
In positive ionization mode, compared to the spectra of MALDI, the spectra of MALDI-2 showed denser peaks with higher intensities (Fig. 2A). The detected number of lipid species in MALDI-2 and MALDI were 79 and 38, respectively (Fig. S1B and Table S2 in Supporting information). The number of shared lipid species among them was 38. These lipid species were classified into six lipid classes, including phosphatidylcholine (PC), sphingomyelin (SM), PG, diglyceride (DG), lysophosphatidylcholine (LPC) and triglyceride (TG). In MALDI-2, signal intensities of all lipid species in TG (e.g., TG(50:2)) and DG ((e.g., DG(O-34:1)) were higher compared to MALDI. Conversely, in MALDI, signal intensities of all lipid species in PC (e.g., PC(34:1)) were higher compared to MALDI-2 (Fig. 2B, Fig. S2B and Table S2 in Supporting information). Intensities of three lipid species (e.g., LPC (O-14:0)) in LPC, one lipid specie (SM(33:1)) in SM and one lipid specie (PG(34:5)) in PG were higher in MALDI-2 compared to MALDI, whereas intensities of four lipid species (e.g., LPC (18:1)) in LPC, three lipid species (e.g., SM(34:1)) in SM and seven lipid species (e.g., PG(38:4)) in PG were lower in MALDI-2 compared to MALDI (Fig. S3 and Table S2 in Supporting information). These findings were in line with one previous study showing that in positive ionization mode, MALDI-2 was unable to enhance the signal intensities of some lipid species in PC, LPC and SM by using the DHB matrix [22]. One possible reason for this observation could be that in MALDI-2, the additional ion fragmentation that occurs throughout the ionization process, which may lead to decreased sensitivity for certain types of lipids with specific chemical structures [20]. Additionally, in MALDI-2, the choice of matrix may also impact the detection of analytes. For example, monoglyceride(18:1) and cholesterol ester(18:1) were not detected using the DHB matrix in both two methods [22]. However, when the norharmane matrix was used, MALDI-2 but not MALDI could detect these two compounds [22]. A total of 41 lipid species belonging to various lipids classes, such as LPA (e.g., LPA(22:6)), PE (e.g., PE(O-34:2)), LPI (e.g., LPI(22:1)), PA (e.g., PA(36:7)), PI (e.g., PI(38:3)) and PS (e.g., PS(34:1)) were only detected in MALDI-2 (Fig. 2B, Figs. S2B, S3 and Table S2). Interestingly, in negative ionization mode, these lipid classes were also detected (Table S1), demonstrating the potential ability of MALDI-2 to compensate for ion suppression effects to facilitate the detection of these lipids. These finding were also in line with the results reported in several prior studies [21,22,36].
Figure 2
Figure 2.
(A) Average spectra of HCT116 colon CCS sections analyzed with MALDI (red, bottom) and MALDI-2 (black, top) with the DHB matrix. There were three replicates in each group. (B) Representative MALDI-2-MS (right) and MALDI-MS (left) ion images of various lipids in colon CCS sections. Below the ion images, the spectra of various lipid ions analyzed with MALDI (red, bottom) and MALDI-2 (black, top) were provided. Black arrows indicated the corresponding ion peaks. Scale bars for all ion images were 200 µm.
Collectively, our data showed that MALDI-2 is capable of detecting more number and classes of lipids in HCT116 colon CCS than MALDI. Increasing studies has been utilized lipid profiling as a diagnostic tool for different types of cancers [37,38]. By detecting more lipid species in CCS, researchers can gain a better understanding of the metabolic pathways that are active in cancer cells. This can help identify new targets for cancer therapy and improve our understanding of how tumors develop and grow. Beside, CCS has been widely used as an in-vitro model to study drug resistance in cancer cells [39,40]. A wide detection range of lipids allows us to better characterize the lipid profiles of drug-resistant tumor cells and may help identify new strategies to overcome drug resistance and improve cancer treatment.
The separation of isomeric/isobaric species in CCS was performed by the MALDI & TIMS-MSI. Two primary parameters, namely 1/K0 (1.2-1.6) and the ramp time (800 ms), were used for TIMS separation. Figs. S4A and B (Supporting information) illustrates the overview of 2D-mobility plots of colon CCS sections in negative and positive ionization modes, respectively. The distinct cloud-shaped pattern of features, instead of a thin line, suggested a successful separation of many isobaric/isomeric species. For instance, in negative ionization mode, the ion at m/z 747.5178 was identified as [PG(34:1) − H]− (Fig. 3A). This lipid largely localized in the proliferative layer of colon CCS from the MALDI-MSI analysis (Fig. 3B). The extracted mobilogram of this lipid showed two ion peaks with 1/K0 values ranging from 1.35 to 1.41 (Fig. 3B). The ion 1 largely located in the proliferative layer of CCS (Fig. 3C), whereas the ion 2 largely localized in the necrotic layer of CCS (Fig. 3D). The ion 1 had higher signal intensity than the ion 2, which may lead to the outer distribution of PG(34:1) in CCS by the MALDI-MSI analysis (Fig. 3B). Earlier studies indicated that CCS comprises three distinct layers due to the presence of oxygen and nutrient gradients [1,3]. The presence of these three layers, namely the proliferative layer (orange), quiescent layer (baby blue) and necrotic area (dark bule), were confirmed by the segmentation analysis of HCT116 colon sections (Fig. S5 in Supporting information). The locations of different lipid species in different layers of CCS may represent different biological functions. For instance, our previous work demonstrated that all detected SMs in CCS were found to locate in the inner layer [6]. This could be attributed to its role as the signaling molecules that regulate cellular processes such as apoptosis and inflammation. A majority of PIs were found to locate in the outer layer of CCS [41], which may be due to their role in activating the phosphatidylinositol 3-kinase pathway to induce cell proliferation.
Figure 3
Figure 3.
(A) MALDI-MS spectrum of the ion at m/z 747.5178. The ion peak was indicated by the purple histogram. (B) The mobilogram and image of the ion (red) at m/z 747.5178 illustrating two ion peaks. (C) The mobilogram and image of the ion 1 (blue). (D) The mobilogram and image of the ion 2 (yellow). Scale bars for all images were 200 µm.
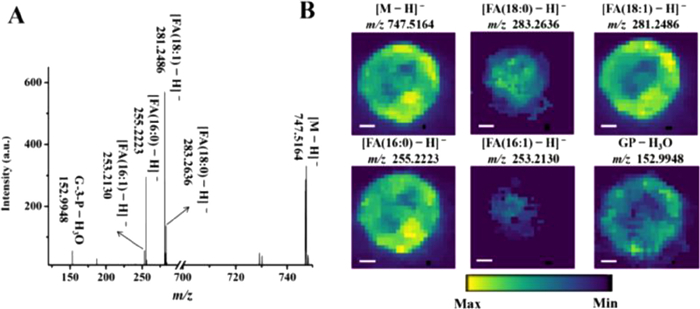
In order to identify the compositions of fatty acid chains for two isomeric species of PG(34:1), we conducted the MS/MS imaging experiments for CCS sections sprayed with the 1,5-DAN matrix. In the MS/MS spectra of the precursor ion at m/z 747.5164, the fragment ion at m/z 152.9948 was assigned to the ion of glycerol-3-phosphate (G-3-P) with the loss of H2O (Fig. 4A). This product ion largely located in the outer layer of CCS (Fig. 4B). Fragment ions at m/z 281.2486 and 255.2223 were assigned to ions of fatty acid(18:1) ((FA(18:1)) and FA(16:0), respectively (Fig. 4A). These ions were both largely located in the outer layer of colon CCS (Fig. 4B). Fragment ions at m/z 283.2636 and 253.2130 were assigned to ions of FA(18:0) and FA (16:1), respectively (Fig. 4A). These two ions were observed to predominantly distribute in the inner layer of CCS (Fig. 4B). Consistence with the TIMS data, the signal intensities of ions located in the inner layer were lower than that of ions distributed in the outer layer. Thus, the lipid ion 1 was assigned to [PG(16:0/18:1) − H]−, while the lipid ion 2 value was assigned to [PG(16:1/18:0) − H]− (Figs. 3C and D). These data suggest that for isomeric species of lipids with different localizations in CCS, performing MS/MS imaging may contribute to identify their compositions of fatty acid chains.
Figure 4
Figure 4.
(A) MALDI-MS/MS spectrum of the [M − H]− ion at m/z 747.5164. (B) The images of the [M − H]− ion and its fragment ions. Scale bars for all ion images were 200 µm.
In this study, we also observed that various lipid ions in colon CCS had isomeric ion species with the same distributions. For instance, the ion at m/z 885.5498 was identified as [PI(38:4) − H]− locating in the outer layer (Figs. S6A and B in Supporting information). Two isomeric ion species were found from the extracted mobilogram of this lipid (Fig. S6B). These two ions were all found to locate in the outer layer of colon CCS (Figs. S6C and D in Supporting information). However, the ion 1 had lower signal intensity than the ion 2. Based on this, we conducted MS/MS analysis of the precursor ion. The fragment ion at m/z 241.0113 was assigned to the ion of inositol-phosphate with the loss of H2O (Fig. S6E in Supporting information). Other four fragments at m/z 303.2336, 305.2466, 283.2641 and 281.2479 were assigned to ions of FA(20:4), FA(20:3), FA(18:0) and FA(18:1), respectively. FA(20:3) and FA(18:1) had lower signal intensity than FA(20:4) and FA(18:0). Thus, the ion 1 was assigned to [PI(18:1/20:3) − H]− and the ion 2 was assigned to [PI (18:0/20:4) − H]−. These data suggest that isomeric species of lipids with different signal intensities, performing MS/MS analysis may aid in identifying their compositions of fatty acid chains. Beside, we observed that the distributions of some lipids, such as PC(34:1), in CCS were interfered by the matrix in positive ionization mode (Fig. S7 in Supporting information). The ion 1 was the matrix ion (Fig. S7C) and the ion 2 belonged to the endogenous lipid ion (Fig. S7D). These two ions may belong to isobaric species.
In summary, this is the first study to apply TIMS and MALDI-2 for detecting endogenous lipids in HCT116 colon CCS. The results demonstrated that MALDI-2 are capable of detecting more number and classes of lipids than the traditional MALDI and TIMS combined with MS/MS imaging could assist in the separation and identification of isomeric species of lipids. Our work demonstrates the robustness of the lipid analysis in CCS by using TIMS and MALDI-2-MSI, which may become powerful tools for future cancer research.
Declaration of competing interest
The authors declare that they have no known competing financial interests or personal relationships that could have appeared to influence the work reported in this paper.
Acknowledgment
This work was supported by the National Natural Science Foundation of China (Nos. 22036001, 22276034 and 22106130).
Supplementary materials
Supplementary material associated with this article can be found, in the online version, at doi:10.1016/j.cclet.2023.108895.
Q. Zang, C. Sun, X. Chu, et al., Anal. Chim. Acta 1155 (2021) 338342. doi: 10.1016/j.aca.2021.338342
Figure 1
(A) Average spectra of HCT116 colon CCS sections analyzed with MALDI-2 (red, top) and MALDI (black, bottom) with the 1,5-DAN matrix. There were three replicates in each group. (B) Representative MALDI-2-MS (right) and MALDI-MS (left) ion images of various lipids in colon CCS sections. Below the ion images, the spectra of various lipid ions analyzed with MALDI-2 (red, top) and MALDI (black, bottom) were provided. Black dash lines indicated the corresponding ion peaks. Scale bars for all ion images were 200 µm.
Figure 2
(A) Average spectra of HCT116 colon CCS sections analyzed with MALDI (red, bottom) and MALDI-2 (black, top) with the DHB matrix. There were three replicates in each group. (B) Representative MALDI-2-MS (right) and MALDI-MS (left) ion images of various lipids in colon CCS sections. Below the ion images, the spectra of various lipid ions analyzed with MALDI (red, bottom) and MALDI-2 (black, top) were provided. Black arrows indicated the corresponding ion peaks. Scale bars for all ion images were 200 µm.
Figure 3
(A) MALDI-MS spectrum of the ion at m/z 747.5178. The ion peak was indicated by the purple histogram. (B) The mobilogram and image of the ion (red) at m/z 747.5178 illustrating two ion peaks. (C) The mobilogram and image of the ion 1 (blue). (D) The mobilogram and image of the ion 2 (yellow). Scale bars for all images were 200 µm.
Figure 4
(A) MALDI-MS/MS spectrum of the [M − H]− ion at m/z 747.5164. (B) The images of the [M − H]− ion and its fragment ions. Scale bars for all ion images were 200 µm.

 DownLoad:


 下载:
下载:


 下载:
下载:
