Figure 1.
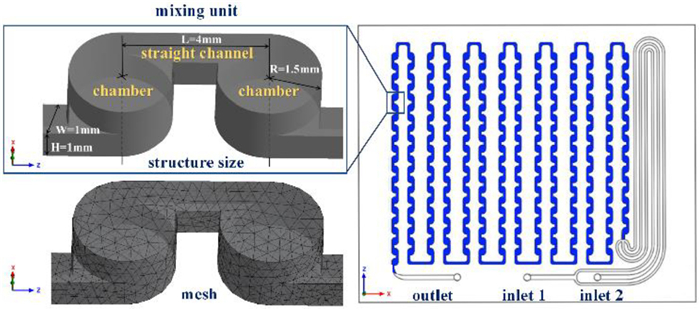
Geometry and mesh of the 3D circular cyclone-type microreactor.
Computational fluid dynamics simulation and experimental study on mixing performance of a three-dimensional circular cyclone-type microreactor
Shiyu Hou , Maolin Sun , Liming Cao , Chaoming Liang , Jiaxin Yang , Xinggui Zhou , Jinxing Ye , Ruihua Cheng

Mixing is a critical chemical unit operation, which is performed in a confined space of millimeters and microns in the microstructural unit of a microreactor. Owing to its extremely small characteristic size, the microreactor can reduce the molecular diffusion distance and provide a sufficient interphase interface, which is particularly useful for phase transfer and is now widely used in the fields of synthesis and separation [1-3].
Rational microchannel design can determine the overall performance of the equipment with expected ecological and economic benefits [4]. In contrast to the active microreactor, which requires an external drive source, such as a pressure field, electric field, magnetic field, and photochemical effect, with high energy consumption and a complex system to promote mixing, the passive microreactor depends solely on its structure to induce secondary flow and is hence more popular [5-10].
Passive microreactors can be classified into two-dimensional (2D) and three-dimensional (3D) systems based on their structural dimensions [11]. Moreover, 2D microreactors are simple to fabricate and exhibit various structures. The split–recombinant type changes the flow field by obstacles of various shapes [12,13]. Convergent–divergent type disturbs the flow regime by causing an expansion vortex throughout the structure [14,15]. Curve type generates an inner loop by forming Dean vortices [16,17]. However, the fluid in the 2D structure is usually limited by laminar flow, which requires to be disturbed. Conlisk et al. designed several convergent–divergent 2D and 3D micromixers based on mixing element pairs with a channel length range of 1.10–5.23 mm [18]. Compared to the standard T-mixer, the mixing performance of the 2D and 3D mixers improved by 20% and 82.5% in the Reynolds number range of 0.1–20, respectively. The 3D micromixer afforded the lateral flow, resulting in a chaotic effect. Unfortunately, the 3D structure microreactor has rarely been reported (Table S1 in Supporting information) [18-25].
Herein, based on the designed novel 3D circular cyclone-type borosilicate glass microreactor, which was manufactured by femtosecond laser micromachining technology, a computational fluid dynamics (CFD) simulation was conducted to analyze the fluid flow in its channels [26-30]. Various experiments were performed in liquid–liquid homogeneous and biphase systems, including diazo-coupling, extraction, alkylation, and sodium hypochlorite oxidation reactions. More complex reaction applications have been presented elsewhere [31,32].
The 3D circular cyclone-type microreactor has 14 columns and 279 chambers, which are connected by straight channels staggered up and down. Fig. 1 shows that the mixing unit comprises two adjacent chambers with a cross-sectional area size ranging of 1–6 mm2. The fluid domain is mainly divided into an inlet area and a mixing area (blue part), with volumes of 6.1 mL and 5.24 mL, respectively. At the inlet of the mixing area, bifurcated inlet 1 surrounds intermediate inlet 2 streams to form a three-pronged juxtaposed inlet, which can expand the fluid contact area. The inlet area is designed as a long pipeline to control the temperature and stabilize the fluid before it reaches the mixing area. The 3D structure is designed to intensify the secondary flow. The fabrication of microchannels is complicated and typically involves machining the structure on the substrate and then bonding it to the cover. However, it is mostly used for 2D structures. The 3D structure designed in this study is formed directly in borosilicate glass using femtosecond laser micromachining technology. This micromachining technique uses femtosecond laser nonlinear multiphoton absorption characteristics to induce material modification at the channel and then obtains the designed microchannel structure by wet chemical etching. Because this technique can directly shape microchannels and does not require bonding, which has great potential for future applications. Ren et al. fabricated a centimeter-scale 3D microchannel by femtosecond laser technology and successfully applied it to the synthesis of aryl diazonium salts [30]. Yin et al. used a 3D microfluidic device fabricated by femtosecond laser micromachining to achieve automatic solid–liquid synthesis of gadopentetate dimeglumine, and the synthesis result was significantly improved compared with that of a round-bottom flask [33]. Lv et al. used femtosecond laser technology to prepare a millimeter-scale butterfly reactor and discussed the residence time distribution (RTD) and heat/mass transfer performance in the reactor with CFD simulations [34].
The simulation assumed that the fluid was an incompressible isothermal Newtonian fluid. Owing to the size of the microchannel, the influence of the surface tension and inertial force is large. Thus, gravity is ignored. The Navier–Stokes equations are as follows:
|
|
(1) |
|
|
(2) |
where 
The convection–diffusion equation is used to obtain the concentration distribution of fluid components as follows:
|
|
(3) |
where C denotes the component concentration and D denotes the diffusion coefficient.
The mesh quality check was controlled at skewness < 0.85, with a total grid of 887920. The mixture model is typically used to simulate multiphase flows with relative slip velocities between the phases. However, the model can be simplified to a homogeneous flow when slip velocity is not considered. Herein, the two-phase flow in this study was found to be completely mixed without a clear phase interface with a flow rate ratio of 1:1 (Table 1 and Video S1 in Supporting information). Therefore, the final mixing efficiency of the mixer was considered, and the Mixture model was selected to simulate the mixer flow field. Generally, fluids in microdevices exhibit laminar flow. In this case, the designed 3D structure could effectively disturb the flow field, and the turbulent kinetic energy was analyzed. Therefore, both laminar and turbulent flow models were used.
In the tracer injection simulation, methylene blue was introduced as a tracer (Table 2). A steady-state simulation of the water flow was first conducted, and then the transient mode was switched after convergence. The tracer mass fraction in the boundary condition of inlet 1 was set to 100% and then adjusted to 0 after one step. Simultaneously, a monitoring surface was set at the outlet to record the change in the molar concentration of the tracer during the flow time. The simulations ensured that the total amount of tracer injected was 10 µL by controlling the time step size. The simulation settings are shown in Table 3.
Herein, four tests were conducted to evaluate the mixing efficiency of the 3D circular cyclone-type microreactor: diazo-coupling experiment, extraction experiment (Scheme S1 in Supporting information), alkylation experiment, and sodium hypochlorite oxidation reaction experiment. Detailed experimental methods are presented in Supporting information. Except for the extraction experiment, the other three experiments were set up with a same volume and 1/16" OD coil microreactor as the comparison group.
The water/ethyl acetate flow via the mixing unit is split into two streams, as illustrated in Fig. 2. The mainstream advances along the wall (green part) and drives the fluid in the chamber to form a vortex (blue part). Then, the two streams combine in the straight channel and move on to the following chamber for further recirculation. In the Z direction, the two straight channels of the same cylinder are located on the left and right sides, causing the next vortex to rotate clockwise (Fig. 2c). Consequently, the fluid swirls twice in opposite directions in a single complete-mixing unit. The fluid is fully mixed through more mixing units. After entering the straight channel, the velocity of the fluid maximizes because its cross-sectional area is small, and the fluid flows along the walls with few collisions. The large volume of the chamber coupled with the vortex reduces the velocity. Therefore, a velocity distribution with a large mainstream and a small vortex is formed. In addition, the observed results of the visualized flow experiments were similar to the simulation results (Video S2 in Supporting information).
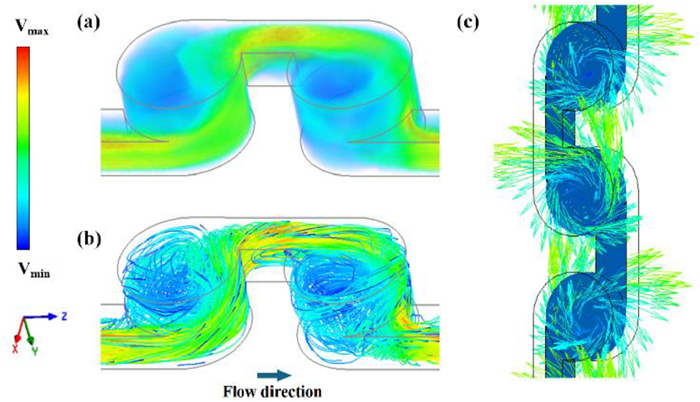
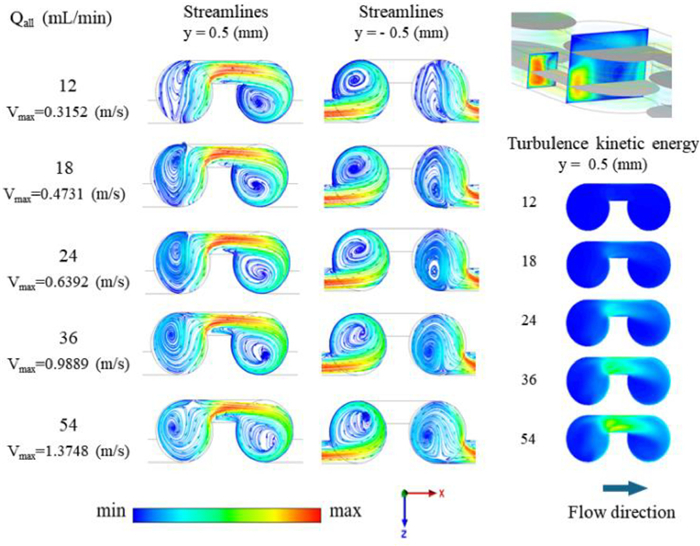
Fig. 3 shows the streamlines in the mixing unit at y = 0.5 mm in the ZX plane. At a flow rate of 12 mL/min, the fluid has a loose vortex in the left chamber, while two regular vortices form at 18 mL/min. As the flow rate increases to 24 and 36 mL/min, the vortex becomes more intense with dense velocity contours. Subsequently, the vortex distribution, including the position of the vortex eye and the velocity distribution, stabilizes. Similarly, a slight back-mixing vortex forms in the straight channel at 18 mL/min, and stabilizes at 36 mL/min, probably owing to the uneven velocity distribution. The designed 3D structure divides the fluid domain into the upper and lower layers. By intercepting the streamline diagram on the middle surface of the bottom half (that is, in the ZX plane, y = −0.5 mm), the flow in the left and right chambers can be observed. The streamlined distribution is the opposite of that in the upper half. Affected by the 3D structure, the vortex does not follow a single path and twists in the same chamber. This behavior can effectively disturb the inherent flow path of the fluid, resulting in an enhanced mixture. Turbulence kinetic energy is an important evaluation index of turbulent intensity that can directly reflect the transfer process of matter, momentum, and energy. As illustrated in Fig. 3, the turbulence kinetic energy increases along the straight channel in accordance with the flow velocity distribution, and the turbulence kinetic is dissipated by the eddy currents in the chamber. As the flow increases, the intensity of the turbulence at the back-mixing vortices increases, and stagnation points may appear. Additionally, the back-mixing vortex prolongs the fluid residence time in the mixer.
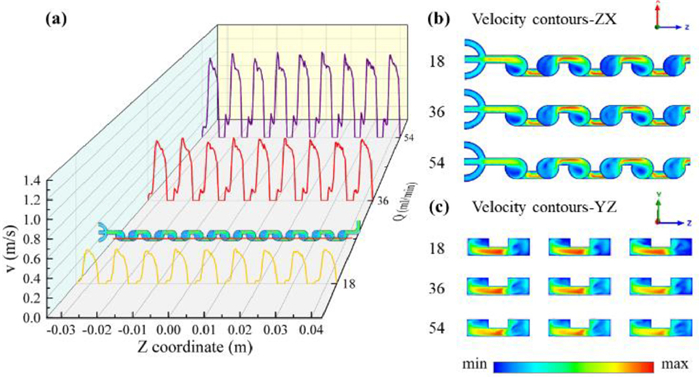
The simulation results suggest that the flow change slightly affects the flow path and velocity distribution, indicating that the microreactor structure can effectively maintain the order and stability of the flow field to guarantee fluid mixing and subsequent applications. As depicted in Fig. 4, the velocity within the microreactor exhibits a periodic distribution. Based on the velocity curve on the red-marked line in the first column of the microreactor, the flow velocities at various flow rates of the same position in each mixing unit are similar, indicating a smooth fluid in the mixing zone. In addition, higher flow rates result in more obvious differences in the peak, which may be related to the vortex in the chamber and the back-mixing vortex.
Pressure drop is a key indicator of structural design and flow stability. The extent of the pressure drop is related to the energy consumption and the effective driving energy. In this study, a pressure outlet of 0 Pa was used in all the simulations.
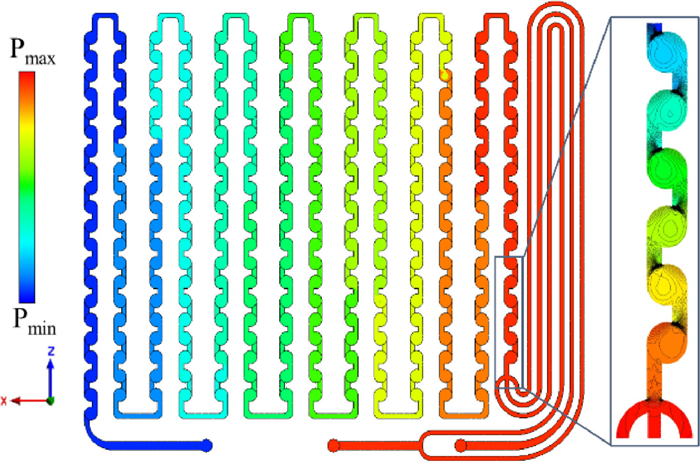
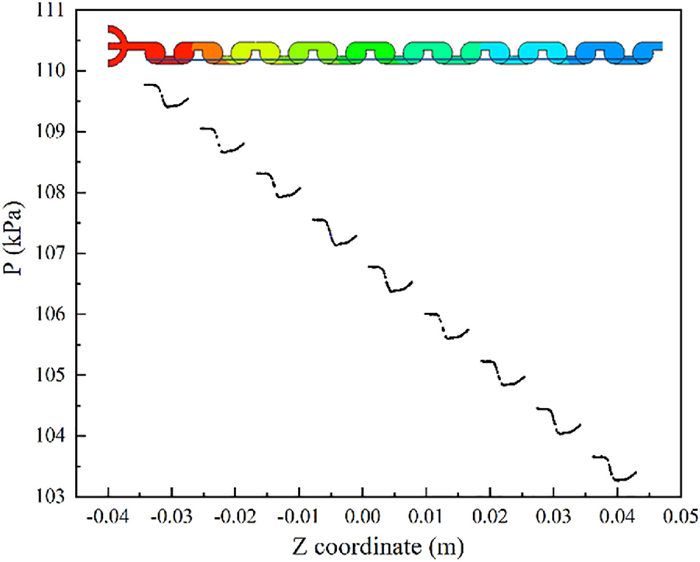
As demonstrated in Fig. 5, the highest pressure of the fluid flow in the microreactor appears at the inlet and gradually decreases along the flow channel. By zooming on to the local pressure field, the pressure contours become very tight as the fluid enters the bridge from the chamber, showing a significant change in location. As depicted in Fig. 6, extracting the pressure values on the blue marker line shows that the pressure in the mixing unit shows a sharp decrease and then an increase, which agrees well with the changes in the flow rate. As the fluid enters the connecting straight channel with a narrow flow path, a surge in velocity occurs, and the pressure suddenly decreases. After the fluid enters the chamber, the flow channel expands, resulting in a gradually decreasing velocity and conversion of kinetic energy into pressure energy. This slump and rebound trend can break the inherent flow field, increase the contact area between the phases, and promote mixing.
In classical theory, the pressure drop in the flow channel linearly depends on the flow velocity or Reynolds number in the laminar flow zone (Hagen–Poiseuille); however, in the turbulent flow region, it exhibits a quadratic relationship (Darcy–Weisbach) [35,36].
In our case, in the rate range of 12–96 mL/min, the Reynolds number at the entrance of the mixing zone is less than 2000, corresponding to laminar flow based on classical theory. After fitting, a quadratic relationship is discovered between the pressure drop and flow rate, which is ΔP ≈ Re2.27 in the experiment and ΔP ≈ Re2.12 in the simulation. This situation of sufficient flow within the theoretical laminar flow range is related to the wall roughness and the 3D structure. At the microscale, the friction coefficient of wall roughness is high [13,37]. Simultaneously, the 3D structure can yield pairs of opposite vortices that disturb the flow field with a fully turbulent fluid. Furthermore, in microchannels, the flow regime can transform from laminar to turbulent at lower Reynolds numbers than that in traditional flow channels [13].
The RTD is used to describe the macroscopic performance of micromixing, which reflects the mixing state and flow characteristics in the mixer, such as back mixing, short circuits, and stagnant zones. After obtaining the tracer concentrations C(t) at various residence times, the dimensionless RTD density function E(θ) is calculated based on the following equations:
|
|
(4) |
|
|
(5) |
|
|
(6) |
|
|
(7) |
As illustrated in Fig. S1 (Supporting information), the tracer disperses more widely as the number of mixing units increases. An analysis of the RTD at 36 mL/min was performed for microreactors with 2, 6, 10, and 14 columns (the red-boxed area is shown in Fig. S1). As demonstrated in Fig. 7a, the peak in column 2 deviates from θ = 1 and appears earlier, indicating a short circuit in the microreactor. With an increased number of columns, the RTD curve becomes a normal distribution, which implies that sufficient columns allow the well–mixed fluid to compensate for the short circuits. Additionally, an increased flow path improves the ratio of convection to axial diffusion (Peclet number), resulting in a narrower RTD curve with more columns involved [38,39]. Notably, more columns provide adequate mixing time. The vortex of the mixing unit and the slight back mixing in the straight channel effectively promote radial micromixing.
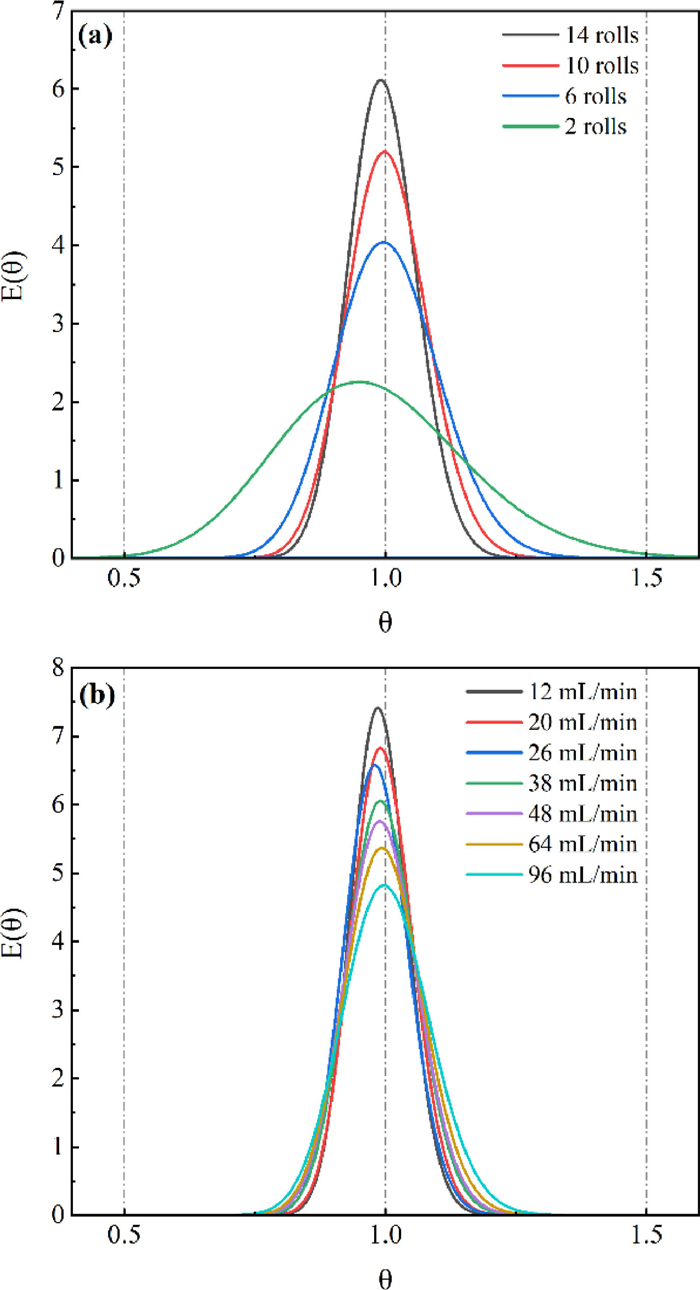
To investigate the effect of flow rate on the RTD, the microreactor was analyzed in the flow rate range of 12–96 mL/min (Fig. 7b). The residence time range of the fluid in the mixing zone is only 4.25–31.28 s. The RTD curve follows a normal distribution after normalization. A higher flow rate is likely to result in a faster vortex and stronger convection. Furthermore, the sharpest RTD curve is observed at 12 mL/min, which slightly broadens as the flow rate increases. A similar phenomenon also occurred in the Corning advanced flow reactor, which may be related to the presence of eddies in which some tracers bypass or remain, resulting in early or late exits [13].
Mixing intensity (IM) is often used to calculate macroscopic mixing effects in a fixed region of mixing space [40]. The calculation equations are as follows:
|
|
(8) |
|
|
(9) |
|
|
(10) |
N represents the number of sampling points in the statistical area; ci is the component concentration or mass fraction on each sampling point; 
The diazo-coupling reaction (Table 4) is a commonly used system for characterizing microscopic mixing properties [41]. This competitive reaction system with a segregation index, XS, can effectively determine the degree of mixing within the reactors: XS = 0 for homogeneous mixing and XS = 1 for no mixing.
|
|
(11) |
where CpR and CoR denote the concentrations of the single-coupling products, and CS denote the concentrations of the bis-azo products.
As shown in Table 4, XS was quite small for both the 3D circular cyclone-type microreactor and the coil microreactor. The XS values of the coil microreactor were 0.00135 and 0.00194 at residence times of 9 and 18 s, respectively, while those of the 3D circular cyclone-type microreactor were 0.00039 and 0.00065, respectively. Lower values indicate better mixing effects. The simulation results suggest that the two phases achieved uniform mixing, and the calculated mixing index was almost 1.
The n-butanol/succinic acid/water system was used for the extraction experiments. The inlet concentrations of succinic acid were set to 0.068, 0.136, and 0.203 mol/L. At a total flow rate of 20 mL/min, the E values of the three tests were 99.93%, 99.99%, and 98.31%, respectively, which were almost fully mixed. Subsequently, to investigate the influence of flow rates on E, experiments were conducted in terms of flow rates with a concentration of succinic acid in n-butanol of 0.136 mol/L. As shown in Fig. 8, the E was 92% at a flow rate of 12 mL/min. When the flow rate was increased to 20 mL/min, E was approximately 99%. As shown in the streamlines in Fig. 3, the vortices partly formed at 12 mL/min and fully formed and stabilized above a flow rate of 18 mL/min.

KLa increased as the flow rate increased, benefitting from the mass transfer at the interfacial contact. This could be linked to a decrease in the RTD peak. As the flow rate increases, the peak decreases, which means that the dispersion improves with convenient mass transfer. The KLa of the microreactor at 12–96 mL/min is 0.05–1.5 s-1, which is higher than that of the traditional extraction equipment and can be compared with various types of microreactors [42-44].
The phase transfer catalyzed alkylation reaction is a promising industrial phase transfer reaction. Because mixing efficiency is a nonhomogeneous two-phase system, it significantly affects the reaction rate [45,46]. As shown in Table 5, alkylation reactions were conducted in various reactors. After the residence time was extended from 18 s to 36 s at the same flow rate, the isolated yields of the reaction increased from 53% to 72% for the coil microreactor and from 78% to 99% for the 3D circular cyclone-type microreactor. The coil microreactor must be extended to 180 s to achieve a 98% yield, which was 97% in 600 s in the batch reactor.
The oxidation of alcohols with bleach by utilizing phase transfer catalysts (PTC) offers several advantages over conventional oxidants: low material cost, mild reaction conditions, and no metal waste. Mass transfer limitations usually determine the overall reaction rate of such PTC reactions; therefore, a continuous flow reactor can be used to increase the reaction rate.
As shown in Table 6, for the sodium hypochlorite oxidation reaction of alcohol, with residence times in the range of 18–36 s, only 54%–73% isolated yields were achieved in the coil microreactor, while 75%–99% yields were achieved in the 3D circular cyclone-type microreactor. After adjusting the flow rate, the coil microreactor required a residence time of 120 s to achieve a 97% yield, while the batch reactor required a longer time of 1200s to achieve a 92% yield.
In conclusion, the designed microreactor with a 3D structure presents a fluid with paired opposite vortices in the mixing unit, resulting in turbulence. In addition, the velocity surges in the straight channel, and the uneven velocity distribution results in slight back mixing. The flow path is stable and periodic and is slightly affected by the flow rate. The 3D structure can cause periodic pressure changes, which are beneficial for disturbing the flow field and improving the mixing. The fitting results of the pressure decrease and flow rate are quadratic, indicating that the fluid in the microreactor is fully developed. Tracer injection simulations were performed to analyze the RTD in the microreactor. The fluid residence time range in the mixing zone is only 4.25–31.28 s. Sufficient mixing units can promote fluid dispersion. In the diazo-coupling reaction of 1-naphthol, the segregation index of the 3D circular cyclone-type microreactor was one order of magnitude smaller than that of the coil microreactor under the same conditions, with XS = 0.00039 at 9 s. In the extraction experiment of n-butanol/succinic acid/water, the extraction performance was excellent regardless of the flow rate or inlet succinic acid concentration. Moreover, KLa, which is comparable to multiple types of microreactors and higher than that of conventional liquid–liquid extraction machinery, is proportional to the flow rate at 12–96 mL/min and 0.05–1.5 s-1. Phase transfer alkylation and oxidation reactions indicated that the 3D circular cyclone-type microreactor achieved a 99% isolated yield in 36 s, demonstrating significantly better mixing efficiency than the coil and batch reactors.
The authors declare that they have no known competing financial interests or personal relationships that could have appeared to influence the work reported in this paper.
We acknowledge Prof. Ya Cheng and Dr. Miao Wu for their contributions to the manufacture of the microreactor using femtosecond laser micromachining, and Prof. Xuhong Qian and Prof. Weiping Zhu for their insightful guidance and discussion during the entire research.
Supplementary material associated with this article can be found, in the online version, at doi:
K.K. Singh, A.U. Renjith, K.T. Shenoy, Chem. Eng. Process. 98 (2015) 95–105. doi: 10.1016/j.cep.2015.10.013
M. Ueno, H. Hisamoto, T. Kitamori, S. Kobayashi, Chem. Commun. (2003) 936–937.
H. Hisamoto, T. Saito, M. Tokeshi, A. Hibara, T. Kitamori, Chem. Commun. (2001) 2662–2663.
J.R. Bourne, Org. Process Res. Dev. 7 (2003) 471–508. doi: 10.1021/op020074q
J.W. Wu, H.M. Xia, Y.Y. Zhang, et al., Microsyst. Technol. 25 (2019) 2741–2750. doi: 10.1007/s00542-018-4193-7
A. Usefian, M. Bayareh, Meccanica 54 (2019) 1149–1162. doi: 10.1007/s11012-019-01018-y
B. Zhou, W. Xu, A.A. Syed, et al., Lab Chip 15 (2015) 2125–2132. doi: 10.1039/C5LC00173K
S. Wang, R. Zhou, Y. Hou, M. Wang, X. Hou, Chin. Chem. Lett. 33 (2022) 3650–3656. doi: 10.1016/j.cclet.2021.11.095
S. Arockiam, Y.H. Cheng, P.M. Armenante, S. Basuray, Chem. Eng. Res. Des. 167 (2021) 303–317. doi: 10.1016/j.cherd.2021.01.022
Y. Su, A. Lautenschleger, G. Chen, E.Y. Kenig, Ind. Eng. Chem. Res. 53 (2014) 390–401. doi: 10.1021/ie401924x
M. Bayareh, M.N. Ashani, A. Usefian, Chem. Eng. Process. 147 (2020) 107771. doi: 10.1016/j.cep.2019.107771
S. Zhang, X. Chen, Z. Wu, Y. Zheng, Int. J. Heat Mass Transf. 133 (2019) 1065–1073. doi: 10.1016/j.ijheatmasstransfer.2019.01.009
M.J. Nieves-Remacha, A.A. Kulkarni, K.F. Jensen, Ind. Eng. Chem. Res. 54 (2015) 7543–7553. doi: 10.1021/acs.iecr.5b00232
A. Afzal, K.Y. Kim, Sens. Actuators B: Chem. 211 (2015) 198–205. doi: 10.1016/j.snb.2015.01.062
B. Mondal, S.K. Mehta, P.K. Patowari, S. Pati, Chem. Eng. Process. 136 (2019) 44–61. doi: 10.1016/j.cep.2018.12.011
A. Al-Halhouli, A. Alshare, M. Mohsen, et al., Micromachines 6 (2015) 953– 968. doi: 10.3390/mi6070953
F. Jiang, K.S. Drese, S. Hardt, M. Kupper, F. Schonfeld, AIChE J. 50 (2004) 2297–2305. doi: 10.1002/aic.10188
K. Conlisk, G.M. O'Connor, Microfluid. Nanofluids 12 (2012) 941–951. doi: 10.1007/s10404-011-0928-9
A.S. Yang, F.C. Chuang, C.K. Chen, et al., Chem. Eng. J. 263 (2015) 444–451. doi: 10.1016/j.cej.2014.11.034
R.H. Liu, M.A. Stremler, K.V. Sharp, et al., J. Microelectromech. Syst. 9 (2000) 190–197. doi: 10.1109/84.846699
V. Viktorov, M.R. Mahmud, C. Visconte, Eng. Appl. Comput. Fluid Mech. 10 (2016) 182–192.
M. Nimafar, V. Viktorov, M. Martinelli, Chem. Eng. Sci. 76 (2012) 37–44. doi: 10.1016/j.ces.2012.03.036
R.A. Vijayendran, K.M. Motsegood, D.J. Beebe, D.E. Leckband, Langmuir 19 (2003) 1824–1828. doi: 10.1021/la0262250
J. Yang, L. Qi, Y. Chen, H. Ma, Chin. J. Chem. 31 (2013) 209–214. doi: 10.1002/cjoc.201200922
K. Liu, Q. Yang, F. Chen, et al., Microfluid. Nanofluids. 19 (2015) 169–180. doi: 10.1007/s10404-015-1558-4
Y. Bellouard, A. Said, M. Dugan, P. Bado, Opt. Express 12 (2004) 2120–2129. doi: 10.1364/OPEX.12.002120
C. Hnatovsky, R.S. Taylor, E. Simova, et al., Appl. Phys. A 84 (2006) 47–61. doi: 10.1007/s00339-006-3590-4
R.R. Gattass, E. Mazur, Nat. Photonics 2 (2008) 219–225. doi: 10.1038/nphoton.2008.47
W. Li, W. Chu, D. Yin, et al., Appl. Phys. A 126 (2020) 816. doi: 10.1007/s00339-020-04000-8
J. Ren, M. Wu, K. Dong, et al., Chin. Chem. Lett. 35 (2024) 107694.
M. Sun, C. Liang, L. Cao, et al., Chin. Chem. Lett. 35 (2024) 108738. doi: 10.1016/j.cclet.2023.108738
L. Cao, M. Sun, C. Liang, et al., Chin. Chem. Lett. 35 (2024) 108738. doi: 10.1016/j.cclet.2023.108738
D. Yin, Y. Li, L. Xia, et al., Chin. Chem. Lett. 33 (2022) 1077–1080. doi: 10.1016/j.cclet.2021.05.073
H. Lv, J. Wang, Z. Shu, et al., Chin. Chem. Lett. 34 (2023) 107710. doi: 10.1016/j.cclet.2022.07.053
W.M. Deen, Analysis of Transport Phenomena, Oxford University Press, New York, 1998.
G.O. Brown, Environ. Water Resour. Hist. (2002) 34–43.
G.L. Morini, Microscale Thermophys. Eng. 8 (2004) 15–30. doi: 10.1080/10893950490272902
F. Trachsel, A. Günther, S. Khan, K.F. Jensen, Chem. Eng. Sci. 60 (2005) 5729–5737. doi: 10.1016/j.ces.2005.04.039
A. Günther, S.A. Khan, M. Thalmann, F. Trachsel, K.F. Jensen, Lab Chip 4 (2004) 278–286. doi: 10.1039/B403982C
M. Engler, N. Kockmann, T. Kiefer, P. Woias, Chem. Eng. J. 101 (2004) 315–322. doi: 10.1016/j.cej.2003.10.017
H. Yang, G. Chu, Y. Xiang, J. Chen, Chem. Eng. J. 121 (2006) 147–152. doi: 10.1016/j.cej.2006.04.010
H. Lv, Z. Yang, J. Zhang, et al., Micromachines 12 (2021) 883. doi: 10.3390/mi12080883
T.Y. Chen, P. Desir, M. Bracconi, et al., Ind. Eng. Chem. Res. 60 (2021) 3723–3735. doi: 10.1021/acs.iecr.0c05759
C. Jiao, S. Ma, Q. Song, Energy Procedia 39 (2013) 348–357. doi: 10.1016/j.egypro.2013.07.222
J. Jovanovic, E.V. Rebrov, T.A. Nijhuis, V. Hessel, J.C. Schouten, Ind. Eng. Chem. Res. 49 (2010) 2681–2687. doi: 10.1021/ie9017918
X. Wang, T. Zhang, L. Lv, et al., Ind. Eng. Chem. Res. 61 (2022) 9122–9135. doi: 10.1021/acs.iecr.2c01664

Figure 2 Qall (total flow rate) = 36 mL/min: (a) volume renderings, (b) 3D streamlines, and (c) vectors (ZX plane, y = 0.5 mm) in the mixing unit.

Figure 3 Surface streamlines and turbulence kinetic energy contours for different flow rates of the second mixing unit at the inlet (ZX plane, y = +0.5 mm).

Figure 4 Velocity profiles and contours for various flow rates (a: ZX plane, y = −0.5 mm and x = −40.6 mm; b: ZX plane, y = ±0.5 mm; and c: YZ plane, x = −40.6 mm).

Figure 7 Dimensionless RTD E(θ) for (a) various numbers of columns when Qall = 36 mL/min and (b) various flow rates of 14 rolls.

 扫一扫看文章

扫一扫关注我们
 DownLoad:


 下载:
下载:


 下载:
下载: