Citation:
Lu Li, Suticha Chunta, Xianzi Zheng, Haisheng He, Wei Wu, Yi Lu. β-Lactoglobulin stabilized lipid nanoparticles enhance oral absorption of insulin by slowing down lipolysis[J]. Chinese Chemical Letters,
2024, 35(4): 108662.
doi:
10.1016/j.cclet.2023.108662
β-Lactoglobulin stabilized lipid nanoparticles enhance oral absorption of insulin by slowing down lipolysis
English
β-Lactoglobulin stabilized lipid nanoparticles enhance oral absorption of insulin by slowing down lipolysis
Received Date:
24 May 2023 Accepted Date:
06 June 2023 Revised Date:
05 June 2023 Available Online:
15 April 2024
Abstract:
Lipid-based nanocarriers have staged a remarkable comeback in the oral delivery of proteins and peptides, but delivery efficiency is compromised by lipolysis. β-Lactoglobulin (β-lg) stabilized lipid nanoparticles, including nanoemulsions (NE@β-lg) and nanocapsules (NC@β-lg), were developed to enhance the oral absorption of insulin by slowing down lipolysis due to the protection from β-lg. Cremophor EL stabilized nanoemulsions (NE@Cre-EL) were prepared and set as a control. The lipid nanoparticles produced mild and sustained hypoglycemic effects, amounting to oral bioavailability of 3.0% ± 0.3%, 7.0% ± 1.1%, and 7.7% ± 0.8% for NE@Cre-EL, NE@β-lg, and NC@β-lg, respectively. Aggregation-caused quenching (ACQ) probes enabled the identification of intact nanoparticles, which were used to investigate the in vivo and intracellular fates of the lipid nanoparticles. In vitro digestion/lipolysis and ex vivo imaging confirmed delayed lipolysis from β-lg stabilized lipid nanoparticles. NC@β-lg was more resistant to intestinal lipolysis than NE@β-lg due to the Ca2+-induced crosslinking. Live imaging revealed the transepithelial transport of intact nanoparticles and their accumulation in the liver. Cellular studies confirmed the uptake of intact nanoparticles. Slowing down lipolysis via food proteins represents a good strategy to enhance the oral absorption of lipid nanoparticles and thus co-formulated biomacromolecules.
Oral delivery of peptides and proteins has been a hot field in drug delivery [1–4]. Enteric coatings in combination with pH-regulating agents, enzymatic inhibitors, and absorption enhancers are the common strategies but lead to severe side effects [5,6]. In addition, ORMD-0801 that adopts the combinatory strategy failed in a clinical trial recently [7]. Lipid-based nanoparticles have regained the spotlight in this field due to the protection of proteins and peptides from gastrointestinal degradation [8–11]. Intact lipid nanoparticles then transport across the intestinal epithelia, inducing absorption of the loaded therapeutics [9,10]. However, lipolysis impairs the delivery efficiency of the lipid nanoparticles due to premature leakage. Only intact nanoparticles that survive lipolysis can protect their cargo and enter the body's circulation. Thus, seeking green excipients to develop lipid nanoparticles that are resistant to harsh gastrointestinal environments has become a priority in the oral delivery of biomacromolecules.
Food proteins have been widely exploited as emulsifiers to develop nanoemulsion-based functional foods [12,13]. They can adsorb on the oil-water interface to form a viscoelastic membrane, preventing oil drops from coalescence or flocculation [14]. Unlike other food proteins that are digested in the stomach, β-lactoglobulin (β-lg) is resistant to pepsin and gastric acid [15,16]. This is due to the highly folded globular structure of β-lg that hampers pepsin to access the target peptide bonds [17]. Thus, β-lg stabilized nanoemulsions (NE@β-lg) may remain intact in the stomach. When NE@β-lg enters the intestine, the interfacial β-lg membrane continues to delay lipolysis by preventing lipases from contacting the oil core [18–20]. Furthermore, β-lg can be crosslinked by Ca2+. Solubilizing calcium chloride in the oil phase in advance converts the β-lg stabilized nanoemulsions into nanocapsules (NC@β-lg) [21]. The tough shell layer endows nanocapsules with even better stability in the gastrointestinal tract (GIT). Thus, β-lg stabilized lipid nanoparticles, including NE@β-lg and NC@β-lg, are preferable carriers for the oral delivery of biomacromolecules. In addition, the preparation of the lipid nanoparticles is free of volatile organic solvents, which is favored by green manufacturing [22].
In this study, insulin was adopted as a model drug and loaded in the form of a phospholipid complex. The optimization of the complexation process is shown in Fig. S1 (Supporting information). The optimized complex got a complexation efficiency of 98% and a solubility of 29.4 ± 0.8 mg/mL in Labrafac Lipophil WL 1349. The complex process did not affect the conformation and bioactivity of insulin (Fig. S2 in Supporting information). β-lg stabilized lipid nanoparticles were prepared by high-pressure homogenization with Labrafac Lipophile WL 1349 as the oil phase (Figs. S4A–E in Supporting information). Cremophor EL (Cre-EL) stabilized nanoemulsions (NE@Cre-EL) were prepared with a similar procedure and set as a control. The lipid nanoparticles shared similar particle size (150–165 nm), polymer dispersity index (PDI) (< 0.15), and insulin encapsulation efficiency (EE) (64%–70%) (Table S2 in Supporting information). Ca2+-induced crosslinking reduced the zeta potential from −33.2 ± 1.9 mV of NE@β-lg to −16.4 ± 1.9 mV of NC@β-lg. The crosslinking did not affect the EE, being 66.2% ± 3.5% (NE@β-lg) and 69.3% ± 3.3% (NC@β-lg). Transmission electron microscope imaging displayed spherical morphology of the lipid nanoparticles (Fig. S4F in Supporting information). The observed size was similar to the results determined by dynamic laser scattering.
Fig. 1A shows the blood glucose variation of rats treated with different preparations. All animal experiments were approved by the Institutional Animal Care and Use Committee at the School of Pharmacy, Fudan University. No hypoglycemic effect was observed for insulin-phospholipid complex (50 IU/kg) and blank NE@β-lg following oral administration. The phospholipid complex may fail to protect insulin from harsh enzymatic degradation. Subcutaneous injection of insulin solution (1 IU/kg) led to a sharp decrease in blood glucose to 46.1% ± 1.7% at 2 h, which returned to the pre-dose level at 6 h. The short duration requires frequent injection, which may give rise to hypoglycemic syndromes, such as shaking and even brain death [23]. Conversely, β-lg stabilized lipid nanoparticles (25 IU/kg) produced mild and sustained hypoglycemic effects. Blood glucose level reduced to 65%–78% during 6–12 h post-administration. Based on the area above the curve, the oral bioavailability of NE@β-lg and NC@β-lg amounted to 7.0% ± 1.1% and 7.7% ± 0.8%, respectively. Oral administration of NE@Cre-EL at a dose of 25 IU/kg also produced sustainable hypoglycemic effects, which were inferior to that from β-lg stabilized lipid nanoparticles. The blood glucose level was reduced to a minimum level of around 83% at 8 h and recovered at 24 h. The oral bioavailability of NE@Cre-EL was only 3.0% ± 0.3%.
Figure 1
Figure 1.
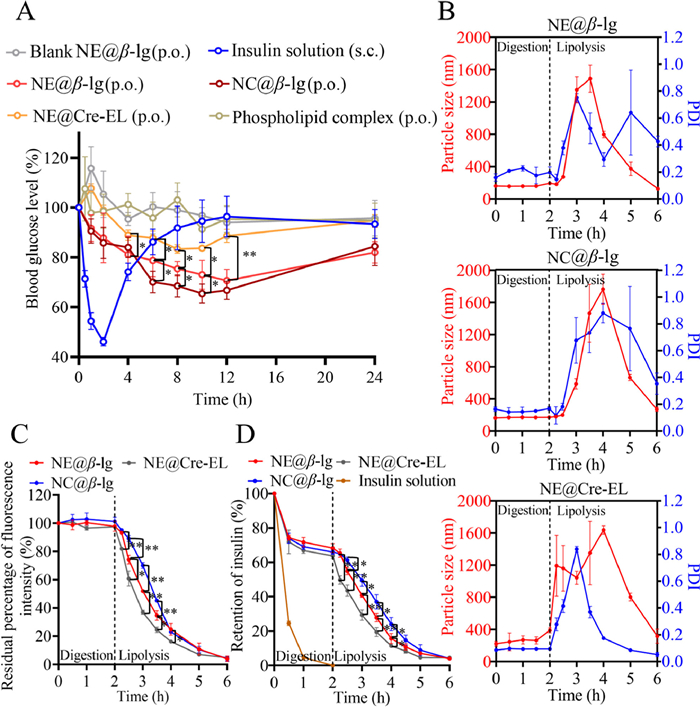
Hypoglycemic effects and in vitro digestion/lipolysis of lipid nanoparticles. (A) Blood glucose level versus time profiles in rats treated with different preparations. Data are presented as mean ± standard deviation (SD), n = 5. (B) Particle size and PDI variation of lipid nanoparticles in in vitro digestion/lipolysis. (C) In vitro digestion/lipolysis monitored by fluorescence reducing. (D) Retention of insulin during the digestion/lipolysis. Data are presented as mean ± SD, n = 3 (*P < 0.05, **P < 0.01).
The in vitro digestion/lipolysis model was developed following the classical protocol [24–26] to elucidate the possible mechanisms for the enhanced oral bioavailability. Variations in particle size and PDI of the lipid nanoparticles during gastric digestion and intestinal lipolysis were investigated (Fig. 1B). Since lipolysis mainly occurs in the intestine, NE@Cre-EL maintained structural stability during gastric digestion. However, the size and PDI of NE@Cre-EL were instantly increased in intestinal lipolysis. Due to the resistance of β-lg to pepsin attack, NE@β-lg and NC@β-lg also maintained structural stability during gastric digestion, being consistent with results from other groups [27,28]. NE@β-lg maintained initial particle size and PDI in the first 15 min of intestinal lipolysis, which then increased and reached a maximum at 3–3.5 h. With ongoing lipolysis, β-lg was replaced by bile salts. This disrupted the structure of NE@β-lg and the oil droplets aggregated, leading to an increase in particle size and PDI. Lipolysis converted the oil droplets into mixed micelles and vesicles, then particle size and PDI decreased. Conversely, NC@β-lg maintained structural stability for 30 min during intestinal lipolysis. The particle size and PDI of NC@β-lg gradually increased to a maximum at 4 h, with a 0.5–1 h lag compared to lipolysis of NE@β-lg. This occurred because Ca2+-induced crosslinking strengthened the interfacial shells to resist bile salt replacement and lipase penetration [29,30], thereby further delaying lipolysis.
Aggregation-caused quenching (ACQ) probes were adopted to identify the intact lipid nanoparticles [31–36]. The ACQ probes illuminated the lipid nanoparticles when loading in the oil phase as molecules. Once the lipid nanoparticles were broken due to digestion/lipolysis, the probes were released into the aqueous environments and quenched due to intermolecular aggregation via π-π stacking. Fluorescent labeling was achieved by dissolving the ACQ probes in the oil phase during the preparation of the lipid nanoparticles. With a concentration of P2 and P4 in the formulation of 5 µg/mL and 0.5 µg/mL, respectively, the lipid nanoparticles achieved comparable fluorescent intensities (Table S2). The fluorescent intensities of the lipid nanoparticles were stable during 24 h of incubation in all media (Fig. S5 in Supporting information), excluding fluorescent quenching due to water infiltration and probe leakage.
The rate of digestion and lipolysis of the lipid nanoparticles was monitored by the residual percentage of the fluorescence intensity (Fig. 1C). Previous studies indicated consistency between the alkali compensation method and the fluorescent quenching method [37]. All lipid nanoparticles remained intact during the 2 h of gastric digestion. During the intestinal lipolysis period, NE@Cre-EL presented significantly faster degradation than β-lg stabilized lipid nanoparticles. NE@β-lg and NC@β-lg presented similar lipolysis patterns. Initially, the particles remained intact and the β-lg molecules on the surface were able to delay the approach of lipase to the oil droplets, leading to a slow lipolysis rate. Subsequently, with the β-lg layer substituted by bile salts, the particles broke down. The lipolysis rate accelerated in the medium term but slowed down latterly as the lipase became saturated by triglycerides. Lag times of 15 and 30 min were observed in the lipolysis of NE@β-lg and NC@β-lg, respectively, matching the size and PDI variation in the lipolysis progress. Moreover, in the first 2 h of intestinal lipolysis, NC@β-lg maintained a significantly higher residual fluorescence intensity than NE@β-lg. These results supported the enhanced stability from Ca2+-induced crosslinking.
The residual percentage of insulin during digestion and lipolysis was also measured (Fig. 1D). Insulin solution was completely degraded during 2 h of gastric digestion. Conversely, the content of insulin from lipid nanoparticles only decreased to 65%–70% during the gastric digestion due to protection from the carriers. The degradation was from free insulin in the preparation as the residual insulin content at the end of gastric digestion was coincident with the EE. The decrease of insulin content in the intestinal lipolysis was synchronous with the degradation of the lipid nanoparticles. Similarly, NE@Cre-EL showed the worst protection toward insulin due to the fastest lipolysis among the lipid nanoparticles. NC@β-lg maintained significantly higher insulin content in the first 2 h of intestinal lipolysis than NE@β-lg. The results demonstrated that β-lg stabilized lipid nanoparticles were more resistant to lipolysis than NE@Cre-EL, providing better protection to the loaded insulin. The ability is further enhanced by Ca2+-induced crosslinking.
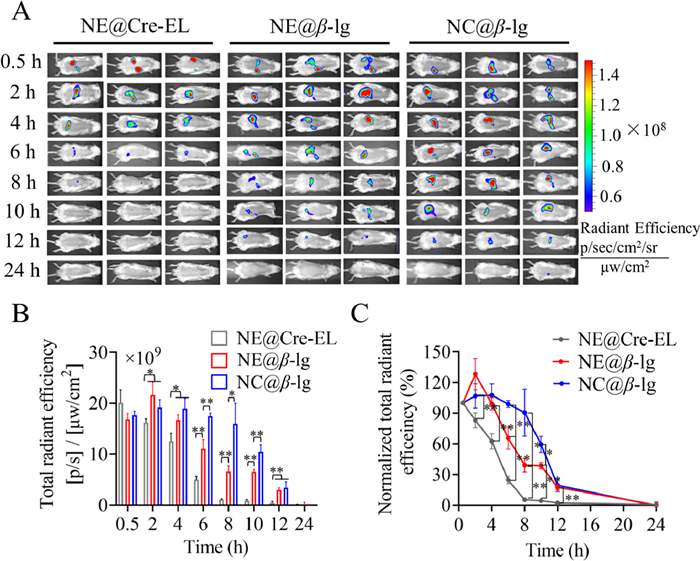
P2 labeling was adopted to study the transport of intact nanoparticles in rats. Negligible fluorescence was observed from rats treated with P2 quenched solution, eliminating concerns about interference from fluorescent recurrence (Fig. S6A in Supporting information). P2 signal vanished at 8 h on rats treated with NE@Cre-EL. Conversely, strong P2 signals were observed on rats treated with β-lg stabilized lipid nanoparticles till 12 h (Fig. 2A), indicating long residence in the GIT due to resistance to digestion and delayed lipolysis. Fig. 2B illustrates the variation of fluorescence intensity over time. NE@Cre-EL presented significantly weaker fluorescence intensities at each time point than β-lg stabilized lipid nanoparticles, indicating weaker gastrointestinal stability. Furthermore, the fluorescence intensity from treatment with β-lg stabilized lipid nanoparticles increased slightly from 0.5 h to 2 h. This was due to the proximity of nanoparticles in the limited space of the stomach, causing self-quenching. With dispersion of the nanoparticles, fluorescence slightly increased. The subsequent gastrointestinal transport and lipolysis led to the quenching of the fluorescence. However, intestinal lipolysis of NE@Cre-EL was quick, leading to a continuous decline of the fluorescent intensity. Rats treated with NC@β-lg presented significantly stronger fluorescence than those treated with NE@β-lg from 6 h to 10 h, supporting the enhanced stability from Ca2+-induced crosslinking. The in vivo lipolysis is displayed as the normalized total radiant efficiency versus time with an initial value of 100% (Fig. 2C). The trend of the profiles was similar to that obtained in the in vitro study.
Figure 2
Figure 2.
Live imaging of rats treated with lipid nanoparticles. (A) Live imaging photographs. (B) Variation of fluorescence intensity versus time. (C) Normalized total radiant efficiency versus time. Data are presented as mean ± SD, n = 3 (*P < 0.05, **P < 0.01).
Fig. 3 shows the GIT and main organs of rats treated with lipid nanoparticles. No fluorescence recurrence was observed from treatment with P2 quenched solution (Figs. S6B and C in Supporting information). The lipid nanoparticles showed similar gastrointestinal transport and retention. Gastrointestinal transport of the lipid nanoparticles was fast because fluorescent signals were spread throughout the small intestine at 0.5 h (Fig. 3A). Only faint fluorescence was seen in the intestines of rats treated with NE@Cre-EL at 8 h, which lasted till 10–12 h in the treatment of β-lg stabilized lipid nanoparticles. These results supported the delayed lipolysis from β-lg. Furthermore, NC@β-lg exhibited longer retention in the GIT than NE@β-lg due to the Ca2+-induced crosslinking. Fig. 3B demonstrates the variation of fluorescent intensities in the GIT with time. The variation was similar to that observed in the live imaging. NC@β-lg also presented higher fluorescence intensities in the GIT than the two nanoemulsions from 6 h to 12 h, implying enhanced stability. Therefore, nanocapsules may have more opportunities to be absorbed across the epithelial layer.
Figure 3
Figure 3.
Intestinal translocation and in vivo distribution of lipid nanoparticles. (A) Ex vivo imaging and (B) variation of fluorescence intensity in the gastrointestinal tract of rats treated with lipid nanoparticles. (C) Ex vivo imaging of primary organs (from top to bottom in each panel: brain, heart, lung, liver, spleen, and kidney). (D) Variation of fluorescence intensity in the livers of rats treated with lipid nanoparticles. (E) Absorption percentage of lipid nanoparticles estimated from fluorescence intensity in the liver and gastrointestinal tract. Data are presented as mean ± SD, n = 3 (*P < 0.05, **P < 0.01).
Fig. 3C shows ex vivo imaging of the primary organs of rats treated with lipid nanoparticles. Intense fluorescence was observed in the liver after 4 h, confirming the absorption and migration of intact nanoparticles that survived digestion and lipolysis in the GIT. Nonetheless, the fluorescent intensity from the treatment of NE@Cre-EL was weaker than that from β-lg stabilized lipid nanoparticles. Although faint fluorescence signals were sporadically detected in other organs, the liver was the main accumulation organ for the absorbed nanoparticles. Similar results were found in other types of lipid nanoparticles [38]. If nanoparticles release the loaded insulin in the liver, an improved hypoglycemic effect can be anticipated as the process follows the normal physiology of insulin [39,40]. To compare the differences in absorption among the lipid nanoparticles, the fluorescence intensities in the liver were plotted versus time (Fig. 3D). The oral absorption of the lipid nanoparticles was roughly estimated. Assuming the fluorescence intensity in the GIT at 0.5 h as the total amount of the nanoparticles administered, the absorption was calculated by the percentage of the fluorescence detected in the liver (Fig. 3E). Both the two β-lg stabilized lipid nanoparticles reached maximum fluorescence intensity and absorption percentage (~7%) at 4 h, 2 h later than the peak time in the GIT. NE@Cre-EL only got a maximum absorption percentage of ~3% at 4 h. The fast transport of the nanoparticles in the GIT may contribute to speedy absorption. Moreover, NC@β-lg presented significantly higher fluorescence intensity and absorption percentage than NE@β-lg from 6 h to 12 h. This phenomenon also explained the higher hypoglycemic effect obtained from the nanocapsules.
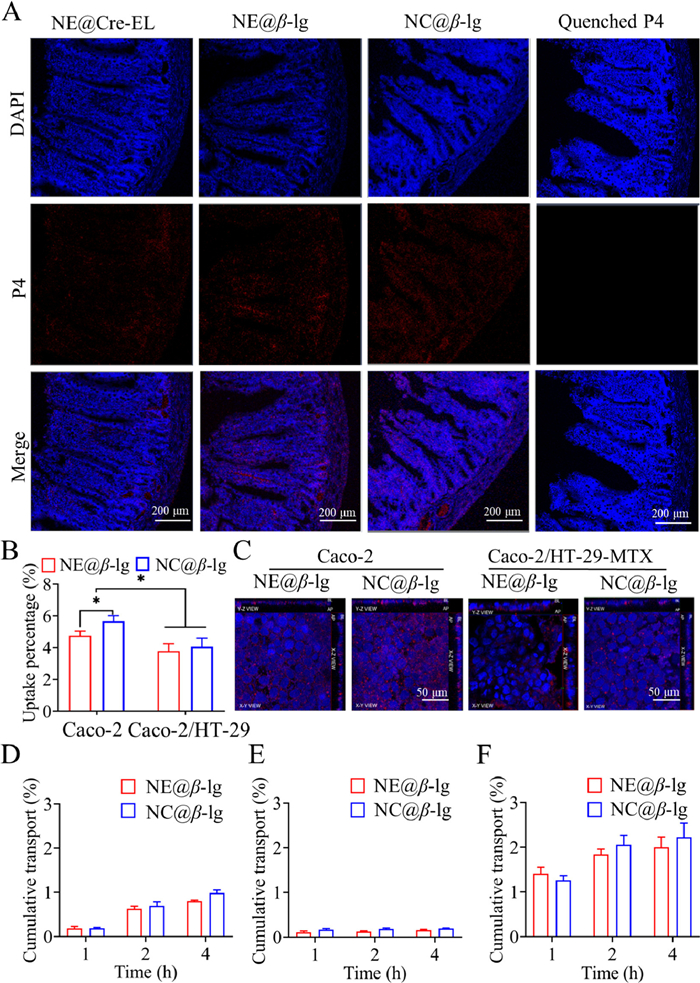
To confirm the transepithelial transport of intact lipid nanoparticles, the ileum of rats treated with lipid nanoparticles was observed under a confocal laser scan microscope (CLSM) following the frozen section (Fig. 4A). The blue and red signals stand for nuclei and intact nanoparticles, respectively. No fluorescence was detected in the ileum of rats treated with P4 quenched solution, indicating the absence of fluorescent recurrence. The fluorescence signal observed in the basolateral (BL) side of the intestinal membranes supported the transepithelial transport of intact lipid nanoparticles. Although the closed loop reduces the lipolysis effects, the fluorescent intensity in the BL side increased in the sequence of NE@Cre-EL < NE@β-lg < NC@β-lg. The lamina propria is rich in lymphatic and blood capillaries, but the lipid nanoparticles are primarily absorbed via the lymph due to size limitation [41]. The long gastrointestinal retention, in combination with the slow lymph flow, enabled a steady flow of lipid nanoparticles from the GIT into the blood circulation via the lymph vessels, giving a mild and sustained hypoglycemic effect.
Figure 4
Figure 4.
Transepithelial transport, cellular uptake and transmembrane transport of β-lg stabilized lipid nanoparticles. (A) CLSM images of frozen section of ileum treated with lipid nanoparticles and P4 quenched solution. DAPI (blue) and P4 signal (red) stand for the cell nuclei and intact nanoparticles, respectively. Scale bar: 200 µm. (B) Cellular uptake of P2 labeled nanoparticles. (C) CLSM images of cell monolayer treated with P4 labeled nanoparticles (blue: nuclei; red: intact nanoparticles; scale bar: 50 µm). Cumulative transport of P2 labeled nanoparticles across (D) Caco-2, (E) Caco-2/HT29-MTX, and (F) Caco-2/HT29-MTX/Raji monolayer. Data are presented as mean ± SD, n = 3 (*P < 0.05).
Caco-2 and Caco-2/HT29-MTX cell models were utilized to investigate the uptake of β-lg stabilized lipid nanoparticles by intestinal epithelia. HT29-MTX cells were used to mimic the mucus-secreting goblet cells. Cellular uptake was indicated by the percentage of fluorescence intensity within cells in comparison with the added value (Fig. 4B). Uptake percentages of NE@β-lg and NC@β-lg were 4.8% ± 0.3% and 5.9% ± 0.3% in the Caco-2 model, and 3.8% ± 0.5% and 4.1% ± 0.5% in the co-cultured model, respectively. The uptake of NC@β-lg was significantly higher than NE@β-lg in the Caco-2 cell model. The presence of the mucus barrier in the Caco-2/HT29-MTX model impeded the uptake of lipid nanoparticles, resulting in a significant reduction in cellular uptake compared with the Caco-2 cell model. The two lipid nanoparticles showed no significant difference in uptake by Caco-2/HT29-MTX cell models.
CLSM was further performed to exclude the possibility of surface adherence by co-localization of the nanoparticles and the nucleus (Fig. 4C). P4 signals (red) representing the intact nanoparticles were localized on the horizontal plane of the nuclei stained by DAPI (blue), confirming the uptake of intact nanoparticles. The Z-axis scanning revealed red signals in the BL side of the cell monolayer, supporting the transepithelial transport of the intact nanoparticles. The fluorescence intensity within the Caco-2 monolayer was higher than within the co-cultured monolayer, in line with the cellular uptake, attributed to the obstruction effect induced by the mucus layer.
Figs. 4D–F show the results of transmonolayer transport of the lipid nanoparticles in Caco-2, Caco-2/HT29-MTX, and Caco-2/HT29-MTX/Raji cell models, respectively. Raji cells were utilized to mimic M cells, which have a strong capacity for the transport of exogenous particles. Cumulative transport of NE@β-lg and NC@β-lg in the Caco-2 cell model amounted to 0.80% ± 0.02% and 0.98% ± 0.07% at 4 h, respectively. Due to the obstruction of the mucus layer, the cumulative transport in the Caco-2/HT29-MTX model was only 0.16% ± 0.02% for NE@β-lg and 0.20% ± 0.01% for NC@β-lg. Maximum transport was found in the Caco-2/HT29-MTX/Raji cell model as 2.0% ± 0.2% for NE@β-lg and 2.2% ± 0.3% for NC@β-lg. The transport of the nanoparticles was inferior to the cellular uptake. This is a common phenomenon as nanoparticles within the cytoplasm may be degraded or released back into the intestinal lumen via exocytosis [31].
In conclusion, the insulin-phospholipid complex was successfully synthesized to enable the loading of insulin in lipid nanoparticles. Mild and sustained hypoglycemic effects were obtained by insulin-loaded lipid nanoparticles. Nonetheless, β-lg stabilized lipid nanoparticles showed higher oral bioavailability than NE@Cre-EL, being a maximum of ~8% versus 3.0%. Enhanced oral absorption of insulin was due to β-lg that slowed down the gastrointestinal digestion/lipolysis of the lipid nanoparticles. β-lg stabilized lipid nanoparticles have more opportunities to survive in the harsh gastrointestinal environment, leading to better protection of insulin and a higher chance of interacting with the intestinal epithelia. ACQ probe-based imaging revealed that intact lipid nanoparticles could cross the intestinal epithelia and accumulate in the liver. Cellular studies confirmed the uptake of the intact nanoparticles.
Declaration of competing interest
The authors declare that they have no known competing financial interests or personal relationships that could have appeared to influence the work reported in this paper.
Acknowledgments
This research was funded by the Science and Technology Committee of Shanghai Municipality (Nos. 19430741400, 23S11901500, 23ZR1413100, and 21430760800), and the National Natural Science Foundation of China (Nos. 81973247 and 82030107).
Supplementary materials
Supplementary material associated with this article can be found, in the online version, at doi:10.1016/j.cclet.2023.108662.
[1]
Q. Zhu, Z. Chen, P.K. Paul, et al., Acta Pharm. Sin. B 11 (2021) 2416–2448. doi: 10.1016/j.apsb.2021.04.001
Oramed Pharmaceuticals, Oramed announces top-line results from phase 3 trial of ormd-0801 for the treatment of type 2 diabetes, 2023, https://oramed.com/oramed-announces-top-line-results-from-phase-3-trial-of-ormd-0801-for-the-treatment-of-type-2-diabetes/.
M.A. Sani, M. Tavassoli, M. Azizi-Lalabadi, K. Mohammadi, D.J. McClements, Adv. Colloid Interface Sci. 305 (2022) 102709. doi: 10.1016/j.cis.2022.102709
T. Yoshida, H. Kojima, K. Sako, H. Kondo, Pharm. Dev. Technol. 27 (2022) 175–189. doi: 10.1080/10837450.2022.2030353
Figure 1
Hypoglycemic effects and in vitro digestion/lipolysis of lipid nanoparticles. (A) Blood glucose level versus time profiles in rats treated with different preparations. Data are presented as mean ± standard deviation (SD), n = 5. (B) Particle size and PDI variation of lipid nanoparticles in in vitro digestion/lipolysis. (C) In vitro digestion/lipolysis monitored by fluorescence reducing. (D) Retention of insulin during the digestion/lipolysis. Data are presented as mean ± SD, n = 3 (*P < 0.05, **P < 0.01).
Figure 2
Live imaging of rats treated with lipid nanoparticles. (A) Live imaging photographs. (B) Variation of fluorescence intensity versus time. (C) Normalized total radiant efficiency versus time. Data are presented as mean ± SD, n = 3 (*P < 0.05, **P < 0.01).
Figure 3
Intestinal translocation and in vivo distribution of lipid nanoparticles. (A) Ex vivo imaging and (B) variation of fluorescence intensity in the gastrointestinal tract of rats treated with lipid nanoparticles. (C) Ex vivo imaging of primary organs (from top to bottom in each panel: brain, heart, lung, liver, spleen, and kidney). (D) Variation of fluorescence intensity in the livers of rats treated with lipid nanoparticles. (E) Absorption percentage of lipid nanoparticles estimated from fluorescence intensity in the liver and gastrointestinal tract. Data are presented as mean ± SD, n = 3 (*P < 0.05, **P < 0.01).
Figure 4
Transepithelial transport, cellular uptake and transmembrane transport of β-lg stabilized lipid nanoparticles. (A) CLSM images of frozen section of ileum treated with lipid nanoparticles and P4 quenched solution. DAPI (blue) and P4 signal (red) stand for the cell nuclei and intact nanoparticles, respectively. Scale bar: 200 µm. (B) Cellular uptake of P2 labeled nanoparticles. (C) CLSM images of cell monolayer treated with P4 labeled nanoparticles (blue: nuclei; red: intact nanoparticles; scale bar: 50 µm). Cumulative transport of P2 labeled nanoparticles across (D) Caco-2, (E) Caco-2/HT29-MTX, and (F) Caco-2/HT29-MTX/Raji monolayer. Data are presented as mean ± SD, n = 3 (*P < 0.05).

 DownLoad:


 下载:
下载:


 下载:
下载:
