Hebei Key Laboratory of Applied Chemistry, College of Environmental and Chemical Engineering, Yanshan University, Qinhuangdao 066004, China
b.
Clean Nano Energy Center, State Key Laboratory of Metastable Materials Science and Technology, Yanshan University, Qinhuangdao 066004, China
c.
State Key Laboratory of Silicon and Advanced Semiconductor Materials, School of Materials Science and Engineering, Zhejiang University, Hangzhou 310058, China
d.
Key Laboratory of Low Dimensional Materials and Application Technology of Ministry of Education, School of Materials Science and Engineering, Xiangtan University, Xiangtan 411105, China
Received Date:
05 April 2023 Accepted Date:
29 May 2023 Revised Date:
22 May 2023 Available Online:
15 May 2024
Abstract:
The development of highly efficient catalysts in the cathodes of rechargeable Li-O2 batteries is a considerable challenge. To enhance the electrochemical performance of the Li-O2 battery, it is essential to choose a suitable catalyst material. Copper selenide (CuSe) is considered as a more promising cathode catalyst material for Li-O2 battery due to its better conductivity and rich electrochemical active sites. However, its electrochemical reaction and fundamental catalytic mechanism remain unclear till now. Herein, in-situ environmental transmission electron microscopy technique was used to study the catalysis mechanism of the CuSe nanosheets in Li-O2 batteries during discharge and charge processes. It is found that Li2O was formed and decomposed around the ultrafine-grained Cu during the discharge and charge processes, respectively, demonstrating excellent cycling. This indicate that the freshly formed ultrafine-grained Cu in the conversion reaction catalyzed the latter four-electron-transfer oxygen reduction reaction, leading to the formation of Li2O. Our study provides important understanding of the electrochemistry of the Li-O2 nanobatteries, which will aid the development of high-performance Li-O2 batteries for energy storage applications.
Lithium oxygen (Li-O2) batteries have attracted great attention in the past few years due to their high specific energy density (~3500 Wh/kg) [1–3], which is much higher than that of the lithium-ion batteries [4,5]. However, the application of Li-O2 battery is greatly retarded by the sluggish oxygen reduction reaction (ORR) and oxygen evolution reaction (OER) [6–8]. Plenty of catalysts that facilitate the reversibility and efficiency of ORR and OER are designed for the rechargeable metal-air batteries. Noble metal catalysts, such as Ru, Pd, Pt, are usually used to facilitate the ORR and OER processes [9–11]. Recently, Huang et al. successfully fabricated core-shell Pd@Pd4S heterostructures decorated on the porous carbon matrix (Pd@Pd4S-C) by a simple method, which is used as an air cathode for Li-O2 batteries [12]. The Pd@Pd4S-C air cathode displayed a quite high discharge capacity of 8777 mAh/g at a current density of 100 mA/g, which can be cycled for 176 cycles at 500 mA/g. Cao et al. successfully synthesized Pt nanocrystals embedded within multilayer Ti3C2 MXene (Pt-Ti3C2) by ultraviolet-assisted synthesis method as air cathode in Li-O2 batteries, and exhibited a high discharge capacity of 14,769 mAh/g, a low charge overpotential of 0.32 V, and excellent cycle performance over 100 cycles [13]. Although displaying a good electrochemical performance, the high cost of these catalysts hinders their widespread practical applications [14–17]. Therefore, it is urgent to develop low-priced catalysts to replace the noble metals [18–20].
Among these low-priced alternatives, transition metal (Fe, Co, Ni, etc.) oxides are widely explored [21–26]. Zhang et al. successfully synthesized N-doped carbon matrix embedded in Mo2C/Co (Co-NC/Mo2C) nano-heterostructures by a hydrothermal method, and discovered the bifunctional catalytic effect of Co-NC/Mo2C composites in Li-O2 batteries. The Co-NC/Mo2C air cathode delivered a very high discharge specific capacity of 21,930 mAh/g at a current density of 100 mA/g, the cycle lifetime can reach 182 cycles at 500 mA/g [27]. Teng et al. synthesized NiCo2S4@nitrogen-deficient graphitic carbon nitride (NCS@ND-CN) by hydrothermal method as an air cathode material for Li-O2 batteries. The Li-O2 battery assembled with NCS@ND-CN exhibits an improved overpotential of 1.01 V, a high discharge capacity of 9660 mAh/g at 100 mA/g and a long-term cycle stability under a limited capacity of 1000 mAh/g at 100 mA/g [28]. As one family of such potential catalysts, cooper-based compounds such as CuCo2S4 [29], CuO [30] and CuCo2O4 [31] show good catalytic performance for both ORR and OER. Priamushko et al. used well-ordered high-surface-area mesoporous Cu/Ni/Co oxides in the Li-O2 batteries, and showed high specific capacity (>7000 mAh/g) at 15 µA [32]. Chen et al. synthesized cobalt-copper bimetallic yolk-shell nanoparticles as cathode catalyst for Li-O2 batteries, which exhibited superior discharge capability (7955 mAh/g at 800 mA/g), long cyclability (122 cycles at 200 mA/g with a cut-off capacity of 1000 mAh/g), and outstanding coulombic efficiency (92% at 200 mA/g) [33]. Niu et al. synthesized hierarchical CuCo2O4 microflowers (CCFs) by a solvothermal method as an air cathode material for Li-O2 batteries. In Li-O2 batteries, the CCFs could keep the discharge voltage stable up to 120 cycles by limiting the capacity at 1000 mAh/g [34].
Although much effort has been devoted to improving the performance of Li-O2 battery [35–40], the detailed working mechanism during charge and discharge processes is still ambiguous, which greatly hinders its application. There are some inconsistence conclusions regarding the reaction mechanisms of the Li-O2 batteries [41–43]. Liu et al. confirmed that the discharge product of Li-O2 batteries is LiOH [44]. Lu et al. believed that the discharge product of Li-O2 batteries is LiO2 [45]. However, Kondori et al. found that Li2O is the main discharge product in Li-O2 batteries [46]. Although a great amount of work has been conducted in order to clarify the reaction mechanism in Li-O2 batteries, it still cannot provide a definite conclusion. Direct microscopy observations of the electrocatalysis during the ORR and OER processes may advance our understanding to the electrochemistry of Li-O2 batteries.
Herein, we report in-situ environmental transmission electron microscopy (ETEM) observations of CuSe catalyzed ORR and OER in a Li-O2 battery. CuSe nanosheets with size of about 500 nm were used as reaction containers for the electrochemical reactions. It is found that Li2O was formed and decomposed surrounding the ultrafine-grained Cu during the discharge and charge reactions, respectively, showing excellent cycling. It is evident that the freshly formed ultrafine-grained Cu in the conversion reaction catalyzed the latter four-electron-transfer ORR, leading to the formation of Li2O. The results provide important new mechanistic understanding into the electrocatalysis in Li-O2 batteries.
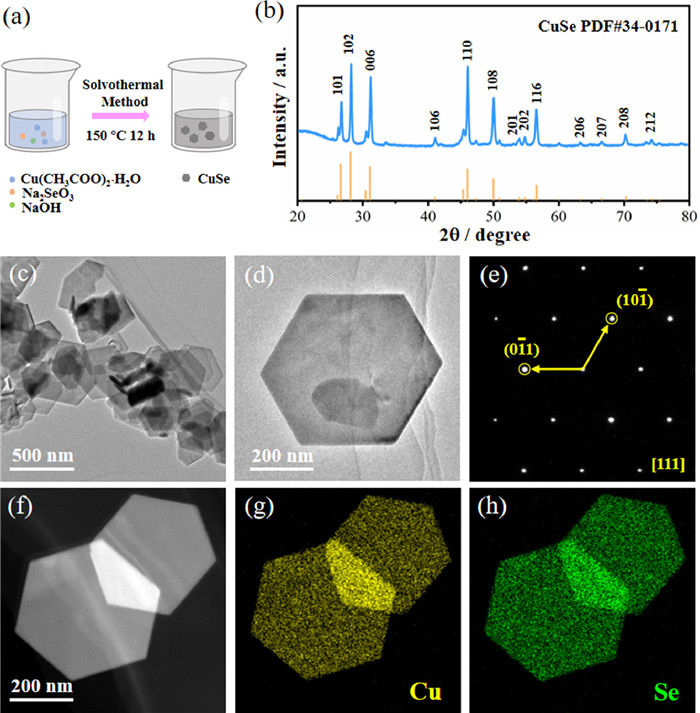
CuSe samples were fabricated through solvothermal method. 1 mmol Na2SeO3, 2 mmol Cu(CH3COO)2·H2O and 2 mmol NaOH were dissolved in 15 mL of deionized water and 10 mL of ethylene glycol. After stirring for 30 min, the solution was transferred to a 50 mL Teflon-lined stainless-steel autoclave and then solvothermally treated at 150 ℃ for 12 h in an electric oven (Fig. 1a).
Figure 1
Figure 1.
(a) Schematic illustration of the fabrication of hexagonal crystal system CuSe nanosheets. (b) XRD pattern of the CuSe nanosheets. (c) Low magnification TEM image, and (d) middle magnification TEM image of the as-synthesized ordered CuSe nanosheets. (e) The EDP shows the monocrystalline structure of CuSe. (f) HAADF-STEM image, and (g, h) EDS elemental mappings of CuSe.
The phase features and structures of CuSe nanosheets were characterized by powder X-ray diffractometer (XRD). Morphological study was conducted in a Cs-corrected ETEM (Titan G2, 300 kV). The morphology and composition of the CuSe nanosheet was characterized by a transmission electron microscope (TEM, Talos 200 kV) equipped with an energy-dispersive X-ray spectrometer (EDS). Macro Li-O2 batteries were assembled into CR2032-type coin cells and were tested by using a LAND CT3001A multichannel battery testing system. A slurry by mixing Ketjen Black (KB, 50 wt%), CuSe (40 wt%) and Polytetrafluoroethylene (PTFE, 10 wt%) was fabricated and pasted in a stainless-steel mesh of 12.4 µm thick, which was used as the cathode of the coin cell battery. All the cells were assembled under an Ar atmosphere in a glove box, using a clean lithium metal foil as the anode, a glass-fiber separator, and a 1 mol/L tetraethylene glycol dimethyl ether (TEGDME)-lithium bis(trifluoromethane sulfonimide) (LiTFSI) electrolyte. The battery tests were conducted under 1 atm O2 atmosphere at 25 ℃. The gravimetric capacity and current densities were calculated based on the CuSe mass. The corresponding CuSe loading is ~0.4 mg.
CuSe nanosheets are fabricated by a facile solvothermal strategy. Fig. 1a shows the schematic illustration of the preparation of CuSe nanosheets. The typical morphological and structural characteristics of the CuSe nanosheets are shown in Figs. 1b-h. The sample structure was further explored by XRD (Fig. 1b), where all diffraction peaks could be well indexed to a hexagonal CuSe phase (space group: P63/mmc), and well consistent with the standard spectrum (PDF#034–0171). The sharp diffraction peaks at 26.6°, 28.1°, 31.1°, 46.0° and 50.0° correspond to the (101), (102), (006), (110) and (108) planes, respectively.
Meanwhile, no obvious extra diffraction peaks corresponding to any impurity phases are observed in the pristine CuSe samples prepared. Combined with the XRD result, low and middle magnification TEM images also revealed the distinct hexagonal morphology of the nanosheets, and each nanosheet was half-transparent with a uniform thickness (Figs. 1c and d). As shown in the TEM image (Figs. 1c and d), the CuSe nanosheets exhibited a typical hexagonal structure with size of about 500 nm. Moreover, the bright diffraction points present in the corresponding electron diffraction pattern (EDP) image demonstrate a monocrystalline feature of the as-synthesized CuSe nanosheets (Fig. 1e). The so-called single crystal refers to the regular and periodic arrangement of particles inside the crystal in three-dimensional space, or the entire crystal is composed of the same spatial lattice in the three-dimensional direction, and the arrangement of particles in the entire crystal in space is long-range order. As shown in Fig. 1e, the electron diffraction pattern shows that a single CuSe nanosheet has regular two-dimensional diffraction spots. If there are many dispersed CuSe nanosheets in the TEM image, and there are multiple CuSe nanosheets within the diffraction selection range, polycrystalline diffraction rings will be displayed. Furthermore, high angle annular dark field scanning transmission electron microscopy (HAADF-STEM) and corresponding EDS mapping reveal a uniform elemental distribution of Cu and Se in the CuSe nanosheets (Figs. 1f-h and Fig. S1 in Supporting information).
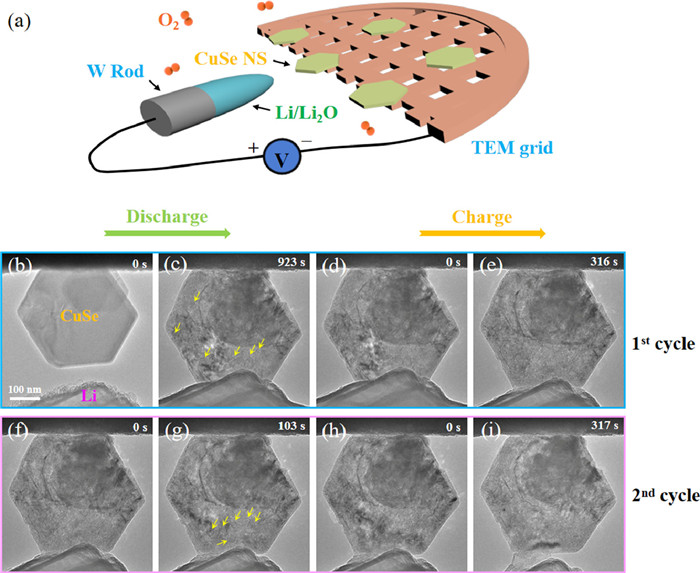
The in-situ Li-O2 battery was constructed through a two-probe configuration in a Cs-corrected ETEM. As shown in Fig. 2a, CuSe glued to a Cu grid was used as the working cathode. Metal Li scratched on a tungsten (W) tip inside a glove box filled with Ar gas was used as the reference and counter electrode. And the naturally formed Li2O on the metal Li served as a solid electrolyte. The nanobattery was inserted into a TEM-STM (scanning tunneling microscopy) specimen holder (Pico Femto FE-F2) inside a glove box. Then the holder was sealed in a home-built air-tight bag filled with dry Ar and transferred to the ETEM. The total time of exposure to the air was less than 2 s, which limited the extent of Li2O formation on the surface of the Li metal. During the discharge/charge experiments, an O2 gas (purity higher than 99.99%) with a pressure of 0.1 mbar was flowed into the ETEM chamber. The CuSe was manipulated to approach the Li2O layer, and then a potential was applied to the CuSe versus the Li metal electrode to either charge or discharge the battery. Real-time visualization of the structural and phase changes of the CuSe can be correlated directly to the electrochemical reactions based on the above configuration.
Figure 2
Figure 2.
(a) Schematic of the experimental setup. A tungsten tip scratched Li, the passivation Li2O layer and the CuSe were used as the anode, the electrolyte and the medium for the O2 cathode, respectively. The setup was exposed to a O2 gas at a gas pressure of 0.1 mbar. (b-i) Time-lapse structure evolution of the air cathode in a Li-O2 battery. (b, c) During the 1st discharge reaction, a large number of nanoballs emerged at nanosheet substrate, which then grew under a constant negative bias. (d, e) Upon a reversing bias, the charging reaction took place, and the ball shrank continuously until its complete disappearance. And the discharge and charge reactions were repeatable, with the first two cycles are shown in (b-e) and (f-i), respectively.
In order to study the microscopic reaction behavior of Li-O2 nanobattery, a schematic of an in-situ Li-O2 nanobattery setup is shown in Figs. 2a-i (Movie S1 in Supporting information). The morphology evolution of CuSe cathode during discharge and charge process was analyzed by TEM images. During 1st discharge reaction, upon applying a negative potential to the CuSe against the counter electrode Li (which was grounded in our experiment), a large number of nanoballs emerged at the nanosheet and area of the nanosheet increase of ~15% after 923 s (Figs. 2b and c). When the voltage was reversed, the nanoball shrank continuously until its disappearance, which eventually decomposed entirely after 316 s of charge (Figs. 2d and e). Upon applying a negative bias on the CuSe again, a large number of new nanoballs appeared again (Figs. 2f and g), and the nanoball shrank again at a reversed bias (Figs. 1h and i). We repeated the experiment to confirm that the phenomenon was not accidental, and the results were consistent (Fig. S2 and Movie S2 in Supporting information). For comparison, we also conducted a similar experiment without oxygen existence (Fig. S3 and Movie S3 in Supporting information). However, the CuSe phase transition was plainly evident, and no nanoballs were found on the nanosheet.
In order to minimize the e-beam irradiation effect, we performed time-resolved experiments under the e-beam black mode to characterize the morphology evolution of the Li-O2 nanobatteries. In the e-beam black mode, the e-beam effect is minimized, as we only took images intermittently during the electrochemical reaction, which is in contrast to the bright field image mode, in which the e-beam showered the samples continuously. The e-beam black images shown in Fig. S4 (Supporting information) demonstrate a similar morphology evolution process to that occurred in the bright field images (Fig. 2), which confirms that the e-beam is not influencing the experimental results.
CuSe shows great application prospect for Li-O2 battery due to its good conductivity, the weak electronegativity and the large ionic radius of Se. Meanwhile, the unique nanostructure of CuSe enhances the surface area of the electrode, providing more active sites for the electrochemical reactions to occur, resulting in higher discharge specific capacity. The CuSe-based electrode exhibits excellent stability during cycling, which helps to maintain the capacity of the battery over multiple discharge/charge cycles. Overall, the combination of the catalytic activity of CuSe, its high surface area, and its excellent stability make it a promising candidate for high-performance Li-O2 batteries operating at high current densities.
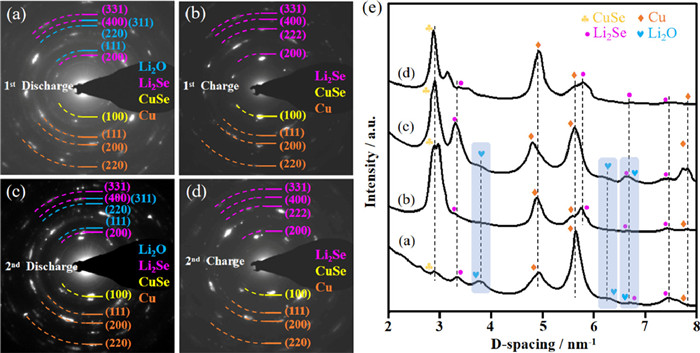
In order to investigate the detailed structural evolution of the CuSe nanosheet during the ORR and OER reaction, in-situ EDPs were recorded during the discharge/charge process (Fig. 3 and Fig. S5 in Supporting information). At the beginning stage, the pristine CuSe was partially transformed into Cu (Fig. 3a) via the following conversion reaction: CuSe + 2Li → Cu + Li2Se, consistent with that reported in conventional lithium-ion electrochemical cell [47–50]. At the final stage of discharge process, only the ORR product of Li2O was present. As the bias was reversed, the corresponding EDPs changed from diffused diffraction rings to well-defined diffraction rings, and most of which are indexed as Cu and Li2Se, which contains a little of CuSe (Fig. 3b). The diffractions rings evolved into diffuse rings again upon reversed bias (Figs. 3c and d), and the process was repeatable. As shown in the diffraction integral diagram (Fig. 3e), the discharge products can be indexed as Li2O, Cu, Li2Se, and a trace amount of CuSe, while after charging, most of Li2O decomposed. In the following discharge/charge process, the formation and decomposition of Li2O were repeatable. Cu and Li2Se, as metal and ionic conductors, can help transport lithium ions between the negative and positive electrodes. During the cycling process of the Li-O2 battery, Cu and Li2Se can stably exist and promote the transport of lithium ions, which helps to improve the discharge performance and cycle lifespan of the Li-O2 battery. Therefore, both Cu and Li2Se play important roles in Li-O2 batteries, jointly promoting the stability of battery performance.
Figure 3
Figure 3.
(a) Phase identification of the 1st discharge products by electron diffraction patterns. The bias was maintained at −1.0 V constantly during the entire discharge process. The EDP can be consistently indexed as Li2O, Cu, Li2Se and CuSe. (b) When a positive potential was applied to the CuSe against the Li electrode, the EDP of the nanosheet changed from Cu, Li2Se and CuSe. (c, d) Characterization of the products of the second cycle was the same as that of the first cycle. (e) Diffraction integral diagram showing the phase structure evolution of the discharge and charge products in an O2 environment. The discharge products can be indexed as Li2O, Cu, Li2Se, and a trace amount of CuSe, while after charging, these Li2O signals nearly disappear. In the following discharge/charge process, these EDP phenomena were repeated.
We conducted in-situ EDS mapping to study the composition changes of CuSe catalyst during multiple cycles. These results showed that the content of Cu and Se elements remained almost unchanged during the cycling process, but the O content in the charged state was significantly lower than that in the discharged state (Fig. S6 in Supporting information).
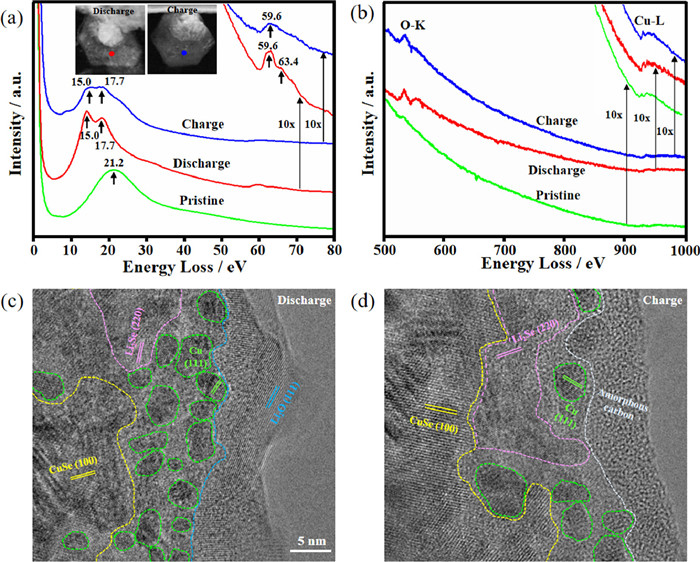
The discharge/charge products were further analyzed by electron energy loss spectroscopy (EELS). EELS spectra of the discharged and charged products are shown in Figs. 4a and b, respectively. Low-loss EELS from the nanosheet of both the discharge and charge states show similar profiles (Fig. 4a) with two multiple plasmon peaks located at 15.0 and 17.7 eV and two additional low intensity plasmon peaks situated at 59.6 and 63.4 eV; these peak positions and profiles show excellent repeatability. Combining this with the EDP results, we assign these characteristic peaks to that of Li2O. Compared with the commercial Li2O EELS result (Fig. S7 in Supporting information), we assign these three characteristic peaks to Li2O [51–53]. The low-loss spectrum of the pristine CuSe was different from that of the deeply discharged one, and the former shows a major low-loss peak at 21.2 eV. In the core loss spectra, the pristine CuSe shows the presence of Cu with no trace of O, while that from the discharge and charge region consistently shows the presence of Cu and O (Fig. 4b). Meanwhile, we analyzed the discharge/charge products further by high resolution transmission electron microscope (HRTEM), indicating that the discharged products were Li2O, Cu, and Li2Se (Fig. 4c and Fig. S8 in Supporting information), while the charged products were mainly Cu and Li2Se (Fig. 4d). As shown in Figs. 4c and d, we have divided the regions of the main discharge products and main charging products of Li-O2 batteries, respectively. Moreover, the HRTEM image was acquired from a very local region, which may not represent the entire sample.
Figure 4
Figure 4.
Low-loss and core-loss EELS spectra from the discharged and charged products. EELS spectra from: discharge product overlaid on nanosheet region (red point), and the charge product region (blue point), respectively. (a) Low-loss spectra from: the pristine CuSe (green line), discharge product on the nanosheet (red line), and the charge product (blue line), respectively. (b) Core-loss spectra. (c, d) HRTEM images of the discharge products showing the formation of Li2O, Cu, and Li2Se, and the charge products showing the formation of Cu, and Li2Se.
To further clarify the electrochemical reaction mechanism of the Li-O2-CuSe battery, we also conducted control experiments in the Li-O2-Cu battery under similar experimental conditions to the Li-O2-CuSe battery (Fig. S9 in Supporting information). When we applied a negative potential to the Cu, some nanoparticles were formed at the surface of the Cu, and a thin layer of transparent substance formed (Figs. S9a and b). As shown in Fig. S9c, the main discharge product was identified to be Li2O. In addition, EELS spectra of the discharge product are shown in Figs. S9d and e. In the low-loss regions, the major plasmon loss peaks of the discharged product were 58.8 eV, and 62.3 eV (Fig. S9d). In the core-loss of the discharge product, it shows the presence of O (Fig. S9e). Compared with the commercial Li2O low-loss EELS result, we assign these peaks to Li2O. In addition, the core-loss spectrum shows the presence O-K edge, confirming the formation of Li2O during the discharge process.
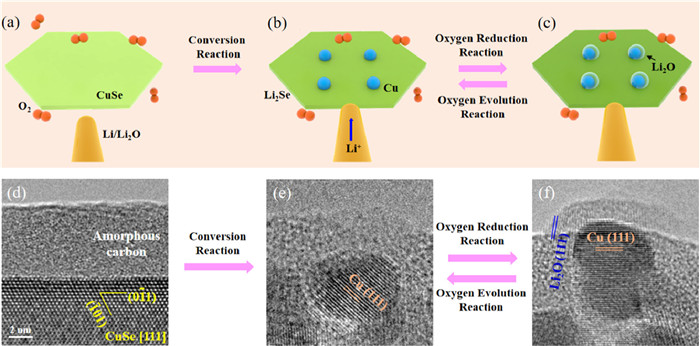
On the basis of these results, the ORR is proposed to occur in the following way: during the conversion reaction, CuSe was first converted to Li2Se combined with Cu. The newly formed ultrafine-grained Cu adsorbed the O2 molecules and catalyzed the O2− formation, and the freshly formed O2− reacted with Li+, forming Li2O. The freshly formed ultrafine-grained Cu apparently catalyzed the ORR, as when large amount of ultrafine-grained Cu were generated, the ORR accelerated. This formed a cyclic reaction loop as shown in Figs. 5a-c, that is, (Ⅰ) CuSe + 2Li+ + e− → Cu + Li2Se; (Ⅱ) the freshly formed Cu catalyzed 4Li+ + O2 + 4e− → 2Li2O. Meanwhile, ultrafine-grained Cu have the ability to promote the decomposition of Li2O in the OER reaction. The ultrafine-grained Cu observed by HRTEM images confirmed the conversion reaction of CuSe and the catalytic reaction of Cu (Figs. 5d-f). We have also confirmed our viewpoint through the evolution process of HRTEM images, which is that Cu particles catalyze the formation and decomposition of Li2O (Fig. S10 in Supporting information).
Figure 5
Figure 5.
(a-c) Schematic of the reaction mechanism during the discharge (ORR) and charge (OER) process in a Li-O2 battery. During the conversion reaction, CuSe was converted to Cu and Li2Se. The freshly formed ultrafine-grained Cu catalyzed the following ORR and generated Li2O. During the OER reaction, ultrafine-grained Cu catalyzed the decomposition of Li2O. (d) HRTEM images of the pristine CuSe, (e) the products of conversion reaction showing the formation of Cu, and (f) the products of ORR reaction showing the formation of Cu, and Li2O.
Ultrafine-grained Cu is a type of material with grain sizes in the nanometer range. It has high surface area and volume ratio, which leads to increased surface energy and higher reactivity. When Li-O2 batteries operate, Li2O is formed on the surface of the cathode as a discharge product. The formation of Li2O on ultrafine-grained Cu is influenced by its physicochemical properties. The high surface area and volume ratio of ultrafine-grained Cu facilitates the formation of Li2O due to the increased surface area available for the reaction between lithium ions and oxygen molecules. During the charging process of Li-O2 batteries, Li2O is decomposed on the surface of the cathode. The decomposition of Li2O on ultrafine-grained Cu is also affected by its physicochemical properties. The high surface energy and reactivity of ultrafine-grained Cu facilitate the decomposition of Li2O due to the increased availability of reactive sites. In summary, the physicochemical properties of ultrafine-grained Cu play an important role in the formation and decomposition of Li2O on its surface in Li-O2 batteries.
Li2O2 has been reported as the discharge product of Li-O2 batteries in the TEGDME system in a variety of literature papers [54–57]. However, there are certain distinctions between the discharge products of our in-situ solid-state Li-O2 batteries and those of liquid electrolyte-based Li-O2 batteries. Recently, a paper on solid-state Li-O2 batteries supported our opinion [46]. Kondori et al. found that Li2O is the main product in a room temperature solid-state lithium-air battery by using a composite polymer electrolyte based on Li10GeP2S12 nanoparticles embedded in a modified polyethylene oxide polymer matrix. They believe that if there is sufficient supply of Li cations and electrons, this can lead to the formation of Li2O. A crucial factor would be the first development of a LiO2/Li2O2 phase, both of whose constituents are capable of being electrically and ionically conductive, and having an air interface as an O2 source. This system could then provide the needed mixed electron/ionic conduction properties for electrochemical formation of Li2O, resulting in the overall four electron reaction in the Li2O generation pathway. A stable solid-state electrolyte with strong ionic conductivity that interfaces well with the cathode is needed for this method of achieving a four-electron reaction for a Li-O2 battery.
Herein, we assembled a solid-state Li-O2 battery with Li7La3Zr2O12 as the solid-state electrolyte, metal Li as the negative electrode, and CuSe as the positive catalyst. Structure evolutions of the discharge and charge product were analyzed by EDPs and EELS (Fig. S11 in Supporting information). As shown in Fig. S11a, the main discharge products were identified to be Li2O, and Cu. The EDP of corresponding charging products, and most of which are indexed as amorphous carbon (Fig. S11b), indicating that Li2O has been decomposed. In addition, EELS spectra of the discharge and charge product are shown in Figs. S11c and d. In the low-loss regions, the major plasmon loss peaks of the discharged product were 58.6 eV, and 62.2 eV (Fig. S11c). Meanwhile, the main plasma loss peak of the charging product disappears, indicating the decomposition of Li2O. In the core-loss of the discharge product, it shows the presence of O (Fig. S11d). Compared with the commercial Li2O low-loss EELS result, we assign these peaks to Li2O. In addition, the core-loss spectrum shows the presence O-K edge, confirming the formation of Li2O during the discharge process. Interestingly, the discharge product Li2O was also found in macro Li-O2 batteries, confirming the validity of our in-situ ETEM results.
In summary, we successfully conducted in-situ discharging/charging of a Li-CuSe/O2 battery inside the ETEM. During discharge, Li2O nanoballs were formed via (Ⅰ) CuSe + 2Li+ + e− → Cu + Li2Se; (Ⅱ) the freshly formed Cu catalyzed 4Li+ + O2 + 4e− → 2Li2O, leading to the formation of plenty of nanoballs in the nanosheet. During charge, Li2O was decomposed back to Li and O2. Our results provide an in-depth understanding to the working mechanism of a Li-O2 battery, which may lead to the design of Li-O2 batteries for energy storage applications.
Declaration of competing interest
The authors declare that they have no known competing financial interests or personal relationships that could have appeared to influence the work reported in this paper.
Acknowledgments
This work was financially supported by the National Natural Science Foundation of China (Nos. 52022088, 51971245), Natural Science Foundation of Hebei Province (No. F2021203097). China Postdoctoral Science Foundation (No. 2021M702756).
Supplementary materials
Supplementary material associated with this article can be found, in the online version, at doi:10.1016/j.cclet.2023.108624.
[1]
H.D. Lim, B. Lee, Y. Zheng, et al., Nat. Energy 1 (2016) 16066. doi: 10.1038/nenergy.2016.66
Figure 1
(a) Schematic illustration of the fabrication of hexagonal crystal system CuSe nanosheets. (b) XRD pattern of the CuSe nanosheets. (c) Low magnification TEM image, and (d) middle magnification TEM image of the as-synthesized ordered CuSe nanosheets. (e) The EDP shows the monocrystalline structure of CuSe. (f) HAADF-STEM image, and (g, h) EDS elemental mappings of CuSe.
Figure 2
(a) Schematic of the experimental setup. A tungsten tip scratched Li, the passivation Li2O layer and the CuSe were used as the anode, the electrolyte and the medium for the O2 cathode, respectively. The setup was exposed to a O2 gas at a gas pressure of 0.1 mbar. (b-i) Time-lapse structure evolution of the air cathode in a Li-O2 battery. (b, c) During the 1st discharge reaction, a large number of nanoballs emerged at nanosheet substrate, which then grew under a constant negative bias. (d, e) Upon a reversing bias, the charging reaction took place, and the ball shrank continuously until its complete disappearance. And the discharge and charge reactions were repeatable, with the first two cycles are shown in (b-e) and (f-i), respectively.
Figure 3
(a) Phase identification of the 1st discharge products by electron diffraction patterns. The bias was maintained at −1.0 V constantly during the entire discharge process. The EDP can be consistently indexed as Li2O, Cu, Li2Se and CuSe. (b) When a positive potential was applied to the CuSe against the Li electrode, the EDP of the nanosheet changed from Cu, Li2Se and CuSe. (c, d) Characterization of the products of the second cycle was the same as that of the first cycle. (e) Diffraction integral diagram showing the phase structure evolution of the discharge and charge products in an O2 environment. The discharge products can be indexed as Li2O, Cu, Li2Se, and a trace amount of CuSe, while after charging, these Li2O signals nearly disappear. In the following discharge/charge process, these EDP phenomena were repeated.
Figure 4
Low-loss and core-loss EELS spectra from the discharged and charged products. EELS spectra from: discharge product overlaid on nanosheet region (red point), and the charge product region (blue point), respectively. (a) Low-loss spectra from: the pristine CuSe (green line), discharge product on the nanosheet (red line), and the charge product (blue line), respectively. (b) Core-loss spectra. (c, d) HRTEM images of the discharge products showing the formation of Li2O, Cu, and Li2Se, and the charge products showing the formation of Cu, and Li2Se.
Figure 5
(a-c) Schematic of the reaction mechanism during the discharge (ORR) and charge (OER) process in a Li-O2 battery. During the conversion reaction, CuSe was converted to Cu and Li2Se. The freshly formed ultrafine-grained Cu catalyzed the following ORR and generated Li2O. During the OER reaction, ultrafine-grained Cu catalyzed the decomposition of Li2O. (d) HRTEM images of the pristine CuSe, (e) the products of conversion reaction showing the formation of Cu, and (f) the products of ORR reaction showing the formation of Cu, and Li2O.

 DownLoad:

 下载:
下载:


