Figure 1.
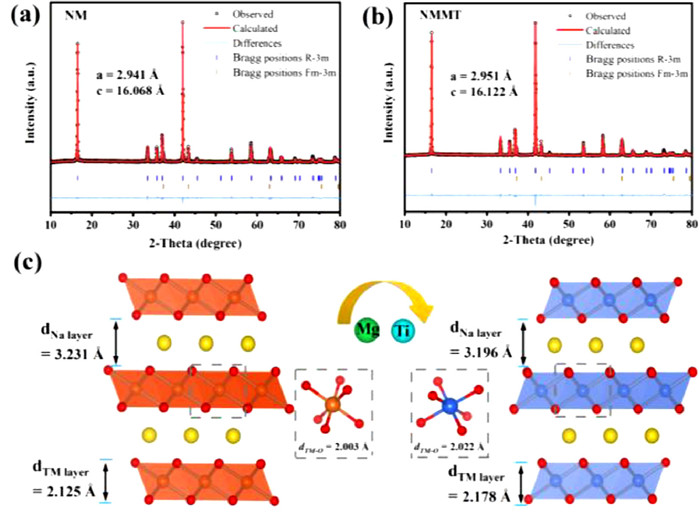
XRD and Rietveld refinement patterns of (a) NM and (b) NMMT samples. (c) Schematic illustration of the crystal structure of O3-type cathode.
Suppression of multistep phase transitions of O3-type cathode for sodium-ion batteries
Shengyu Zhao , Qinhao Shi , Wuliang Feng , Yang Liu , Xinxin Yang , Xingli Zou , Xionggang Lu , Yufeng Zhao

As a competitive candidate for lithium-ion batteries, sodium-ion batteries (SIBs) have aroused much attention and been intensively studied due to abundant resource and low cost, which endow it a prospect in stationary energy storage systems [1–5]. Among components of batteries, the cathode material plays the decisive part of the electrochemical performance. Therefore, large number efforts have been devoted to developing low cost and environmentally friendly cathode with long cycle life. Therein, O3-type layered oxide cathode materials are regard as a desirable cathode for practical application owing to the sufficient Na+ reservoirs, high reversible capacity and flexible synthesis process [6–10].
In particular, O3-type NaNi0.5Mn0.5O2 cathode material with high capacity delivery and moderate plateau voltage has been extensively explored [11,12]. However, it is universally accompanied by complex multistep phase transitions based on the TMO2 slab gliding or Na+/vacancy ordering during the repeated charge and discharge. Meanwhile, drastic volume changes within the unit cell and the accumulation of micro-strain may trigger the generation of internal microcracks and structure degradation [13–16]. In addition, the O3-type NaNi0.5Mn0.5O2 cathode material requires high migration energy barriers during the extraction/insertion due to the sodium ion migration through intermediate tetrahedral site, leading to slow kinetics, inferior rate capacity and rapid capacity decline [17–19]. Therefore, it is essential to adopt an effective strategy to regulate NaNi0.5Mn0.5O2 cathode materials for good structural integrity and high capacity retention.
Cation doping is deemed to be an effective strategy to mitigate the structural changes and enhance the cyclic performance. Flexible Ti doping at Mn octahedra site in a P2-type cathode material was verified to be able to enhance the structure stability by absorbing the electrochemical-induced strain during the cycling process [20]. Moreover, Ti doping can smooth the charge/discharge curves and stabilize the crystal structure, leading to ameliorative cyclic stability [21–23]. However, Ti is more expensive than Mn and the addition needs to be balanced between cost and performance. In addition, Mg doping at the Ni site can suppress slippage of the transition metal layer, leading enhanced cycling stability in the high voltage region [24–26]. Meanwhile, the price of Mg is comparable to Na and does not trigger an increase in material costs. Therefore, a Mg/Ti co-doping in NaNi0.5Mn0.5O2 cathode material may be a very effective way to suppress complex multistep phase transition, remain good structure integrality and enhanced cyclic performance relying on reinforced skeleton structure of layered oxides to tolerate volume changes and micro-strain.
Herein, we employed Mg/Ti co-doping in NaNi0.5Mn0.5O2 cathode material to enhance the cyclic performance and structural integrity. After doping, the enlarged slab spacing in TMO2 layer can strengthen the whole skeleton structure of layered oxides, while interslab spacing in Na layer decreased, which is benefit for the structure stability. Thus, it delivered an outstanding capacity retention of 82.3% after 200 cycles at 1 C in the voltage range of 2.0–4.0 V (56.1% for pristine sample). In addition, it still maintains the high capacity of 86.6 mAh/g (56.5 mAh/g for pristine sample) after 100 cycles at 0.1 C in the wide voltage range of 2.0–4.5 V. Ex-situ XRD characterization verified the structure evolution of the Mg/Ti co-doped cathode upon charge/discharge, which only goes through single O3 to P3 phase transition. And the particles were almost undamaged after cycling for the Mg/Ti co-doped cathode material, indicating reinforced skeleton structure. By contrast, the NaNi0.5Mn0.5O2 cathode material undergoes complex multistep phase transitions (O3-O′3-P3-P′3-P3′-O3′-P3′′) with drastic volume changes. Furthermore, it is verified that there were obvious microcracks on the particles, which is mainly resulting from inferior structural stability and corrosion of electrolyte. This research will enable the emergence of highly sustainable energy storage devices with outstanding performance.
The XRD patterns with corresponding Rietveld refinement results are presented in Figs. 1a and b. All diffraction peaks can be well matched with O3-type α-NaFeO2 (space group: R-3 m) [7,18], which indicates the Mg/Ti have successfully doped the crystal structure. It is worth pointing out that an additional diffraction peak located at 43° is corresponding to NiO impurity resulting from solubility limit of nickel, which is usual in the Ni-based O3-type cathode materials [11,12]. After Mg/Ti co-doping, the refined lattice parameters a and c of NMMT sample increased to 2.951 Å and 16.122 Å due to the larger ionic radius of Mg/Ti (Tables S1 and S2 in Supporting information) [27,28]. In addition, Na layer decreased to 3.196 Å while TMO2 layer increased to 2.178 Å (Fig. 1c). The compressed Na layer will lead a more stable crystal structure [12].
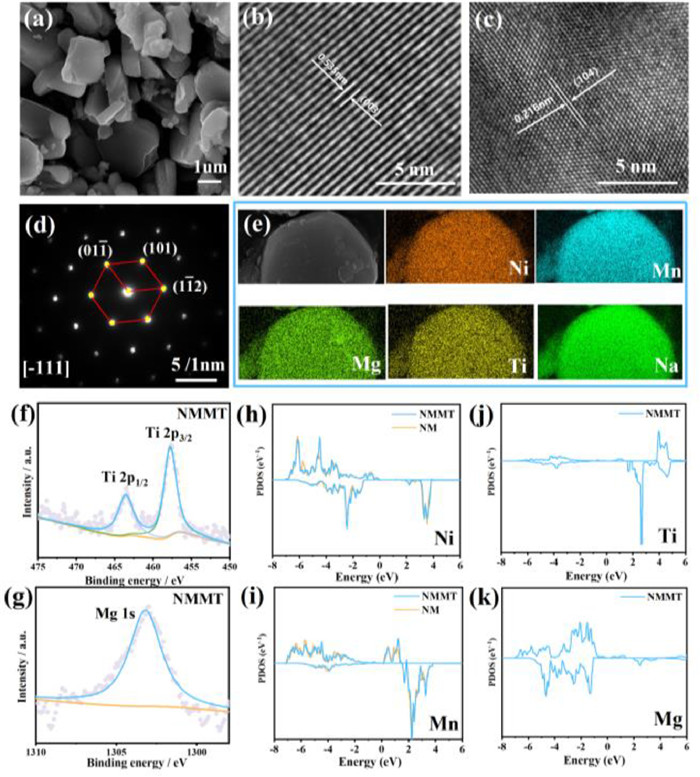
Fig. S1a (Supporting information) and Fig. 2a display the typical SEM images of NM and NMMT cathodes, respectively. It is observed that the two samples both have an irregular plate-like morphology. The HRTEM images (Figs. 2b and c) of NMMT sample exhibit clear lattice fringes with D-spacing of 0.535 nm and 0.216 nm, which are assigned to the (003) and (104) crystal planes [29]. A similar interplanar distance for pristine NM sample (Fig. S1c in Supporting information) was assigned to the (003) crystal planes. The electron diffraction pattern (Fig. 2d) indicates the hexagonal lattice for NMMT sample and good crystallinity. The EDS mapping on the NMMT particles (Fig. 2e) affirmed the uniform distribution of the elements (Ni, Mn, Ti, Mg and Na). Meanwhile, the EDS images (Fig. S1d in Supporting information) for NM sample reveal that Ni, Mn, Na and O elements are in existence. Furthermore, element composition of samples was determined by inductively coupled plasma mass spectrometry (ICP-MS), and the results are similar to designed values (Table S3 in Supporting information). The valence state of the elements was determined X-ray photoelectron spectroscopy (XPS). For the Ni 2p spectra (Fig. S2 in Supporting information), the peaks located at 872.1 and 854.6 eV are allocated to Ni 2p1/2 and Ni 2p3/2, which indicate the valence of Ni is mainly bivalent. The Mn 2p1/2 and 2p3/2 peaks at 653.8 and 642.1 eV are allocated to Mn4+ in the sample [30]. Furthermore, there are two characteristic peaks located in 463.6 and 457.8 eV in Fig. 2f, demonstrating that the valence state of Ti is tetravalent [31,32]. The peak at 1303.0 eV of Mg 1s spectra (Fig. 2g) is corresponding to Mg2+ [33]. Thus, the XPS spectra of Ti and Mg further confirm the successful doping in NMMT sample. The electronic structures of NM and NMMT samples were also revealed by partial density of states (PDOS) based on DFT theory calculations. According to the PDOS profiles (Figs. 2h-k), the valence of Ni, Mn, Mg and Ti are allocated to +2, +4, +2 and +4 after Ti/Mg co-doping. They are consistent with XPS results and it is confirmed that there is no valence change [34].
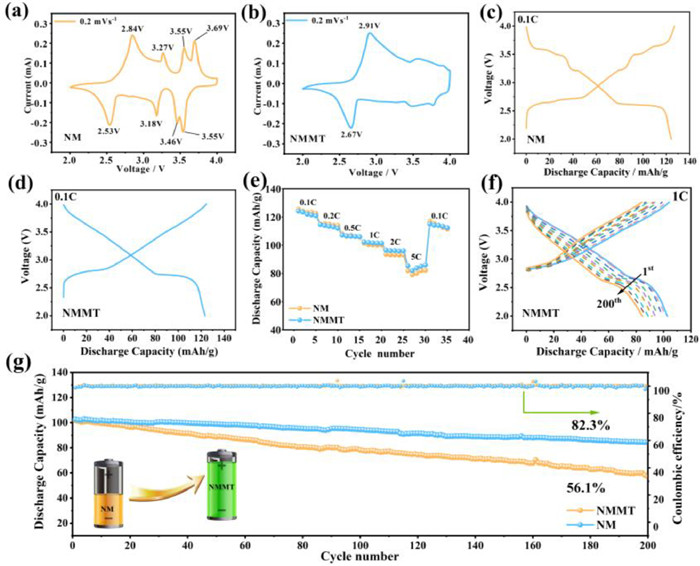
Figs. 3a and b exhibit the CV curves of NM and NMMT electrodes at 0.2 mV/s in the voltage range of 2.0−4.0 V. For NM electrode, there are four pairs of redox peaks (2.84/2.53, 3.27/3.18, 3.55/3.46 and 3.69/3.55 V). By contrast, NMMT electrode exhibits a redox peak located in 2.91/2.67 V and other peaks above 3 V became weaker, which may be due to suppressive multistep phase transition resulting from more stable structure after Mg/Ti co-doping. The electrochemical storage performances of the NMMT and NM cathodes were analyzed within a voltage range of 2.0–4.0 V (1 C = 240 mA/g). The charge/discharge curve at 0.1 C for NM electrode displayed several voltage plateaus and steps (Fig. 3c), indicating complex multistep phase transitions induced by TMO2 slab gliding along with Na+/vacancy ordering [13]. However, the charge/discharge profile of NMMT (Fig. 3d) electrode became smoother and the voltage plateaus above 3.0 V disappeared, which may be due to the suppressive multistep phase transitions. For NMM and NMT electrodes, the charge/discharge curves (Fig. S3 in Supporting information) became slightly smooth compared with NM electrode. It is worth mentioning the charge/discharge curve of NMMT electrode consists of a plateau accompanied by a sloping line, it may be corresponding a single O3-P3 phase transition and has been confirmed in the previous literature [35], which will be discussed in the latter section. In Fig. 3e, the NMMT electrode exhibited similar rate capability compared with NM electrode, corresponding to discharge capacities of 124.2, 114.7, 107.2, 102.3, 96.5 and 85.4 mAh/g at 0.1, 0.2, 0.5, 1, 2 and 5 C, respectively. When it returned to 0.1 C after 5 C rate tests, a discharge capacity of 115.1 mAh/g was delivered, demonstrating the good reversibility of the NMMT sample. It is worth mentioning that despite the slight compression of the sodium layer, the NMMT material exhibits enhanced rate capacity at 1, 2 and 5 C, which is similar to that previously reported in the literature [12]. The cyclic performance of NM and NMMT electrodes are shown in the Fig. 3g (GCD curves for NMMT, Fig. 3f). After 200 cycles at 1 C, the NMMT electrode showed the capacity retention of 82.3%, higher than NM electrode (56.1%). Meanwhile, the capacity retention of NMT and NMM electrodes are 76.5% and 66.7%, so the co-doping can gain the best cyclic performance (Fig. S3). It can also be inferred that the outstanding cyclic performance for NMMT electrode is resulting from suppressive multistep phase transitions and the solid-solution reaction of a large region [18], which will be discussed later. In addition, the cyclic performance is superior to many reported O3-type cathode materials (Table S4 in Supporting information).
High cut-off voltage can increase the reversible capacity of the cathode materials, which is also significant in practical application. However, high voltage regions are usually accompanied with irreversible phase transformation together with drastic volume change and decomposition of electrolyte [36,37]. In addition, as most of the sodium ions are extracted from the sodium layer, electrostatic repulsive force is increased, resulting in a larger sodium layer spacing and unstable crystal structure [38,39]. Thus, we focused on the electrochemical performance in the wide voltage range. The NM electrode delivered a capacity of 175.4 mAh/g in the voltage range of 2.0–4.5 V and the profile showed a characteristic of several voltage plateaus, especially a long platform in the voltage of 4.13 V, which is matched with P3′′ phase transition (Fig. 4a) [40]. However, the platform shifts to a higher voltage and become tilted for NMMT electrode, manifesting the distinctive structure evolution process. The cyclic performance at 0.1 C for 100 cycles is displayed in Fig. S4 (Supporting information). The discharge capacity of NM electrode declined sharply in the first five cycles, which is mainly due to the irreversible structure evolution or degradation between 4.0 V and 4.5 V. After 100 cycles, the NMMT electrode maintained a discharge capacity of 86.6 mAh/g, much higher than 56.5 mAh/g of NM sample, although NM electrode has a higher initial capacity (175.4 mAh/g) compared to the NMMT electrode (160.1 mAh/g). It indicated that the Mg/Ti co-doping can effectively reinforce framework in the high voltage region. Furthermore, galvanostatic intermittent titration technique (GITT) was employed to evaluate corresponding Na+ diffusion coefficients in the voltage of 2.0–4.5 V. The GITT profiles and diffusion coefficients (DNa) are shown in Figs. 4b and c for NMMT and NM electrodes, respectively. The DNa for NMMT electrodes was about 10−11–10−10 cm2/s in the voltage range of 2.0−4.5 V (Fig. 4b). However, the DNa for NM electrode decreased obviously to 10−12–10−14 cm2/s in the high voltage region of 4.0–4.5 V, demonstrating a very slow Na+ transfer. The low Na+ diffusion coefficients may be relevant to the irreversible phase transition or highly faulted layer structure. Thus, the NMMT electrode delivers an outstanding cyclic performance and faster Na+ transfer even in the high voltage range.
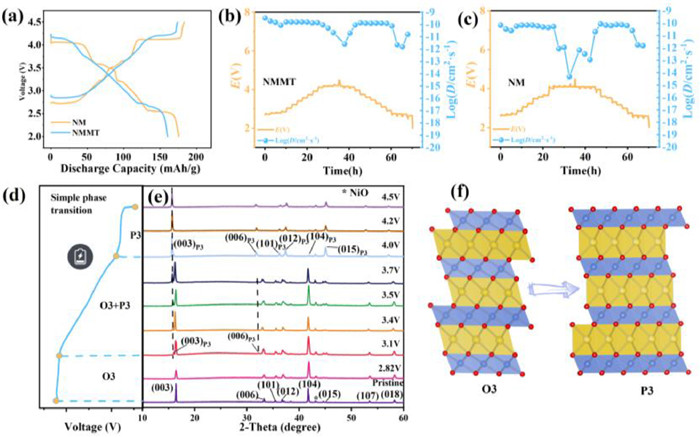
To further uncover the mechanism for improved electrochemical performance after Mg/Ti co-doping, the ex-situ XRD characterization was performed. The results and the first charge curves in the voltage range of 2.0–4.5 V are collected (Figs. 4d and e, Fig. S5 in Supporting information). For NMMT sample, when voltage of charge was to 2.82 V, the diffraction pattern is almost the same with pristine sample, indicating excellent structural stability. With further charge (3.1 V), the new peaks at 16.0° and 32.2° indexed with (003)P3 and (006)P3 peaks of P3 phase [24], which demonstrates a two-phase reaction from O3 to P3 phase. This process continues until 4.0 V, and as the voltage increases, the relative intensity of peaks for P3 phase are higher, which implies the P3 phase gradually dominates. When the voltage is 4.0 V, the intensity of (104) peak visibly reduces, while the (015) peak become obvious, indicating the complete transformation to P3 phase [41,42]. It is worth mentioning P3 phase is quite stable without further phase transition until 4.5 V, which may due to the stabilizing effect on layered structure via suppressive TMO2 slab gliding from Mg/Ti co-doping. In short, structure evolution for the NMMT sample during charge process is single O3 to P3 transition [43] and structural evolution schematic for NMMT electrode is shown in Fig. 4f.
For NM electrode (Fig. S5 in Supporting information), when voltage of charge was 2.71 V, (003) peak of O3 phase located at 16.5° splits into two peaks. The new diffraction peak with high relative intensity is in the left of original peak, which is assigned to (001) peak for monoclinic O′3 phase with a distorted lattice [44]. Meanwhile, the (006)O3 peak also split the new peak (002) for O′3 phase, which indicates that the structure is easy to phase transition via slab gliding. Then, the O3, O′3 and P3 phases coexist and transform in the voltage range of 3.1–3.4 V [45,46]. Na+ ions have to consume huge energy to pass through the interface between the two phases, which is not conducive to ion transfer, thus leading to deteriorative cyclic performance [47]. Upon further charging to 3.5 V and 3.7 V, materials showed the P′3 and P3′ phase. Above 4.0 V, it transforms to O3′ phase, which is confirmed by the slight shift of the (003) peak to a higher angle and the appearance of the (104)O3′ peak [45]. Thus, the NM materials undergo the O3-O′3-P3-P′3-P3′-O3′ complex phase transition process in the voltage of 2.0–4.0 V, which is the same to the previous report [46]. When voltage of charge was 4.2 V, the diffraction peak become wide, which is labeled as P3′′ phase. The P3′′ phase has a large interslab distance and is thought to be able to highly faulted layer structure, leading a slow Na+ transfer and poor structure stability [40]. The P3′′ phase with highly faulted layer structure may be relevant to the low diffusion coefficient of Na+ and inferior capacity retention.
Obviously, the NiMn sample undergoes a complex phase transition whether in the voltage range of 2.0–4.0 V (O3-O′3-P3-P′3-P3′-O3′) or in the high voltage region of 4–4.5 V (O3′-P3′′). The multistep phase transition with distorted crystal lattice is usually accompanied with dramatic volume variation and micro-strain [48,49], leading microcracks on the particles, accounting for inferior electrochemical properties. By contrast, the NMMT sample undergoes a single O3 to P3 phase transition. It is obvious the co-doping greatly suppresses the complex multistep phase transition. Meanwhile, the enlarged slab spacing in TMO2 layer can lead a reinforced skeleton structure to tolerate micro-strain, thus resulting in superior cyclic performance.
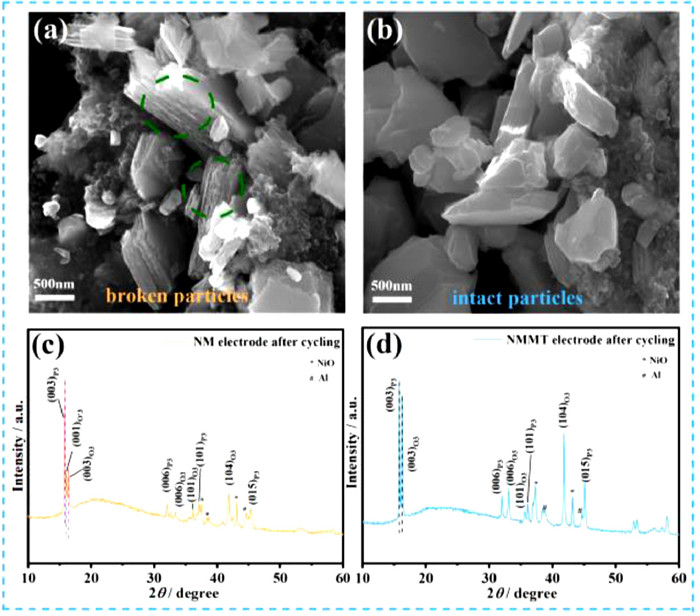
To further confirm enhancement of structure stability via Mg/Ti co-doping, the SEM images were presented in the 100th cycled cells in the voltage range of 2.0–4.5 V (Figs. 5a and b). There is many microcracks and holes on the NM particles. By contrast, NMMT electrode is almost undamaged and maintains the original morphology. The main reason is due to the complex phase transition of the NM sample during the charge and discharge process, which is accompanied by drastic volume changes, resulting in continuous shrinkage and expansion of the unit cell, and the accumulation of micro-strain ultimately leads to cracks on the particle [50,51]. After that, excessive cracks and holes will increase the side reactions from electrolyte, accelerating the corrosion along with dissolution of transition metal ions, ultimately leading to structural damage and deterioration of the electrochemical properties [52,53]. Furthermore, the XRD patterns are also provided in Figs. 5c and d. For NM electrode, the (003)P3 peak with high relative intensity is striking, and the low-intensity (001)O′3 and (003)O3 peaks are also observed, indicating that phase composition of NM cathode material is dominated by P3 phase. In other words, the phase transition may be highly irreversible. By contrast, the XRD pattern for NMMT electrode showed two peaks (003)O3 and (003)P3, and the (104)O3 peak for O3 phase is obvious, indicating the material maintain a O3/P3 biphase. This is good evidence that Mg/Ti co-doping can improve reversibility of structure evolution.
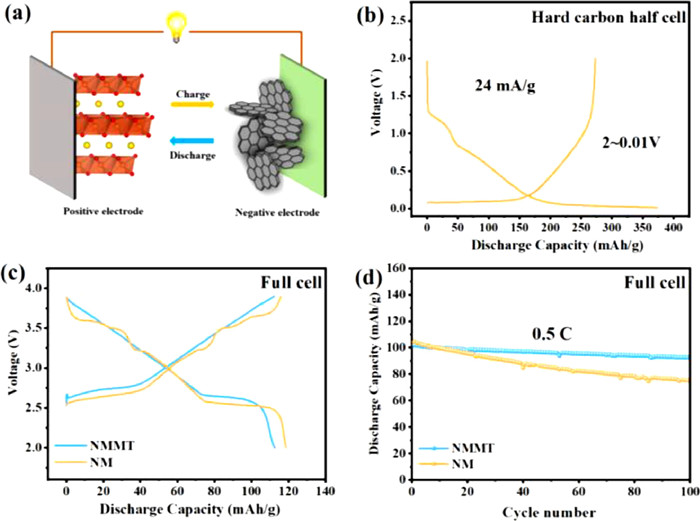
Due to the excellent structural stability of NMMT electrode, we assembled full cells to confirm the feasibility of practical application, which employed hard carbon as the anode. The schematic drawing of the full cells is shown in Fig. 6a. The hard carbon displays a reversible capacity of 273 mAh/g at 0.1 C (Fig. 6b). The full cells (NMMT/hard carbon) show a discharge capacity of 112.7 mAh/g with smooth curve within 2.0–3.9 V (118.7 mAh/g for NM) (Fig. 6c). Meanwhile, the cyclic stability is outstanding and the capacity retention is 90.8% after 100 cycles at 0.5 C (Fig. 6d), much surpassing pristine sample (71.9%), which manifests the large potential in practical applications.
In conclusion, the O3-NaNi0.5Mn0.5O2 cathode materials is successfully modified with an Mg/Ti co-doping strategy. The slab spacing in TMO2 layer is enlarged while interslab spacing in Na layer decreased, resulting in reinforced skeleton structure of layered oxides to tolerate volume changes and micro-strain, which is benefit for the structure stability and integrality. Meanwhile, the complex multistep phase transition (O3-O′3-P3-P′3-P3′-O3′-P3′′) is effectively suppressed, displaying a single phase transition (O3-P3), consequently resulting in superior cycle life. After 200 cycles (2.0–4.0 V), the NMMT sample maintains a capacity retention of 82.3%, much surpassing pristine sample (56.1%). For a wide voltage range of 2.0–4.5 V, the NMMT sample still maintains the capacity of 86.6 mAh/g (56.5 mAh/g for pristine sample) after 100 cycles. Furthermore, it is noticed that there is almost no microcracks and holes on the particles for NMMT electrode, further demonstrating reinforced framework and good structural integrity. The XRD patterns of NMMT electrodes after cycling also demonstrates that Mg/Ti co-doping enhances the reversibility of the structure evolution process. In addition, the full cells deliver a high capacity retention, presenting the potential in practical applications. Thus, it is believed that cation co-doping can effectively improve cyclic performance and structural integrity and also have positive effect on commercialization process.
The authors declare that they have no known competing financial interests or personal relationships that could have appeared to influence the work reported in this paper.
This work is supported by the National Natural Science Foundation of China (Nos. 22179077, 51774251, 21908142), Shanghai Science and Technology Commission’s “2020 Science and Technology In-novation Action Plan” (No. 20511104003), Natural Science Foundation in Shanghai (No. 21ZR1424200).
Supplementary material associated with this article can be found, in the online version, at doi:
H. Ren, Y. Li, Q. Ni, et al., Adv. Mater. 34 (2022) 2106171. doi: 10.1002/adma.202106171
Y. Liu, D. Wang, H. Li, et al., J. Mater. Chem. A 10 (2022) 3869–3888. doi: 10.1039/d1ta10329f
Q. Liu, Z. Hu, W. Li, et al., Energy Environ. Sci. 14 (2021) 158–179. doi: 10.1039/d0ee02997a
Q. Wang, S. Chu, S. Guo, Chin. Chem. Lett. 31 (2020) 2167–2176. doi: 10.1016/j.cclet.2019.12.008
R. Chen, D.S. Butenko, S. Li, et al., Chin. Chem. Lett. 35 (2024) 108358. doi: 10.1016/j.cclet.2023.108358
S. Wang, C. Sun, N. Wang, et al., J. Mater. Chem. A 7 (2019) 10138–10158. doi: 10.1039/c8ta12441h
J.Y. Hwang, S.T. Myung, Y.K. Sun, Chem. Soc. Rev. 46 (2017) 3529–3614. doi: 10.1039/C6CS00776G
B. Zhang, Y. Zhang, X. Wang, et al., J. Am. Chem. Soc. 145 (2023) 8700–8713. doi: 10.1039/d2ta09909h
Y.J. Lei, H.W. Liu, Z. Yang, et al., Adv. Funct. Mater. 33 (2022) 2212600.
S. Zhao, Q. Shi, R. Qi, et al., Electrochim. Acta 441 (2023) 141859. doi: 10.1016/j.electacta.2023.141859
P.F. Wang, H.R. Yao, X.Y. Liu, et al., Adv. Mater. 29 (2017) 1700210. doi: 10.1002/adma.201700210
H.R. Yao, P.F. Wang, Y. Gong, et al., J. Am. Chem. Soc. 139 (2017) 8440–8443. doi: 10.1021/jacs.7b05176
Q. Mao, R. Gao, Q. Li, et al., Chem. Eng. J. 382 (2020) 122978. doi: 10.1016/j.cej.2019.122978
E. de la Llave, V. Borgel, K.J. Park, et al., ACS Appl. Mater. Interfaces 8 (2016) 1867–1875. doi: 10.1021/acsami.5b09835
H. Zhang, J. Chen, Y. Hong, et al., Nano Lett. 22 (2022) 9972–9981. doi: 10.1021/acs.nanolett.2c03535
H. Zhang, J. Chen, G. Zeng, et al., Nano Lett. 23 (2023) 3565–3572. doi: 10.1021/acs.nanolett.3c00729
K. Kubota, S. Kumakura, Y. Yoda, et al., Adv. Energy Mater. 8 (2018) 1703415. doi: 10.1002/aenm.201703415
P.F. Wang, Y. You, Y.X. Yin, et al., Adv. Energy Mater. 8 (2018) 1701912. doi: 10.1002/aenm.201701912
J. Zhang, J.B. Kim, J. Zhang, et al., J. Am. Chem. Soc. 144 (2022) 7929–7938. doi: 10.1021/jacs.2c02875
M. Zarrabeitia, E. Gonzalo, M. Pasqualini, et al., J. Mater. Chem. A 7 (2019) 14169–14179. doi: 10.1039/c9ta02710f
M.H. Han, E. Gonzalo, N. Sharma, et al., Chem. Mater. 28 (2015) 106–116. doi: 10.5468/ogs.2015.58.2.106
I.M. Marku, F. Lin, K.C. Kam, J. Phys. Chem. Lett. 5 (2014) 3649–3655. doi: 10.1021/jz5017526
X. Gao, H. Liu, H. Chen, et al., Sci. Bull. 67 (2022) 1589–1602. doi: 10.1016/j.scib.2022.06.024
Y.N. Zhou, P.F. Wang, X.D. Zhang, et al., ACS Appl. Mater. Interfaces 11 (2019) 24184–24191. doi: 10.1021/acsami.9b07299
J.Q. Deng, W.B. Luo, X. Lu, et al., Adv. Energy Mater 8 (2018) 1701610. doi: 10.1002/aenm.201701610
Y. Wen, J. Fan, C. Shi, et al., Nano Energy 60 (2019) 162–170. doi: 10.1016/j.nanoen.2019.02.074
L. Zheng, M.N. Obrovac, Electrochim. Acta 233 (2017) 284–291. doi: 10.1016/j.electacta.2017.03.033
C. Zhang, R. Gao, L. Zheng, et al., ACS Appl. Mater. Interfaces 10 (2018) 10819–10827. doi: 10.1021/acsami.7b18226
J.L. Yue, Y.N. Zhou, X. Yu, et al., J. Mater. Chem. A 3 (2015) 23261–23267. doi: 10.1039/C5TA05769H
H.V. Ramasamy, K. Kaliyappan, R. Thangavel, et al., J. Mater. Chem. A 5 (2017) 8408–8415. doi: 10.1039/C6TA10334K
H. Yoshida, N. Yabuuchi, K. Kubota, et al., Chem. Commun. 50 (2014) 3677–3680. doi: 10.1039/C3CC49856E
H. Ma, H. Su, K. Amine, et al., Nano Energy 43 (2018) 1–10. doi: 10.1117/1.jrs.12.016021
H. Xu, S. Deng, G. Chen, J. Mater. Chem. A 2 (2014) 15015–15021. doi: 10.1039/C4TA01790K
T. Hwang, J.H. Lee, S.H. Choi, et al., ACS Appl. Mater. Interfaces 11 (2019) 30894–30901. doi: 10.1021/acsami.9b08987
S. Maletti, A. Sarapulova, A. Schokel, et al., ACS Appl. Mater. Interfaces 11 (2019) 33923–33930. doi: 10.1021/acsami.9b10352
H. Che, X. Yang, H. Wang, et al., J. Power Sources 407 (2018) 173–179. doi: 10.1016/j.jpowsour.2018.08.025
D.D. Yuan, Y.X. Wang, Y.L. Cao, et al., ACS Appl. Mater. Interfaces 7 (2015) 8585–8591. doi: 10.1021/acsami.5b00594
L. Mu, Q. Hou, Z. Yang, et al., J. Electrochem. Soc. 166 (2019) A251–A257. doi: 10.1149/2.0881902jes
K.W. Nam, S. Kim, E. Yang, et al., Chem. Mater. 27 (2015) 3721–3725. doi: 10.1021/acs.chemmater.5b00869
S. Komaba, N. Yabuuchi, T. Nakayama, et al., Inorg. Chem. 51 (2012) 6211–6220. doi: 10.1021/ic300357d
Y. Xiao, T. Wang, Y.F. Zhu, et al., Research 2020 (2020) 1469301.
M. Leng, J. Bi, Z. Xing, et al., Chem. Eng. J. 413 (2021) 127824. doi: 10.1016/j.cej.2020.127824
P. Vassilaras, D.H. Kwon, S.T. Dacek, et al., J. Mater. Chem. A 5 (2017) 4596–4606. doi: 10.1039/C6TA09220A
P.F. Wang, Y.J. Guo, H. Duan, et al., ACS Energy Lett. 2 (2017) 2715–2722. doi: 10.1021/acsenergylett.7b00930
T.Y. Yu, H.H. Ryu, G. Han, et al., Adv. Energy Mater. 10 (2020) 2001609. doi: 10.1002/aenm.202001609
H.H. Ryu, G. Han, T.Y. Yu, et al., J. Phys. Chem. C 125 (2021) 6593–6600. doi: 10.1021/acs.jpcc.1c00522
C.L. Zhao, Y.X. Lu, L.Q. Chen, et al., Nano Res. 12 (2019) 2018–2030. doi: 10.1007/s12274-019-2451-3
A. Mullaliu, K. Kuroki, M. Keller, et al., Inorg. Chem. 59 (2020) 7408–7414. doi: 10.1021/acs.inorgchem.9b03727
H. Wang, R. Gao, Z. Li, et al., Inorg. Chem. 57 (2018) 5249–5257. doi: 10.1021/acs.inorgchem.8b00284
K. Jiang, S. Xu, S. Guo, et al., Nano Energy 52 (2018) 88–94. doi: 10.1016/j.nanoen.2018.07.042
S. Lee, S.K. Doo, M.S. Jung, et al., J. Mater. Chem. A 9 (2021) 14074–14084. doi: 10.1039/d1ta02639a
J.Y. Hwang, S.M. Oh, S.T. Myung, et al., Nat. Commun. 6 (2015) 6865. doi: 10.1038/ncomms7865
J.Y. Hwang, S.T. Myung, J.U. Choi, et al., J. Mater. Chem. A 5 (2017) 23671. doi: 10.1039/C7TA08443A

Figure 1 XRD and Rietveld refinement patterns of (a) NM and (b) NMMT samples. (c) Schematic illustration of the crystal structure of O3-type cathode.

Figure 2 (a) SEM, (b, c) HRTEM images of the NMMT sample. (d) SAED pattern of NMMT sample. (e) Elemental mapping of NMMT sample. XPS spectra of (f) Ti and (g) Mg elements for the NMMT samples. The partial density of states (PDOS) of (h) Ni, (i) Mn, (j) Ti and (k) Mg for pristine sample and Mg/Ti co-doping sample.

Figure 3 Cyclic voltammetry curves at 0.2 mV/s of (a) NM and (b) NMMT electrodes in the voltage range of 2.0–4.0 V. The charge/discharge curves within 2.0–4.0 V for (c) NM and (d) NMMT electrodes. (e) The rate capacity of NM and NMMT electrodes. (f) Galvanostatic charge/discharge curves at 1 C showing 200 cycles for NMMT electrode. (g) Cyclic performance comparation at 1 C for 200 cycles within 2.0–4.0 V.

Figure 4 (a) Charge/discharge profiles within 2.0–4.5 V. GITT profiles and DNa for (b) NMMT and (c) NM electrode. (d) The first charge profile and (e) ex situ XRD patterns at different cut-off voltages of NMMT. (f) The structural evolution schematic for NMMT electrode.

Figure 5 The SEM images of cathode materials after cycled for 100 cycles: (a) MN and (b) MNMT. The XRD patterns of (c) NM and (d) NMMT electrodes after cycling at 0.1 C for 100 cycles in the wide voltage of 2.0–4.5 V.

 扫一扫看文章

扫一扫关注我们
 DownLoad:
 下载:
下载:
