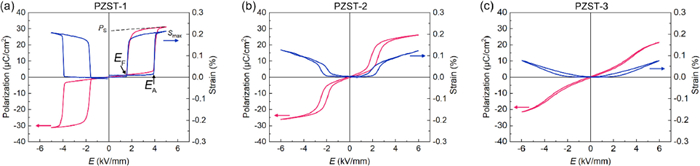
Figure 1.
P-E and S-E hysteresis loops of (a) PZST-1, (b) PZST-2, and (c) PZST-3.

A ferroelectric (FE) will retain polarization (so-called remnant polarization, Pr) after being exposed to an electric field. It needs to overcome a threshold to change the direction and magnitude of the remnant polarization and this phenomenon has been termed the hysteresis effect [1,2]. The hysteresis effect is related to the structure characteristics, such as axis ratio, symmetry, domain wall, and polarization configuration [3–5]. It is the basis for the use of FEs in memory devices [6]. Numerous studies revealing the structure-hysteresis correlation favor the design of high-performance FEs.
Antiferroelectrics (AFEs) featuring as a reversible switching between AFE and FE state induced by the electric field, manifests a double hysteresis loop. The hysteresis effect also occurs during unloading the electric field. Previous studies have shown that the hysteresis effect can be tuned by changing the chemical composition. For example, in Nb-doped Pb(Zr, Sn, Ti)O3 AFEs, a large hysteresis was observed [7], while in some La-doped Pb(Zr, Sn, Ti)O3 AFEs, the hysteresis can be reduced to a very low level [8]. This tunable hysteresis effect is significant for application, especially for energy storage materials. Reducing the hysteresis effect is the key to promote the energy storage efficiency and minimizing the energy dissipation [9–15]. However, the structure mechanism related to the hysteresis effect in AFEs remains unclear.
For AFEs, the macroscopic performance is typically determined by the underlying polarization structure. Revealing the polarization configuration often depends on the determination of refined crystal structures. However, this is difficult for AFEs due to the complex incommensurate modulated structure [16–22], and thus hindered the understanding of structure-property correlation for a long time. Recently, with the help of the advanced technology, including HAADF-STEM, synchrotron radiation, neutron diffraction, etc. [20,22,23], the nonlinear dipole configuration was uncovered in lead-based AFEs. These results provide an opportunity to elucidate the structural mechanism of the hysteresis effect in AFEs.
In this work, three AFEs with different hysteresis were selected to study the correlation between the hysteresis and the dipole configuration by using in situ synchrotron radiation technology. It is interesting to find that the electric field-induced polarization jump associated with the phase transition results in a large hysteresis, while a continuous polarization rotation lead to a small hysteresis. In the AFEs with small hysteresis, both the lattice parameters and the domain switching are small. These results provide a profound understanding of the hysteresis effect in AFEs and will be helpful in the design of high-performance ceramics.
Three AFE ceramics, Pb0.99Nb0.02[(Zr0.53Sn0.47)0.937Ti0.063]0.98O3, Pb0.925La0.04Zr0.42Sn0.40Ti0.18O3, and Pb0.91La0.06Zr0.42Sn0.40Ti0.18O3, with different hysteresis effect were fabricated using the conventional solid-state reaction method. Details of the synthesis can be found in Supporting information or other literatures [7,8]. For convenience, they were marked as PZST-1, PZST-2, and PZST-3, respectively. The evolution of the electric polarization and strain at room temperature (so-called P-E and S-E hysteresis loops) are shown in Fig. 1, in which, the macroscopic properties are consistent with the result reported by other researchers [7,8]. They all exhibit the typical double hysteresis loops characteristic of antiferroelectric materials. In sample PZST-1, double square loops with large hysteresis were observed. In comparison, the hysteresis loops of PZST-2 and PZST-3 are relatively slim. In particular, for sample PZST-3, the hysteresis loop is almost closed. This means that PZST-3 is more suitable for energy storage materials than PZST-1 or PZST-2 due to its high energy storage efficiency. Studying the differences between these three AFEs will help to reveal the structural mechanisms of high energy storage materials.
The intercept of the reverse extension line of the linear portion of the P-E curves is defined as saturated polarization (Ps, Fig. 1a). The Ps of these three compositions are 31.1, 26.1 and 21.5 µC/cm2, respectively and the maximum strain (Smax, Fig. 1a) are 0.21%, 0.12% and 0.076%, respectively (Fig. S1 in Supporting information). The Ps and Smax appear to follow the same trend, i.e., the AFE with large Ps tends to have large Smax. This suggests the underlying coupling between the electric field-induced polarization and strain.
For an AFE material, the ground state is the AFE state and it can be induced to the FE state under a high electric field [24]. As shown in Fig. 1a, the critical electric field from the AFE state is defined as EA and the backward switching field is defined as EF. As shown in Fig. 2a, the EA of PZST-1 is larger than that of PZST-2 and PZST-3, while the EF of PZST-1 is smaller than that of PZST-2 and PZST-3. To compare the hysteresis effect of different compositions, the hysteresis is calculated using Eq. 1:
|
|
(1) |
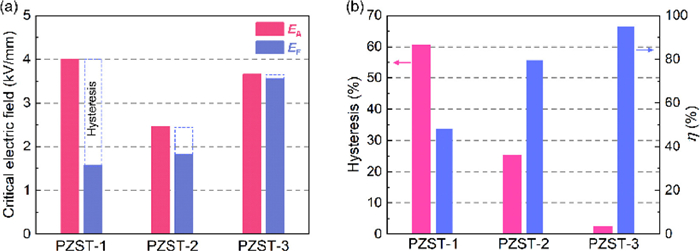
The hysteresis of the different compositions is shown in Fig. 2b. As expected, the hysteresis of PZST-1 can reach up to 60.5%, while the hysteresis of PZST-2 and PZST-3 is only 25.4% and 2.5%, respectively. These features have an important influence on the energy storage performance. The method of energy storage calculation can be found in other literature [25]. The energy storage efficiency of PZST-1 is only 48.1%, which is lower than that of PZST-2 (~79.5%) and PZST-3 (~95%), so reducing the hysteresis is helpful to improve the energy storage efficiency (Fig. 2b). In order to reveal the structure-hysteresis correlation, deep structure analysis is required in this work.
High-energy in situ synchrotron radiation X-ray diffraction experiment was adopted to investigate the structural evolution process under the electric field in this work. The experimental setup can be found in other literature [26]. The diffraction data at 45° sectors present negligible texture effects [27], which allows extracting structure information related to the hysteresis. In contrast, the diffraction patterns at the 0° sectors contain strong texture effects and are therefore suitable for domain switching analysis [28,29]. As shown in Figs. 3a-c, the splitting {200}P diffraction peaks of the different compositions all show a clear orthorhombic phase feature at 0 electric field. In particular, PZST-1 shows a clear orthorhombic feature at 0 electric field, but at high-electric field, the splitting {200}P peaks change to a single peak, indicating that it has transformed into a rhombohedral phase [24,30]. In contrast, the electrically induced phase transition is less evident in PZST-2 and PZST-3.
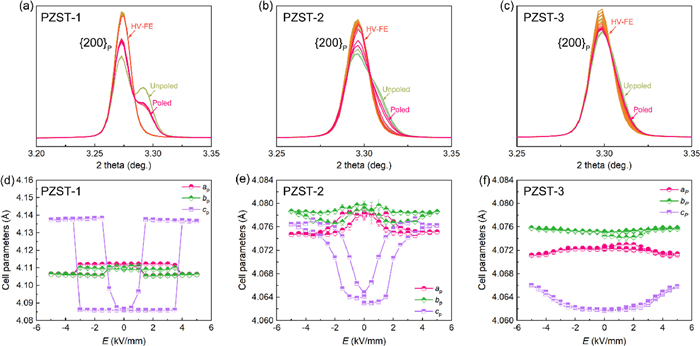
Based on this, a full profile Rietveld refinement was performed on the 45° sector data (the represent patterns can be found in Figs. S2-S4 in Supporting information). For PZST-1, an orthorhombic model was used at the low electric field (<EA) and a rhombohedral model at the high electric field (>EA), but for PZST-2 and PZST-3 a single orthorhombic model was used for all electric fields, and this strategy gave reasonable results in previous experiments [31]. Figs. 3d-f illustrate the perovskite cell parameters evolution obtained from the structure refinement. The evolution of the cell parameters, especially the cP, shows the same shape as the S-E loops in Fig. 1. For example, the cP evolution of PZST-1 shows a square shape similar to the hysteresis loop. Similarly, as for PZST-2 and PZST-3, the shape of their cP-E curves all show a similar shape to the S-E loop, even the trend of the hysteresis effect is consistent with the trend of the macroscopic properties. This phenomenon indicates that our selected models are reasonable. Interestingly, all three AFEs show similar characteristics of cell parameter evolution with the change of the electric field, of which only the cP axis shows obvious positive strain while aP axis and bP axis show almost zero or negative strain. This represents the unity of the AFEs on the microstructural response to the electric field, of which under the electric field, a compressive strain is generated in the aP-bP plane, while an expansive strain is generated out of the aP-bP plane. As expected, the strain of the cP (Fig. 3) and the volume (Fig. S5 in Supporting information) show the same trend as the macroscopic strain (Fig. S1), PZST-1 > PZST-2 > PZST-3. Apparently, the AFEs with a large hysteresis effect tend to have a large lattice strain.
To quantify the domain switching contribution during loading the electric field, the lattice strain ε{110} was calculated using Eq. 2 on 0° sector data.
|
|
(2) |
where dE and d0 are the interplanar spacing of {110}P peaks under the applied electric field and the ground state, respectively. As shown in Fig. S6 (Supporting information), it is interesting to observe that the maximum ε value of PZST-1 is larger than that of PZST-2 and PZST-3, and this trend is consistent with the macroscopic strain. These results suggest that the macroscopic strain is the result of the coupling between domain switching and the lattice expansion, and that large lattice strains and domain switching lead to a relatively large hysteresis effect.
It is well known that the perovskite axis ratio of AFEs is usually smaller than that of FEs. The perovskite axis ratio of the three AFEs shows different characteristics during the applied electric field. As shown in Fig. 3, at 0 electric field, the cP is smaller than aP or bP in all three compositions while at the high electric field (FE state), the value of cP of PZST-1 is larger than aP or bP, which is different from that of PZST-2 and PZST-3 (Fig. S4). It indicates that the axis ratio in the FE state of PZST-1 is greater than 1, but that of the other two compositions is not (Fig. S7 in Supporting information). At 0 kV/mm, the axis ratio of PZST-3 is the largest one (close to 1) among the three compositions, and the change in the axis ratio of PZST-3 induced by the electric field is the smallest one (Fig. S7). Therefore, it indicates that an axis ratio close to 1 on the ground and a small induced axis ratio change under the electric field could lead to a small hysteresis effect.
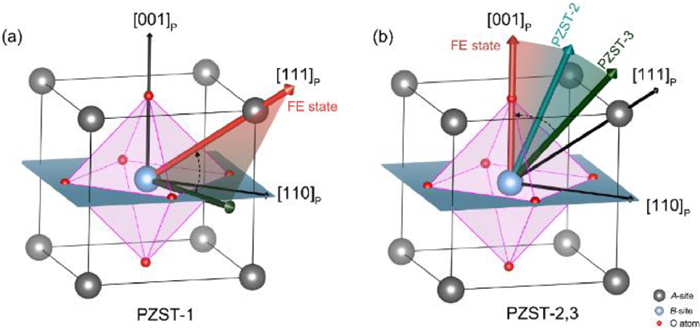
It is well known that the macroscopic polarization is governed by the microscopic polarization. As reported in other literature [32], the PZST-1 is an incommensurate AFE. Obtained by the structure refinement, the microscopic average polarization lies in the aP-bP plane but not strictly along the [110]P direction. As shown in Fig. 4a, under the electric field, the dipole jump rotates towards the [111]P direction. In comparison, as shown in Fig. S8 (Supporting information) and Fig. 4b, the dipoles of PZST-2 and PZST-3 are distributed between the [111]P and the [001]P directions, and under the electric field, the dipoles continuously rotate from the initial state to the [001]P direction (the calculation details can be found in other literature [32]). Therefore, the continuous rotation will lead to a smaller hysteresis than the jump rotation. Furthermore, the rotation angle order of these three compositions is PZST-1 > PZST-3 > PZST-2, which is consistent with the order of the critical electric field (EA, Fig. 2a), indicating that the rotation angle is the determining factor of the critical field [30].
Based on the above results, different AFEs can be well unified through the cell parameter evolution, domain switching, axis ratio change, and polarization rotation study. More importantly, by comparing the AFEs with different hysteresis effects, one can find the structural mechanism related to the hysteresis effect, of which an AFE with a canting dipole configuration tends to have: (1) negligible phase transition; (2) small cell parameter change and domain switching; (3) continues polarization rotation under the electric field, and these features together result in a smaller hysteresis effect. This is of great significance in reducing the energy loss of energy storage materials and it will guide the design of high performance AFEs.
In summary, couples of AFEs with different hysteresis effects have been studied using the in situ electric field experiment. Several conclusions can be drawn from the structural analysis: The dipole configuration plays an important role in influencing the hysteresis effect. An AFE with a canting dipole configuration tends to have a smaller hysteresis effect. This type of AFE presents a continuous polarization rotation and exhibits a negligible phase transition under the electric field. Through the in situ data analysis, it can be found that an AFE with a small hysteresis effect tends to have small cell parameter changes and domain switching during electric field loading, and its axis ratio is close to 1 at the ground state and undergoes a small change under the electric field. These results have revealed the structural mechanism of the hysteresis effect of lead-based AFEs for the first time, and this study will be beneficial for the design of high-performance materials.
The authors declare that they have no known competing financial interests or personal relationships that could have appeared to influence the work reported in this paper.
This work was supported by the National Natural Science Foundation of China (Nos. 22235002, 21825102 and 12004032). The high-resolution neutron diffraction was collected by Dr. Chin-Wei Wang at the National Synchrotron Radiation Research Center. The use of the Advanced Photon Source at Argonne National Laboratory was supported by the U. S. Department of Energy, Office of Science, Office of Basic Energy Sciences, under Contract No. DEAC02–06CH11357. We thank Dr. Yang Ren in the help of the data collection in the in situ experiments.
Supplementary material associated with this article can be found, in the online version, at doi:
O. Boser, J. Appl. Phys. 62 (1987) 1344–1348. doi: 10.1063/1.339636
R.C. Smith, S. Seelecke, Z. Ounaies, et al., J. Intell. Mater. Syst. Struct. 14 (2003) 719–739. doi: 10.1177/1045389X03038841
S. Kalinin, B. Rodriguez, S. Jesse, et al., Proc. Natl. Acad. Sci. U. S. A. 104 (2007) 20204–20209. doi: 10.1073/pnas.0709316104
S. Choudhury, Y. Li, C. Krill Iii, et al., Acta Mater. 55 (2007) 1415–1426. doi: 10.1016/j.actamat.2006.09.048
V. Bhide, K. Deshmukh, M. Hegde, Physica 28 (1962) 871–876. doi: 10.1016/0031-8914(62)90075-7
S.Y. Wu, IEEE Trans. Electron Devices 21 (1974) 499–504. doi: 10.1109/T-ED.1974.17955
J. Frederick, X. Tan, W. Jo, J. Am. Ceram. Soc. 94 (2011) 1149–1155. doi: 10.1111/j.1551-2916.2010.04194.x
X. Chen, X. Dong, G. Wang, et al., J. Am. Ceram. Soc. 101 (2018) 3979–3988. doi: 10.1111/jace.15503
D. Viehland, D. Forst, Z. Xu, et al., J. Am. Ceram. Soc. 78 (1995) 2101–2112. doi: 10.1111/j.1151-2916.1995.tb08622.x
Z. Dai, Z. Xu, X. Yao, Appl. Phys. Lett. 92 (2008) 072904. doi: 10.1063/1.2883972
P. Yang, D.A. Payne, J. Appl. Phys. 71 (1992) 1361–1367. doi: 10.1063/1.351254
H. He, X. Tan, J. Phys. Condens. Matter. 19 (2007) 136003. doi: 10.1088/0953-8984/19/13/136003
B.P. Pokharel, D. Pandey, J. Appl. Phys. 88 (2000) 5364–5373. doi: 10.1063/1.1317241
P. Mohapatra, Z. Fan, J. Cui, et al., J. Eur. Ceram. Soc. 39 (2019) 4735–4742. doi: 10.1016/j.jeurceramsoc.2019.07.050
F. Zhuo, H. Qiao, J. Zhu, et al., Chin. Chem. Lett. 32 (2021) 2097–2107. doi: 10.1016/j.cclet.2020.11.070
D. Viehland, D. Forst, J.F. Li, J. Appl. Phys. 75 (1994) 4137–4143. doi: 10.1063/1.355995
Y. Cai, F. Phillipp, A. Zimmermann, et al., Acta Mater. 51 (2003) 6429–6436. doi: 10.1016/j.actamat.2003.08.012
J. Knudsen, D.I. Woodward, I.M. Reaney, J. Mater. Res. 18 (2003) 262–271. doi: 10.1557/JMR.2003.0037
H. He, X. Tan, Phys. Rev. B 72 (2005) 024102.
I. MacLaren, R. Villaurrutia, A. Peláiz-Barranco, J. Appl. Phys. 108 (2010) 034109. doi: 10.1063/1.3460106
T. Hu, Z. Fu, X. Chen, et al., Ceram. Int. 46 (2020) 22575–22580. doi: 10.1016/j.ceramint.2020.06.018
T. Ma, Z. Fan, B. Xu, et al., Phys. Rev. Lett. 123 (2019) 217602. doi: 10.1103/PhysRevLett.123.217602
H. Liu, Z. Zhou, Y. Qiu, et al., Mater. Horiz. 7 (2020) 1912–1918. doi: 10.1039/D0MH00253D
X. Hao, J. Zhai, L.B. Kong, et al., Prog. Mater. Sci. 63 (2014) 1–57. doi: 10.1016/j.pmatsci.2014.01.002
G. Wang, Z. Lu, Y. Li, et al., Chem. Rev. 121 (2021) 6124–6172. doi: 10.1021/acs.chemrev.0c01264
L. Fan, J. Chen, Y. Ren, et al., Inorg. Chem. 57 (2018) 3002–3007. doi: 10.1021/acs.inorgchem.7b02329
M. Hinterstein, J. Rouquette, J. Haines, et al., Phys. Rev. Lett. 107 (2011) 077602. doi: 10.1103/PhysRevLett.107.077602
Y. Li, Y. Chen, Z. Zhang, et al., Acta Mater. 168 (2019) 411–425. doi: 10.1016/j.actamat.2019.02.026
M. Hinterstein, M. Hoelzel, J. Rouquette, et al., Acta Mater. 94 (2015) 319–327. doi: 10.1016/j.actamat.2015.04.017
B. Gao, W. Zhou, H. Liu, et al., Nano Lett. 23 (3) (2023) 948–953. doi: 10.1021/acs.nanolett.2c04361
B. Gao, H. Liu, Z. Zhou, et al., Microstructures 2 (2022) 2022010. doi: 10.20517/microstructures.2022.03
B. Gao, H. Liu, Z. Zhou, et al., Inorg. Chem. 60 (2021) 3232–3237. doi: 10.1021/acs.inorgchem.0c03533

Figure 2 (a) The critical electric field of different compositions. (b) The hysteresis effect and efficiency of different compositions.

Figure 3 (a-c) The evolution of diffraction peaks of {200}P at the 45° sector as a function of electric field corresponding to different compositions (HV means high voltage). (d-f) The cell parameters as a function of the bipolar electric fields of different compositions.

 扫一扫看文章

扫一扫关注我们
 DownLoad:

 下载:
下载:

 下载:
下载: