Citation:
Pei Zhang, Bo Shen, Xu Li, Zhou Nie, Kun Li. Hot hole multiplication from silver plasmon-resonated gold interband transitions for enhanced photoelectrochemical sensing[J]. Chinese Chemical Letters,
2023, 34(12): 108588.
doi:
10.1016/j.cclet.2023.108588
Hot hole multiplication from silver plasmon-resonated gold interband transitions for enhanced photoelectrochemical sensing
English
Hot hole multiplication from silver plasmon-resonated gold interband transitions for enhanced photoelectrochemical sensing
State Key Laboratory of Chemo/Biosensing and Chemometrics, Hunan Provincial Key Laboratory of Biomacromolecular Chemical Biology, College of Chemistry and Chemical Engineering, Hunan University, Changsha 410082, China
* Corresponding author. E-mail address: kunli@hnu.edu.cn (K. Li).
Received Date:
09 March 2023 Accepted Date:
17 May 2023 Revised Date:
15 May 2023 Available Online:
15 December 2023
Abstract:
Compared with the widespread exploitation of hot electrons in plasmonic nanoparticles (NPs), hot holes generated from plasmonic metal interband transitions, are often overlooked in photoelectrochemistry, including photoelectrochemical sensing. Motivated by the subtle spectral overlap between the characteristic plasmonic bands of Ag NPs and interband transitions of Au, herein, we construct unusual core-shell Ag@Au NPs via an anti-galvanic reaction to promote the generation of hot holes. Benefiting from the unique plasmon resonances of Ag cores in specific wavelength regimes, Ag@Au can excite multiplied hot holes while Au cannot under the same conditions. With satisfactory accuracy and good practicability, the photoelectrochemical sensing platform based on Ag@Au NPs possesses a detection limit of 77 nmol/L for glucose, exhibiting significantly higher sensitivity compared to that using Au NPs. This work exemplifies the applications of interband hot-hole accumulation initiated by plasmons and may inspire more strategies to explore the utilization of hot holes in photoelectrochemistry.
Photoelectrochemical (PEC) sensing is a rapidly developing analytical method that benefits from its advantages such as the negligible background signal, ease of miniaturization, and low cost [1,2]. In this strategy, photo-sensitive materials including semiconductors and precious metals are indispensable to initiate the transformations of photoelectronic energy toward chemical energy. Localized surface plasmon resonances (LSPR) occur via the confinement of the collective vibration of free electrons in plasmonic metals (e.g., Au and Ag) and the electromagnetic field of the incident light, contributing to many tremendous advances in nanoscience [3-8]. After the light absorption into plasmonic metals, plasmons decay by transferring the energy towards electrons in the nanostructures, which induces the excitation of high energetic charge carriers, i.e., hot electrons and hot holes [9-11]. Although plasmon-excited hot carriers may dissipate their energy via nonphotochemical pathways such as carrier relaxation, electron-hole recombination, and electron-phonon coupling, which result in that most incident photon energy cannot be harvested, plasmon-mediated photochemical transformations are continuously studied in the last decade [12-14]. There have been numerous reports about promoting catalytic reactions by hot electrons above the Fermi level of plasmonic nanoparticles (NPs) [15,16], and a few empirical studies on Au NPs evidenced that the photo-generated hot holes play a role in assisting plasmonic catalysis [17,18]. Generally, in nanoplasmonic chemistry, most studies focus on the essential performance of hot electrons; however, improvements in the utilization of hot holes have received limited attention.
The generation of hot carriers in plasmonic nanostructures can occur either through intraband electron transitions within the conduction band (from the occupied sp-band to the empty sp-band) or through interband excitations of electrons (caused by transitions from other bands to the unoccupied conduction band states, i.e., d-band to the empty sp-band) [19,20]. Of note, the intrinsic excitation from d-sp interband transitions dominates the optical absorption of plasmonic metals within the shorter wavelength regime [21]. Compared with the plasmon-generated hot carriers, the carriers excited by d-sp interband transitions have a much larger population and longer relaxation time [22], which facilitate their participation in photochemical reactions with matched energy levels. Harnessing the energy from interband excitations of plasmonic nanostructures is an emerging research area for energy chemistry, in which the results show that these carriers can greatly increase the efficiency of photocatalysis as the direct hot-hole reaction system is Schottky-junction-free [23-26]. However, attention is seldom focused on electrochemical reactions with interband-excited hot charge carriers within plasmonic metals. Thus, we are motivated to explore the merit of interband hot holes for PEC processes.
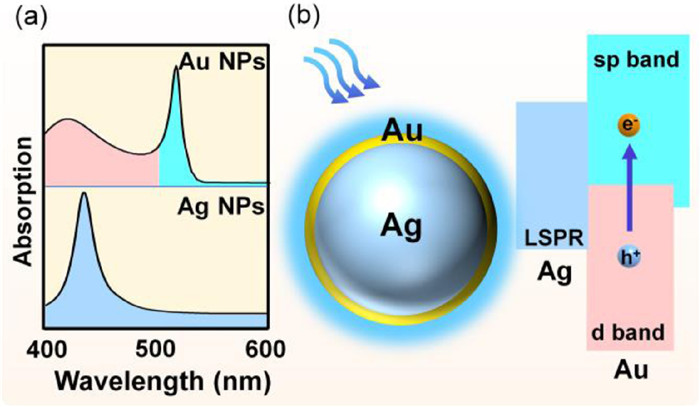
Moreover, plasmons have not been employed to enhance the interband-excited hot-hole-mediated electrochemical reactions. For spherical NPs, the LSPR peak of Au is around 530 nm, while the plasmon resonances in Ag generally occur in the regime from 400 to 440 nm (Scheme 1a). However, the interband transition energy level is about 2.4 eV (i.e., ~516 nm) and 3.8 eV (i.e., ~325 nm) for Au and Ag, respectively [27]. It is noted that the interband absorbance in Au is quite low, indicating an ineffective hot-hole generation. Interestingly, the d-sp interband excitation in Au is partly located in the visible-light regime, which has an excellent spectral overlap with the LSPR of Ag NPs. Thus, we are inspired to design unusual Ag@Au core-shell nanostructures via an anti-galvanic replacement reaction to enhance the efficiency of the interband excitation in Au. Very recently, Au-decorated Ag NPs have admittedly been reported in surface enhanced Raman scattering (SERS) or PEC systems. However, such Ag@Au NPs are merely explored to keep the structure stable [28,29], to enhance the electrons transfer [30,31], or to change the luminescence intensity and polarization direction [32]. Notably, since the superiority of hot holes is neglected, the strategy of improving the interband hot holes in Au by the LSPR of Ag has not been developed.
Scheme 1
Scheme 1.
Illustration of the absorbance spectra of Au and Ag. (a) Upper: Localized surface plasmon resonances (LSPR) peak of Au nanoparticles (NPs) is around 530 nm. The intraband and the interband transition regimes are shown in cyan and pink (wavelength longer or shorter than 516 nm), respectively. Lower: The LSPR peak of Ag NPs locates in the range of 400–500 nm, which is governed by the intraband transition (blue regime). (b) Schematic of the interband transition of Au (d-band to sp-band) promoted by LSPR excitation of Ag.
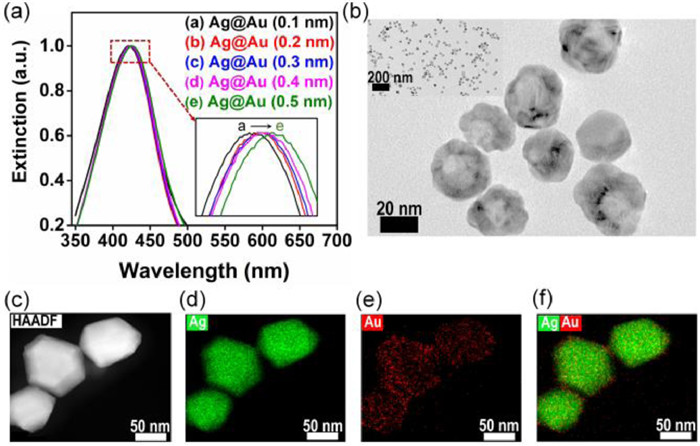
In this contribution, we demonstrate that plasmon resonances initiate the multiplication of hot holes generated on the surface of Ag@Au NPs upon the light extinction within a specific wavelength regime (Scheme 1b). Ag@Au NPs produce more interband hot holes than Au NPs do. To actualize this design, the Ag NP cores used as templates during the synthesis were prepared with the conventional seed-growth strategy. In brief, Ag seeds were first synthesized via the reduction of Ag+ precursor in the presence of tannic acid (TA) and sodium citrate (SC). Consequently, Ag NP cores with diameters of approximately 30 nm were synthesized through secondary growth. TEM image indicates a diameter of ~30 nm and a smooth particle surface (Fig. S1a in Supporting information). After that, Au precursors containing Au3+ were reduced by formaldehyde (HCHO) and continuously deposited onto the surface of Ag cores as an Au shell, benefiting from the moderate reducing ability of HCHO in the precursor solution. Moreover, as a simple organic molecular, the oxidation of HCHO does not introduce surfactants or ligands on the NPs. The generation and accumulation of Au0 contribute to the rapid growth of Au shell, resulting in Ag@Au core-shell hybrid nanostructures [33,34]. To achieve this, different amounts of Au precursor and reductant were added to the Ag NPs solution together, followed by a quick and vigorous stirring. The UV–vis spectrum recording the characteristic plasmon peak of Ag NPs undergoes a slight red shift (from 421 nm to 426 nm) with increasing Au-shell thickness, which is calculated to be around 0.1–0.5 nm with the amount of Au precursor rises (Fig. 1a). The detailed calculation is described in Section 2.1 in Supporting information. This result is consistent with the simulated absorbance spectra from the Finite-difference-time-domain (FDTD) calculation (Fig. S1b in Supporting information). The dipole-dipole coupling effect results in slightly red-shifted and broader peaks. These experimental and simulated steady absorption spectra prove the presence of Ag@Au core-shell structure. The thinnest Ag@Au structure with 0.1 nm thickness hardly exhibits an apparent plasmon response, which is attributed to the immature formation stage of Ag@Au hybrid nanostructures. X-ray photoelectron spectroscopy (XPS) was used to examine the oxidation state for Au and Ag, which further confirms the formation of the core-shell structure (Fig. S2 in Supporting information). In fact, Ag exhibits the characteristic 3d5/2 and 3d3/2 XPS peaks at 368.4 eV and 374.4 eV, respectively. Meanwhile, the XPS peaks at 84.30 eV and 88.03 eV correspond to the 4f7/2 and 4f5/2 peaks of metallic Au. These results indicate that in this core-shell structure the Au and Ag are only in the zero-valent state [35]. We, therefore, conclude that Ag NPs are partially coated with an uneven layer of ultra-small Au nanodots.
Figure 1
Figure 1.
Characterizations of the synthesized core-shell Ag@Au NPs. (a) UV–vis spectra for Ag@Au NPs comprised of 30 nm Ag core and Au shell with different thicknesses. (b) Representative TEM images of the prepared Ag@Au NPs. (c) Low-magnification HAADF-STEM image and the corresponding EDS mapping images related to the elements Ag (d), Au (e), and the overlap of Ag and Au (f).
To further verify the formation of the proposed structure, transmission electron microscopy (TEM) images were captured. Fig. 1b shows that uniform Ag@Au core-shell NPs were seen on large scale. The contrast of particles in the image indicates that a roughness layer of Au has been formed out of Ag NPs. Moreover, the absence of voids in the Ag-core suggests that the galvanic replacement or ligand-assisted oxidative etching did not occur. Insert in Fig. 1b shows these NPs have a uniform size and no aggregation happened during the synthesis process. In addition, to investigate the distribution of Ag and Au elements within the core-shell nanostructures, the high-angle dark-field scanning transmission electron microscopy (HAADF-STEM) was further conducted with the energy dispersive spectroscopy (EDS) elemental mapping (Figs. 1c-f). The HADDF-STEM image of an individual particle displays a gray zone in the center enclosed by a much brighter zone on the edge, which can be attributed to the Ag core and the Au shell, respectively. EDS mapping reveals that the characteristic X-ray signal of Ag comes exclusively from the core of the Ag@Au NP, and the signal of Au is mainly ascribed to the shell. Therefore, unlike the galvanic replacement that usually involves yielding Ag/Au alloy nanocrystals, the etching-free synthesis developed in this work gives rise to the coating of monometallic Au on the Ag NPs.
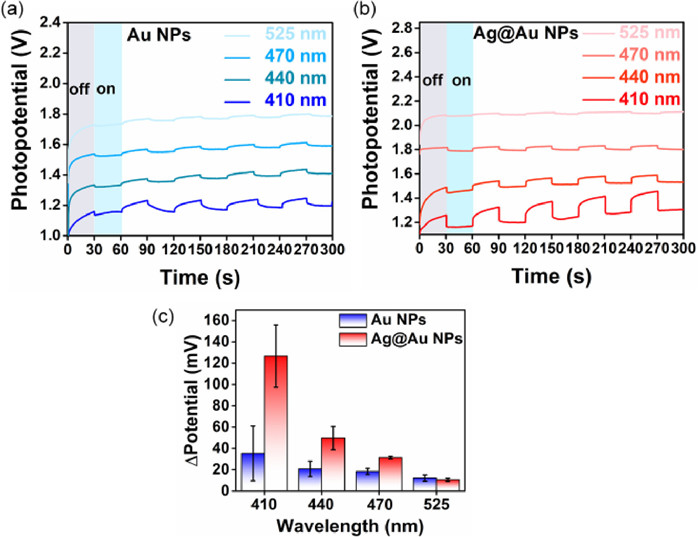
To investigate the PEC performance of the synthesized Ag@Au NPs, they were deposited onto Indium tin oxide (ITO) electrodes and irradiated in electrolyte under the light of different wavelengths with identical intensity. Au NPs with a diameter of around 30 nm, which can be treated as Au@Au NPs, were used for comparison to investigate the critical role of the Ag core. Figs. 2a and b show the cell potential at the current of 5 µA as a function of time in citrate solution. Plasmonic NPs decay nonradiatively into hot electron-hole pairs. Holes with energy greater than the oxidation potential of citrate may be injected into adsorbed citrate ions at the particle surface, yielding 1,3-acetonedicarbosylate via a photo Kolbe reaction [36,37]. The photogenerated hot electrons accumulate as excess charge at the interfacial double layer and increase the Fermi level of the electrode. Under light excitation in the presence of sodium citrate in the electrolyte, the potential shifts to the negative direction. This shift indicates the generation of a negative potential by photoinduced citrate oxidation on the NPs. Here, light irradiation at the NPs with different wavelengths (410, 440, 470 and 525 nm) could always result in a decrease in the photopotential.
Figure 2
Figure 2.
Comparison of the photoelectrochemical (PEC) characterization between Au and Ag@Au NPs under different wavelengths with the same light intensity. Plasmon excitation-induced potential shifts on the electrode consisting of Au NPs (a) and Ag@Au NPs (b) supported on an indium tin oxide (ITO) substrate, respectively. The electrode was immersed in 0.5 mol/L potassium nitrate and 5 mmol/L sodium citrate, followed by the irradiation of 410, 440, 470 and 525 nm light with an intensity of 200 mW/cm2. (c) Histogram comparison for the difference of photopotential between Au and Ag@Au NPs.
Moreover, both Au and Ag@Au NPs perform more decreased photopotential under shorter wavelengths. This result indicates that interband transition produces more population of hot carriers than intraband transition does. The 410 nm light, which possesses higher energy, can excite the interband transition of Au. In this case, both Ag@Au and Au NPs produce the changed photopotential, which is calculated to be 126.8 mV and 35.4 mV relative to that in the dark condition, respectively (Fig. 2c). It is noted that the photopotential reduction of Ag@Au is approximately 3.58 times of that for Au NPs. This phenomenon confirms that under the light exciting interband transitions, Ag@Au NPs are able to produce more hot holes, which outperform Au NPs. As the wavelength of light source goes longer, the potential continuously decreased. At 440 nm and 470 nm, the photopotential variation for Ag@Au is about 50.19 mV and 31.49 mV relative to that of dark reaction, respectively, which are 2.45 times and 1.68 times larger than that for Au NPs under the same condition. It should be pointed out that when the spectrum of incident light overlaps the LSPR of Au NPs (i.e., 525 nm light is used), Au NPs generate a photopotential reduction of 11.9 mV, which is slightly higher than 10.76 mV corresponding to Ag@Au. This is ascribed to the light excited intraband transition of Au NPs. The result substantiates that when the incident light locates out of the interband regime of Au, the hot hole multiplication in Ag@Au NPs would not occur. As the LSPR of Ag is around 400–440 nm, it effectively overlaps and couples with the interband transition of Au. Accordingly, the Ag core effectively promotes the generation of more interband hot holes in the Au shell by the plasmon resonance of Ag in the wavelength regime of the characteristic Ag LSPR band.
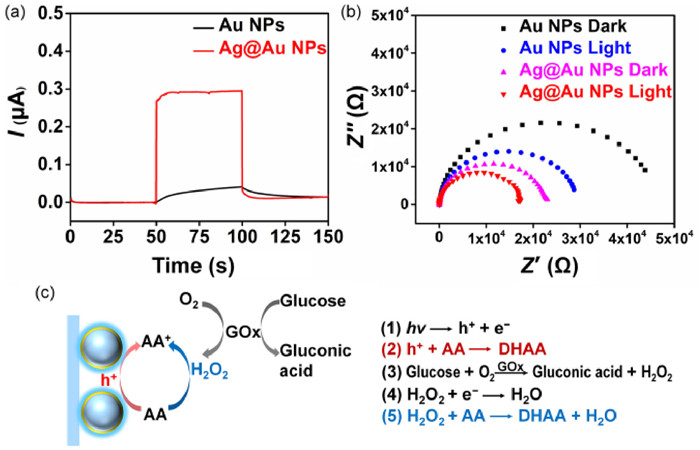
As a concept of application of the plasmon-resonated hot hole multiplication in Ag@Au, a PEC biosensing platform is designed with the aid of electron donor ascorbic acid (AA). To figure out the roles of AA, the analysis of photoelectronic response in the presence of AA was given. The photoelectronic responses of Au NPs (black) and Ag@Au NPs (red) are plotted in Fig. 3a. The results verify that Ag@Au NPs can obviously improve the photocurrent, which is approximately 10 times larger than that of Au NPs. It is suggested that AA can be used as an electron donor to reduce the photogenerated holes, which could block the recombination of photogenerated holes and electrons. Electrochemical impedance spectroscopy (EIS) was employed to investigate the mechanism of charge transfer in photoelectrode. EIS of Ag@Au and Au NPs under dark and light are shown in Fig. 3b. Charge transfer resistance (Rct) of Au NPs is always larger than that of Ag@Au NPs either in dark or under the light, respectively. This result further confirms that Ag@Au NPs can produce more interband hot holes and accelerate the charge transfer between AA and photoelectrode.
Figure 3
Figure 3.
Photoelectronic response (a) and EIS (b) of Ag@Au compared with that of Au NPs in phosphate buffer (PB) solution containing AA under dark and light, respectively. (c) Scheme of the fabrication of photoelectrode and the design of PEC enzyme sensor based on the multiplied interband hot holes in Ag@Au.
Inspired by the rapid development of PEC enzymatic biosensors [38-40], herein, we combine the advantages of Ag@Au and enzyme sensing for enhanced hot holes generation, which provides great potential for PEC detection of glucose. Fig. 3c exemplifies the mechanism of the PEC biosensors. The details of the fabrication process of the photoelectrode are presented in the experimental section of Supporting information. As mentioned above, because Ag@Au generates more interband hot holes under 410 nm light irradiation (Eq. 1 in Fig. 3c), the density of hot carriers on the photoelectrode increases, and the lifetime of hot carriers is lengthened. Then, AA was added into the solution as an electron donor. AA could deplete the photogenerated hot holes due to the matched energy band, which hinders the recombination of photogenerated electron/hole pairs and stabilizes the photoelectronic response (Eq. 2 in Fig. 3c). As a result, the initial photocurrent is generated depending on the extent of the oxidization of AA by interband hot holes. On the contrary, glucose is injected into the electrolyte containing AA and glucose oxidase (GOx), followed by the GOx-catalyzed transformation into gluconic acid and H2O2 (Eq. 3 in Fig. 3c). Here, H2O2 decreases the photoelectronic response as a signaling molecule because the reduction potential towards H2O2/H2O is higher than hot electrons, according to Eq. 4 in Fig. 3c. Thus, the photoelectronic response decreases with the addition of glucose, and this trend is opposite to that with the addition of AA into the system. Due to the high reduction potential of H2O2/H2O, a new reaction between H2O2 and AA occurs (Eq. 5 in Fig. 3c). It means that H2O2 competes with hot holes to consume AA, which reduces the reaction rate of AA oxidization with hot holes, leading to a reduction in the photoelectronic response (see details in Section 4 in Supporting information). Benefiting from the improved amount of interband hot holes of Ag@Au that produces a larger initial AA oxidation photocurrent, a sensitive PEC enzyme sensing strategy for glucose detection is constructed.
To test the photostability of the proposed biosensors, the Ag@Au modified photoelectrode was exposed to 410 nm light in the electrolyte without glucose for 1 h. As the result in Fig. S4 (Supporting information), the photocurrent after illumination only decreased by approximately 8% compared with the initial photocurrent before exposure. This result confirms that Ag@Au possesses a high photostability, benefiting the usage in PEC sensing. Furthermore, to improve the performance of the proposed PEC biosensor, the applied potential, the casting amount of Ag@Au NPs, the pH of the reaction solution, and the concentration of AA and GOx were systematically optimized (Figs. S5-S9 in Supporting information).
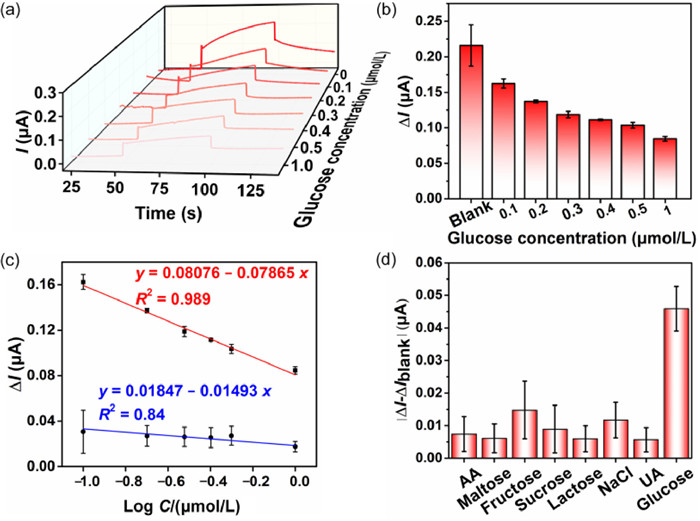
Under the optimized conditions, as the glucose concentration rises, the hot hole-induced photoelectronic response decreases accordingly (Fig. 4a). In order to show the advantages of the Ag@Au NPs-based biosensor more intuitively, we performed the same glucose detection with Au NPs (Section 7 in Supporting information). As expected, an anodic photocurrent is observed for both ITO/Ag@Au and ITO/Au electrodes due to the good electroconductibility of Ag@Au NPs and Au NPs (Fig. 4a and Fig. S10a in Supporting information). The current density of photoelectrodes lessens with the increase of glucose concentration for the two systems. However, if no glucose is added to the solution, the ITO/Ag@Au electrode shows an obviously enhanced anodic photocurrent. It is noted that the photocurrent from ITO/Ag@Au electrode is more than 10 folds of magnitude higher than that from ITO/Au electrode (Fig. 4b and Fig. S10b in Supporting information), which elucidates that Ag@Au NPs could produce more interband hot holes toward AA oxidation than Au NPs do. This behavior is beneficial for enhancing the analytical capability of signal-off PEC biosensors.
Figure 4
Figure 4.
(a) Photocurrent response of Ag@Au NPs with different concentrations of glucose (0.1 µmol/L to 1 µmol/L) irradiated by 410 nm light of 200 mW/cm2. The light was turned on at 50 s and off at 100 s. (b) Corresponding histogram of the change in photocurrent after the addition of glucose. ΔI is defined as the difference between I and I0, where I is the photocurrent at 100 s and I0 is the dark current at 50 s. (c) Linear calibration plot (ΔI vs. the logarithm of glucose concentration) for glucose detection from 0.1 µmol/L to 1 µmol/L under the light (red line) and in dark (blue line). Error bars represent the standard deviations from six repetitive experiments. (d) Specificity test of the prepared PEC sensor for glucose. The effect of adding different substrates on the photocurrent response for the Ag@Au modified electrodes is recorded. ΔIblank is resulted from the sample without any substrates. Here, the blank solution is 38 mL PB containing 20 mmol/L AA. The final concentrations of all substrates are 1 µmol/L. Other conditions were the same as those used in the sensitivity study. All experiments were repeated three times.
By taking the advantage of the improved amount of interband hot holes toward AA oxidation from Ag@Au NPs, a sensitive PEC enzyme sensing strategy for glucose detection is constructed. As depicted in Fig. 4b, different glucose concentrations generate variable photocurrents, which convert biological signals into electrical signals. The linear regression equation of the photocurrent could be expressed as ΔI = 0.08076 − 0.07865logC (where ΔI = I − I0; I0 is the initial current before light illumination, and I is the photocurrent at the end of light illumination), with a correlation coefficient R2 = 0.989 (Fig. 4c, red line). However, the change of current under the same time interval but without light excitation is very little (Fig. 4c, blue line). It means that the improvement of detection performance is mainly ascribed to the Ag@Au enhanced interband hot hole production under light excitation. Notably, for Au NPs, the photocurrent response does not depend on the glucose concentration, making it impossible to establish a linear range (Fig. S10b). Thus, compared with Au NPs, the Ag@Au NPs accumulating interband hot holes show an extended linear range of 0.1–1 µmol/L and a lower limit of detection (LOD) of 0.077 µmol/L at a signal-to-noise ratio (S/N) of 3. Benefiting from the characteristics of Ag LSPR-improved interband transition of Au, the PEC enzyme biosensor based on Ag@Au achieved satisfactory sensitivity. Particularly, the performance of the proposed biosensor is at the top of the range compared with other recently reported PEC or electrochemical glucose biosensors (Table S1 in Supporting information). The enhanced PEC sensing performance is attributed to the hot-hole harvesting at the particle's surface from the interband transition of Au which is multiplied by the LSPR of the Ag core. Anti-interference ability is one of the critical indexes to evaluate the practicability of a sensor. To challenge the specificity of the proposed PEC strategy, some potential interfering substances such as AA, maltose, fructose, sucrose, lactose, Na+, and uric acid (UA) were investigated using the biosensor constructed in this contribution. As shown in Fig. 4d, the detecting solution of 38 mL PB only containing 20 mmol/L AA was used to produce the initial photocurrent, which is marked as ΔIblank. Following the addition of different substances into the system, only glucose produces an obvious differential of the photocurrent. Therefore, the fabricated biosensor possesses superior selectivity towards glucose, which is mainly due to the specificity of the enzyme.
To verify the feasibility of the Ag@Au NPs-based PEC biosensor for practical usage of glucose analysis, the proposed biosensor was employed for the detection of glucose in real human serum samples. In brief, to a 38 mL PB solution (pH 7.4), 38 µL of the untreated serum was added. Subsequently, various volumes of standard glucose solution were injected to make their final concentration in the systems to be 0.1, 0.2, and 1 µmol/L. The chronoamperometry result is displayed in Table S2 in Supporting information, which suggests that the recoveries of the standard glucose were 108.0%, 100.5%, and 107.3% with corresponding relative standard deviation (RSD) of 1.70%, 2.21%, and 4.09% for the 0.1, 0.2, and 1 µmol/L samples, respectively. This result exemplifies that the Ag@Au NPs-enhanced PEC biosensor is adequate to detect glucose in practical application scenarios.
In summary, core-shell Ag@Au NPs were successfully constructed, in which the plasmons in Ag effectively resonate with and promote the hot-hole generation in Au. Through systematic PEC study and relevant investigations, we proved that the multiplication of hot holes is ascribed to the spectral overlap between the characteristic LSPR of Ag core and the interband transition of the Au shell. By introducing the electron donor of AA, the H2O2 from GOx-mediated glucose oxidation competes against the holes accumulated on the Ag@Au NPs photoelectrode for redox reactions, enabling the fabrication of the PEC glucose enzyme sensor. Compared with biosensors based on Au NPs, Ag@Au NPs help achieve a lower detection limit of 77 nmol/L. The improved sensitivity is attributed to the increased amount of hot holes produced in Ag@Au NPs. The above results suggest that the strategy of accumulating interband transition hot holes with LSPR has broad feasibility and promising prospects in designing PEC sensors with better performance.
Acknowledgments
This research was financially supported by the National Natural Science Foundation of China (Nos. 22074038 and 21807032), the Natural Science Foundation of Hunan Province (No. 2019JJ30007), and the Fundamental Research Funds for the Central Universities.
Supplementary materials
Supplementary material associated with this article can be found, in the online version, at doi:10.1016/j.cclet.2023.108588.
T. Hou, N. Xu, X. Song, L. Yang, F. Li, Chin. Chem. Lett. 34 (2023) 107907. doi: 10.1016/j.cclet.2022.107907
Scheme 1
Illustration of the absorbance spectra of Au and Ag. (a) Upper: Localized surface plasmon resonances (LSPR) peak of Au nanoparticles (NPs) is around 530 nm. The intraband and the interband transition regimes are shown in cyan and pink (wavelength longer or shorter than 516 nm), respectively. Lower: The LSPR peak of Ag NPs locates in the range of 400–500 nm, which is governed by the intraband transition (blue regime). (b) Schematic of the interband transition of Au (d-band to sp-band) promoted by LSPR excitation of Ag.
Figure 1
Characterizations of the synthesized core-shell Ag@Au NPs. (a) UV–vis spectra for Ag@Au NPs comprised of 30 nm Ag core and Au shell with different thicknesses. (b) Representative TEM images of the prepared Ag@Au NPs. (c) Low-magnification HAADF-STEM image and the corresponding EDS mapping images related to the elements Ag (d), Au (e), and the overlap of Ag and Au (f).
Figure 2
Comparison of the photoelectrochemical (PEC) characterization between Au and Ag@Au NPs under different wavelengths with the same light intensity. Plasmon excitation-induced potential shifts on the electrode consisting of Au NPs (a) and Ag@Au NPs (b) supported on an indium tin oxide (ITO) substrate, respectively. The electrode was immersed in 0.5 mol/L potassium nitrate and 5 mmol/L sodium citrate, followed by the irradiation of 410, 440, 470 and 525 nm light with an intensity of 200 mW/cm2. (c) Histogram comparison for the difference of photopotential between Au and Ag@Au NPs.
Figure 3
Photoelectronic response (a) and EIS (b) of Ag@Au compared with that of Au NPs in phosphate buffer (PB) solution containing AA under dark and light, respectively. (c) Scheme of the fabrication of photoelectrode and the design of PEC enzyme sensor based on the multiplied interband hot holes in Ag@Au.
Figure 4
(a) Photocurrent response of Ag@Au NPs with different concentrations of glucose (0.1 µmol/L to 1 µmol/L) irradiated by 410 nm light of 200 mW/cm2. The light was turned on at 50 s and off at 100 s. (b) Corresponding histogram of the change in photocurrent after the addition of glucose. ΔI is defined as the difference between I and I0, where I is the photocurrent at 100 s and I0 is the dark current at 50 s. (c) Linear calibration plot (ΔI vs. the logarithm of glucose concentration) for glucose detection from 0.1 µmol/L to 1 µmol/L under the light (red line) and in dark (blue line). Error bars represent the standard deviations from six repetitive experiments. (d) Specificity test of the prepared PEC sensor for glucose. The effect of adding different substrates on the photocurrent response for the Ag@Au modified electrodes is recorded. ΔIblank is resulted from the sample without any substrates. Here, the blank solution is 38 mL PB containing 20 mmol/L AA. The final concentrations of all substrates are 1 µmol/L. Other conditions were the same as those used in the sensitivity study. All experiments were repeated three times.

 DownLoad:

 下载:
下载:


